Download to read offline
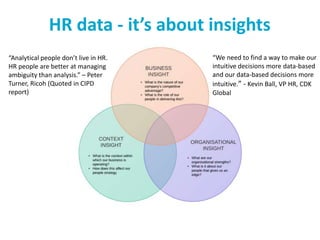


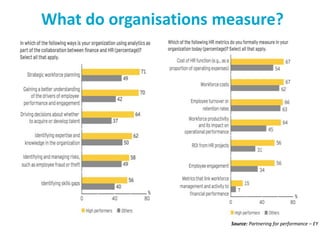


This document discusses using HR data and analytics to gain insights. It provides examples of moving from raw data to metrics, analysis, intelligence, and insights. HR professionals are encouraged to focus on business priorities, integrate data sources, and build skills in data analytics. Example metrics that organizations measure include workforce profile, performance, productivity, rewards, talent, and how these have changed over time when compared to competitors or past periods. Getting started may involve downloading some HR data and exploring what patterns and insights can be discovered.


![The Future of HR: From Metrics to Analytics [Webcast]](https://cdn.slidesharecdn.com/ss_thumbnails/hrmetricstopredictiveanalyticsslideshare-151118001524-lva1-app6892-thumbnail.jpg?width=640&height=640&fit=bounds)


