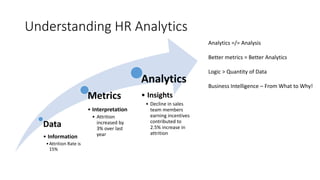
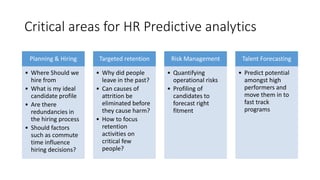
HR Analytics 
What is it good for?
Why HR Analytics? 
• Measure & Manage 
• Link Business and People 
• Improve Performance 
• Increase Return on investment 
• Because, now we can! 
Caretaker Partner Thought Leader
Understanding HR Analytics 
Data 
• Information 
•Attrition Rate is 
15% 
Metrics 
• Interpretation 
• Attrition 
increased by 
3% over last 
year 
Analytics 
• Insights 
• Decline in sales 
team members 
earning incentives 
contributed to 
2.5% increase in 
attrition 
Analytics =/= Analysis 
Better metrics = Better Analytics 
Logic > Quantity of Data 
Business Intelligence – From What to Why!
Elementary Model for HR Analytics 
Collect 
Employee Data 
Hiring Data 
Engagement Surveys 
Attrition Data 
Exit Interviews 
Rewards data 
External Benchmarks 
Performance ratings 
Training Inputs… 
Connect 
Multivariate Analyses 
Regression / 
Correlation 
SWOT 
Six Sigma / Lean 
Risk Analysis 
Correct 
Trend 
Decide 
Prioritize 
Control 
Monitor / Track 
Dashboards 
Continuous 
improvement 
Ref: StratEval Analytics LLC 
Hindsight Insight Foresight
Availability of metrics… 
• External Hire Rate 
• New Position Recruitment 
Ratio 
• Recruitment Source 
Breakdown 
• Rehire Rate 
• Career Step Ratio 
• Cross-Function Mobility 
• Promotion Rate 
• Promotion Speed Ratio 
• Upward Mobility 
• Applicant Ratio 
• Average Interviews per Hire 
• Average Sign-On Bonus 
Expense 
• Average Time to Fill 
• Interviewee Offer Rate 
• New Hire Failure Factor 
• On-Time Talent Delivery Factor 
• Recruitment Cost per Hire 
• Referral Conversion Rate 
• Referral Rate 
• Involuntary Termination Rate 
• New Hire Turnover Contribution 
• Retention Rate 
• Exits by Performance Rating 
• Termination Reason Breakdown 
• Voluntary Termination Rate 
• Employee Engagement Index 
• Market Opportunity Index 
• Turnover Cost Rate—< 1-Year 
Tenure 
• Average Performance Appraisal 
• Employee Upgrade Rate 
• Performance Rating Distribution 
• Performance-Based Pay 
Differential 
• Employee Satisfaction with 
Leadership 
• Manager Quality Index 
• Positions Without Ready 
Candidates Rate 
• Average Training Class Size 
• E-Learning Abandonment 
Rate 
• Training Expense per. 
Employee 
• Training Hours per FTE 8 
• 3. Bonus Actual to Potential 
Rate 
• Bonus Eligibility 
• Compensation Satisfaction 
• Benefits Satisfaction 
• Number of Options 
Exercised per Employee 
• Workforce Demographic 
Structural Tenure 
• Average Workforce Age 
• Ethnic Background 
Breakdown 
• Diversity Demographics 
• Average Span of Control 
• Tooth to tail ratio 
• Staffing Rate—Part 
• Staffing Rate—Temporary 
• Average Workforce Tenure 
• 1. Human Investment Ratio 
• Operating Expense per FTE 
• Operating Profit per FTE 
• Return on Human 
Investment Ratio 7 
• Market Capitalization per 
FTE 
• Revenue per FTE
Analytics don’t happen by themselves
Key remains in linking the data
Applications in Practice 
Manpower 
Planning 
HR 
Analytics 
Hiring 
HR Ops 
Learning & 
Devpt 
Performance 
Attrition 
Succession 
Planning 
Compensation 
& Rewards
Critical areas for HR Predictive analytics 
Planning & Hiring 
• Where Should we 
hire from 
• What is my ideal 
candidate profile 
• Are there 
redundancies in 
the hiring process 
• Should factors 
such as commute 
time influence 
hiring decisions? 
Targeted retention 
• Why did people 
leave in the past? 
• Can causes of 
attrition be 
eliminated before 
they cause harm? 
• How to focus 
retention 
activities on 
critical few 
people? 
Risk Management 
• Quantifying 
operational risks 
• Profiling of 
candidates to 
forecast right 
fitment 
Talent Forecasting 
• Predict potential 
amongst high 
performers and 
move them in to 
fast track 
programs
Pitfalls of HR Analytics
Some Pointers to Remember 
• Start with the problem, not the data 
• Explore the opportunities. Avoid Analysis paralysis 
• Data cleaning and consistency continues to be a concern 
• Computer science cannot replace curiosity
Thank You

HR Analytics - What is it good for?

  • 1.
    HR Analytics Whatis it good for?
  • 3.
    Why HR Analytics? • Measure & Manage • Link Business and People • Improve Performance • Increase Return on investment • Because, now we can! Caretaker Partner Thought Leader
  • 4.
    Understanding HR Analytics Data • Information •Attrition Rate is 15% Metrics • Interpretation • Attrition increased by 3% over last year Analytics • Insights • Decline in sales team members earning incentives contributed to 2.5% increase in attrition Analytics =/= Analysis Better metrics = Better Analytics Logic > Quantity of Data Business Intelligence – From What to Why!
  • 5.
    Elementary Model forHR Analytics Collect Employee Data Hiring Data Engagement Surveys Attrition Data Exit Interviews Rewards data External Benchmarks Performance ratings Training Inputs… Connect Multivariate Analyses Regression / Correlation SWOT Six Sigma / Lean Risk Analysis Correct Trend Decide Prioritize Control Monitor / Track Dashboards Continuous improvement Ref: StratEval Analytics LLC Hindsight Insight Foresight
  • 6.
    Availability of metrics… • External Hire Rate • New Position Recruitment Ratio • Recruitment Source Breakdown • Rehire Rate • Career Step Ratio • Cross-Function Mobility • Promotion Rate • Promotion Speed Ratio • Upward Mobility • Applicant Ratio • Average Interviews per Hire • Average Sign-On Bonus Expense • Average Time to Fill • Interviewee Offer Rate • New Hire Failure Factor • On-Time Talent Delivery Factor • Recruitment Cost per Hire • Referral Conversion Rate • Referral Rate • Involuntary Termination Rate • New Hire Turnover Contribution • Retention Rate • Exits by Performance Rating • Termination Reason Breakdown • Voluntary Termination Rate • Employee Engagement Index • Market Opportunity Index • Turnover Cost Rate—< 1-Year Tenure • Average Performance Appraisal • Employee Upgrade Rate • Performance Rating Distribution • Performance-Based Pay Differential • Employee Satisfaction with Leadership • Manager Quality Index • Positions Without Ready Candidates Rate • Average Training Class Size • E-Learning Abandonment Rate • Training Expense per. Employee • Training Hours per FTE 8 • 3. Bonus Actual to Potential Rate • Bonus Eligibility • Compensation Satisfaction • Benefits Satisfaction • Number of Options Exercised per Employee • Workforce Demographic Structural Tenure • Average Workforce Age • Ethnic Background Breakdown • Diversity Demographics • Average Span of Control • Tooth to tail ratio • Staffing Rate—Part • Staffing Rate—Temporary • Average Workforce Tenure • 1. Human Investment Ratio • Operating Expense per FTE • Operating Profit per FTE • Return on Human Investment Ratio 7 • Market Capitalization per FTE • Revenue per FTE
  • 7.
  • 8.
    Key remains inlinking the data
  • 9.
    Applications in Practice Manpower Planning HR Analytics Hiring HR Ops Learning & Devpt Performance Attrition Succession Planning Compensation & Rewards
  • 10.
    Critical areas forHR Predictive analytics Planning & Hiring • Where Should we hire from • What is my ideal candidate profile • Are there redundancies in the hiring process • Should factors such as commute time influence hiring decisions? Targeted retention • Why did people leave in the past? • Can causes of attrition be eliminated before they cause harm? • How to focus retention activities on critical few people? Risk Management • Quantifying operational risks • Profiling of candidates to forecast right fitment Talent Forecasting • Predict potential amongst high performers and move them in to fast track programs
  • 11.
    Pitfalls of HRAnalytics
  • 12.
    Some Pointers toRemember • Start with the problem, not the data • Explore the opportunities. Avoid Analysis paralysis • Data cleaning and consistency continues to be a concern • Computer science cannot replace curiosity
  • 14.