Carbon Track & Trace Sensors Provide Real-Time GHG Data for Vejle City Planning
•Download as PPTX, PDF•
1 like•859 views

Presentation of the CTT project and the city perspective of Vejle, Denmark. Presented byJette Vindum and Dirk Ahlers. http://carbontrackandtrace.com/

Recommended
Recommended
More Related Content
What's hot
What's hot (19)
Viewers also liked
Viewers also liked (14)
Similar to Carbon Track & Trace Sensors Provide Real-Time GHG Data for Vejle City Planning
Similar to Carbon Track & Trace Sensors Provide Real-Time GHG Data for Vejle City Planning (20)
More from Dirk Ahlers
More from Dirk Ahlers (20)
Recently uploaded
Recently uploaded (20)
Carbon Track & Trace Sensors Provide Real-Time GHG Data for Vejle City Planning
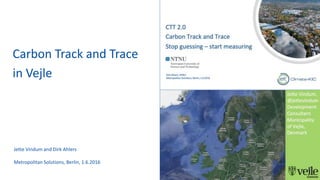
- 1. Carbon Track and Trace in Vejle Jette Vindum and Dirk Ahlers Metropolitan Solutions, Berlin, 1.6.2016
- 2. CTT 2.0 Carbon Track and Trace Stop guessing – start measuring Dirk Ahlers, NTNU Metropolitan Solutions, Berlin, 1.6.2016
- 3. Carbon Track & Trace - CTT • Monitoring, Reporting, Understanding of city-level greenhouse gas emissions • Both emission inventories and real-time local measurements • Better accounting leads to better prioritization of mitigation projects • Part of larger SmartCities approaches
- 4. Ecosystem • CTT 2.0 consortium • NTNU, DTU • ICLEI-World, ICLEI-Europe, LSCE, South Pole Group, Virtual City Systems • Trondheim Municipality, Vejle Municipality, Sør- Trøndelag Fylkeskommune, T:Lab, NumaScale, Norwegian Institute for Air Research • Additional local projects, collaboration with DTU, H2020 proposals, Smart Sustainable Cities initiatives
- 5. Approach and Activities •Integration of measured GHG data into city planning and decision support •Deployment of LoRa sensor network in Trondheim and Vejle •Development of an analytics framework of GHC emissions •Work towards GPC-compliant inventories • Scaling out, deployment/testing internationally
- 8. Conclusion • Using local data helps to see effects of local actions. • Good data is a foundation for better decision making. • To get the most out of the existing open datasets, we need to invest in ground sensors. This will enable detailed monitoring of city-level emissions. • Low-cost sensors can give more detailed local insights. • Open datasets can reveal patterns in emissions. • CTT allows for fast feedback loops for decision makers.
- 11. 56.000 people in Vejle City 112.000 in the municipality of Vejle 1000 more every year 9.th in Denmark Part of East-jutland cluster of 1 mio. peolpe
- 12. City centre in a river valley. Geographical challenges due to water and trafic – it all piles op in the low lying areas.
- 13. Development • Focus on energy and sustainability since 2007 • Resilience strategy 2016 Shift in focus: CO2 Energy - kWh Economy, euro/kWh Security of supply Resilience
- 14. Needs CO2-inventories => Baseline Activities => doesn’t effect baseline Actual level and impact => not visible We need new approches => CTT
- 15. Sensors and cars Different traffic situations Different controlling of traffic lights Reference station in country side
- 16. Hopes • Data are open - data.vejle.dk • Data are visible • Data are useful • Data are understandable
- 17. Expectations • Understanding of current level • Is there a change over time? • Does our activities have an impact? • Can we change plans on basis of data • Can knowledge move people?
- 18. Important additional learnings • LoRaWAN network • Experience with city network and IoT – how can we use that in Vejle? • Gain knowledge inhouse and get ready for the future
- 19. Jette Vindum, Development Consultant @jettevindum jevin@vejle.dk +45 24 76 63 33 Municipality of Vejle, Denmark www.vejle.dk
Editor's Notes
- We have shifted focus from CO2 calculations to Resiliens. In resiliens you talk about beeing robust towards changes. It is not, that we neclect CO2, on the contrary, but we realise that elaborating it, and trying to make behaviour changes telling about CO2 does not bring about changes. In resiliens we have identified to major risks and stressors, they are flooding and transportation.
- Sensors are deployed in the city for a number of reasons we would like to use data to enhance our city by improved planning and more qualified investments.
- It is important to us, that data are useful and understandable. That the gap between the academic world and the life in the city is as small as possible