Download to read offline

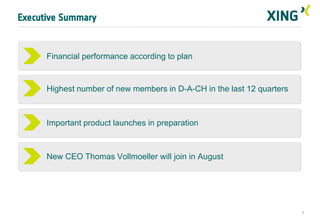
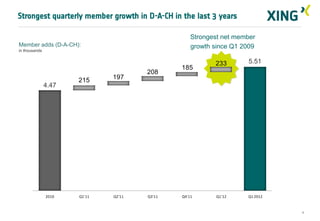
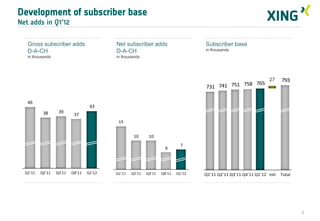
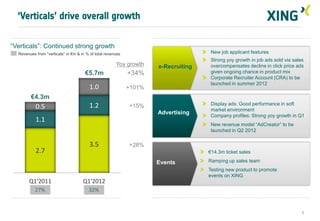
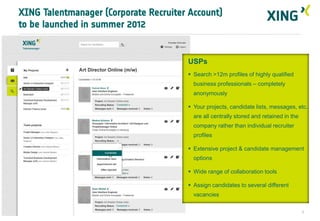
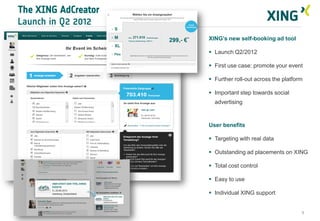
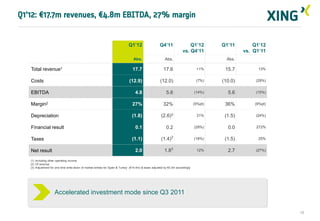
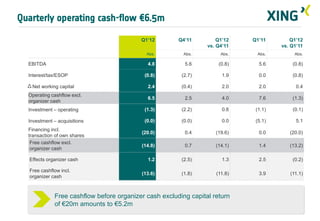


XING reported strong financial results for Q1 2012, in line with expectations. Key highlights included: - Highest number of new members in the D-A-CH region in the last 12 quarters. - Important new product launches planned for recruitment and advertising verticals. - Revenue of €17.7 million and EBITDA of €4.8 million, reflecting continued investments to drive future growth. - Strong operating cash flow of €6.5 million despite accelerated investment phase since Q3 2011.


![Adir regev analytics - go - jan2012 [compatibility mode]](https://cdn.slidesharecdn.com/ss_thumbnails/adirregev-analytics-go-jan2012compatibilitymode-120122075256-phpapp01-thumbnail.jpg?width=640&height=640&fit=bounds)


