Downloaded 189 times


![Questions? SAP Help portal http://help.sap.com/businessobject/product_guides/ Aparna Srinivasan [email_address] 91-91764 09949](https://image.slidesharecdn.com/xcelsiustipsandtrickspresent-101220003421-phpapp02/85/Xcelsius-tips-and-tricks-for-your-Enterprise-35-320.jpg)
![[ ] Thank you for participating. SESSION CODE: 513 Please remember to complete and return your evaluation form following this session. For ongoing education on this area of focus, visit the Year-Round Community page at www.asug.com/yrc](https://image.slidesharecdn.com/xcelsiustipsandtrickspresent-101220003421-phpapp02/85/Xcelsius-tips-and-tricks-for-your-Enterprise-36-320.jpg)

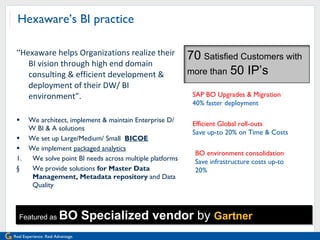
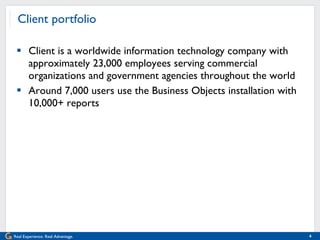
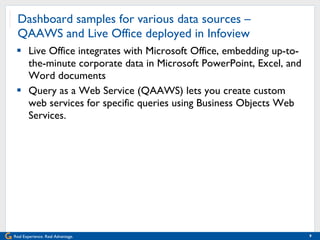
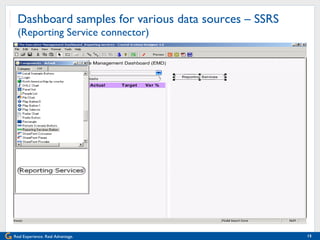
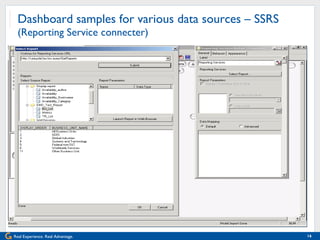
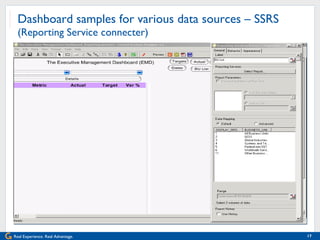
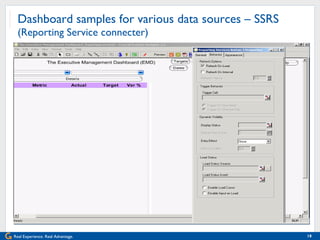
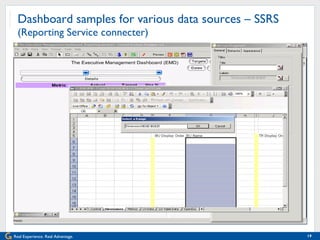
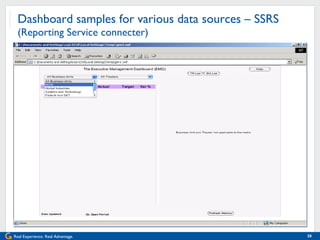
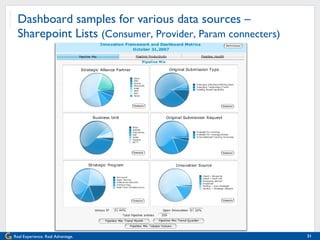
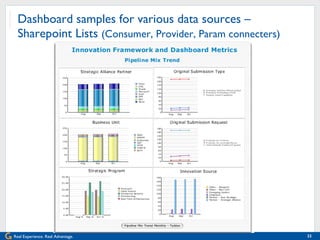
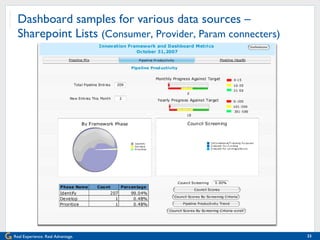
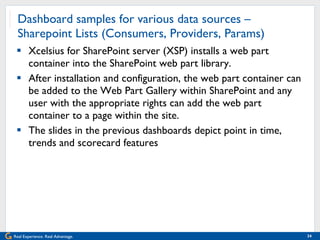
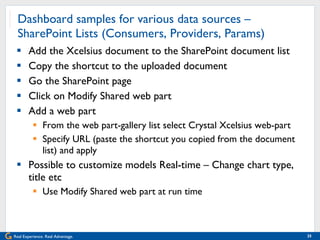
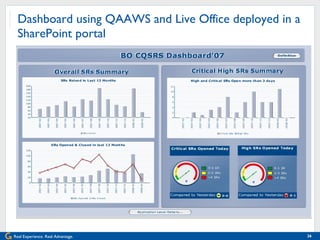
The document provides an overview of Hexaware Technologies and its services, focusing on their business intelligence (BI) capabilities and implementation of Xcelsius dashboards. It outlines the features of Xcelsius, including data sourcing from various platforms, customization options, and deployment strategies, while also sharing tips and tricks for effective dashboard implementation. Additionally, it emphasizes Hexaware's expertise in BI consulting and their established presence in the IT industry with a broad client portfolio.


![Microsoft Power Stack 2019 [Power BI, Excel, Azure & Friends]](https://cdn.slidesharecdn.com/ss_thumbnails/cl5khvpdqxat1towwmgy-signature-ad54afc6bb6f90c90525c52bba803ad4bbc4540a1573646d15de668783fb664a-poli-170212213019-thumbnail.jpg?width=640&height=640&fit=bounds)