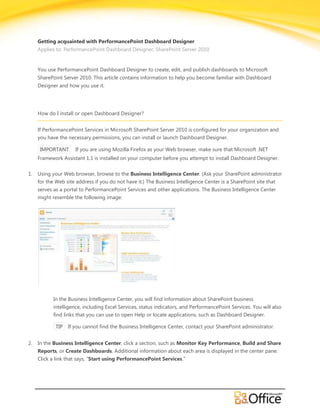
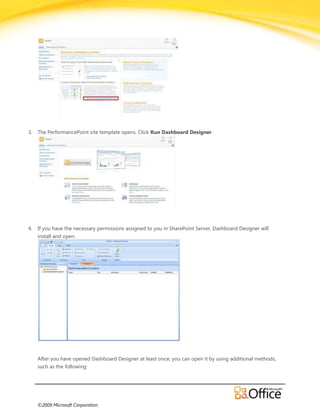
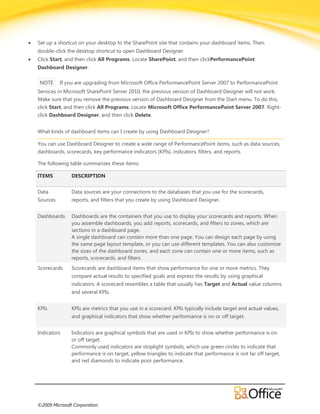
SlideShare a Scribd company logo
Getting acquainted with PerformancePoint Dashboard Designer
     Applies to: PerformancePoint Dashboard Designer, SharePoint Server 2010


     You use PerformancePoint Dashboard Designer to create, edit, and publish dashboards to Microsoft
     SharePoint Server 2010. This article contains information to help you become familiar with Dashboard
     Designer and how you use it.


     How do I install or open Dashboard Designer?


     If PerformancePoint Services in Microsoft SharePoint Server 2010 is configured for your organization and
     you have the necessary permissions, you can install or launch Dashboard Designer.

      IMPORTANT       If you are using Mozilla Firefox as your Web browser, make sure that Microsoft .NET
     Framework Assistant 1.1 is installed on your computer before you attempt to install Dashboard Designer.


1.   Using your Web browser, browse to the Business Intelligence Center. (Ask your SharePoint administrator
     for the Web site address if you do not have it.) The Business Intelligence Center is a SharePoint site that
     serves as a portal to PerformancePoint Services and other applications. The Business Intelligence Center
     might resemble the following image:


            In the Business Intelligence Center, you will find information about SharePoint business
            intelligence, including Excel Services, status indicators, and PerformancePoint Services. You will also
            find links that you can use to open Help or locate applications, such as Dashboard Designer.

             TIP If you cannot find the Business Intelligence Center, contact your SharePoint administrator.


2.   In the Business Intelligence Center, click a section, such as Monitor Key Performance, Build and Share
     Reports, or Create Dashboards. Additional information about each area is displayed in the center pane:
     Click a link that says, “Start using PerformancePoint Services.”
3.   The PerformancePoint site template opens. Click Run Dashboard Designer.


4.   If you have the necessary permissions assigned to you in SharePoint Server, Dashboard Designer will
     install and open.


     After you have opened Dashboard Designer at least once, you can open it by using additional methods,
     such as the following:


     ©2009 Microsoft Corporation.
Set up a shortcut on your desktop to the SharePoint site that contains your dashboard items. Then,
double-click the desktop shortcut to open Dashboard Designer.
Click Start, and then click All Programs. Locate SharePoint, and then clickPerformancePoint
Dashboard Designer.

 NOTE     If you are upgrading from Microsoft Office PerformancePoint Server 2007 to PerformancePoint
Services in Microsoft SharePoint Server 2010, the previous version of Dashboard Designer will not work.
Make sure that you remove the previous version of Dashboard Designer from the Start menu. To do this,
click Start, and then click All Programs. Locate Microsoft Office PerformancePoint Server 2007. Right-
click Dashboard Designer, and then click Delete.


What kinds of dashboard items can I create by using Dashboard Designer?

You can use Dashboard Designer to create a wide range of PerformancePoint items, such as data sources,
dashboards, scorecards, key performance indicators (KPIs), indicators, filters, and reports.

The following table summarizes these items:

ITEMS          DESCRIPTION


Data           Data sources are your connections to the databases that you use for the scorecards,
Sources        reports, and filters that you create by using Dashboard Designer.


Dashboards     Dashboards are the containers that you use to display your scorecards and reports. When
               you assemble dashboards, you add reports, scorecards, and filters to zones, which are
               sections in a dashboard page.
               A single dashboard can contain more than one page. You can design each page by using
               the same page layout template, or you can use different templates. You can also customize
               the sizes of the dashboard zones, and each zone can contain one or more items, such as
               reports, scorecards, and filters.
Scorecards     Scorecards are dashboard items that show performance for one or more metrics. They
               compare actual results to specified goals and express the results by using graphical
               indicators. A scorecard resembles a table that usually has Target and Actual value columns
               and several KPIs.


KPIs           KPIs are metrics that you use in a scorecard. KPIs typically include target and actual values,
               and graphical indicators that show whether performance is on or off target.


Indicators     Indicators are graphical symbols that are used in KPIs to show whether performance is on
               or off target.
               Commonly used indicators are stoplight symbols, which use green circles to indicate that
               performance is on target, yellow triangles to indicate that performance is not far off target,
               and red diamonds to indicate poor performance.


©2009 Microsoft Corporation.
Filters        Filters are individual dashboard items that enable dashboard users to focus on specific
               information.
               For example, you might create a Geography filter and then connect that filter to a report or
               a scorecard. This enables a user to view information for a specific geographical region.
Reports        Reports are dashboard items that display information in charts or tables.
               You can create a wide variety of reports by using Dashboard Designer. Examples include
               bar charts, line charts, pie charts, and tables, which are known as grids. In addition, you can
               create some reports directly in Dashboard Designer, and you can create Web Parts to
               display existing reports that are hosted on other servers.


WHERE ARE MY DASHBOARD ITEMS STORED?
All your PerformancePoint dashboard items are saved in designated SharePoint lists and document
libraries that are set up when PerformancePoint Services is configured. The following image shows a list of
SharePoint lists and document libraries that you will typically see in PerformancePoint Services:


The following table describes these SharePoint lists and libraries, where your dashboard content and
other files are stored.

ITEMS                  DESCRIPTION


Data Connections       The data sources that you use for your KPIs, scorecards, reports, and filters are
                       saved in a Data Connections document library that contains data sources together
                       with additional information, such as server and security settings.
                       This document library is typically called Data Connections, but SharePoint
                       administrators can change its name when they configure PerformancePoint
                       Services.
Individual             Scorecards, reports, filters, dashboard pages, and other dashboard items are saved


©2009 Microsoft Corporation.
dashboard              in a PerformancePoint Content list.
elements,               NOTE All dashboard pages are stored in the PerformancePoint Content list.
including:             However, live dashboards that have been deployed to a SharePoint site are also
                       stored in a different document library, which is called Dashboards.
Indicators             This list is typically called PerformancePoint Content, but SharePoint
KPIs                   administrators can change its name when they configure PerformancePoint
Scorecards             Services.
Reports
Filters
Dashboard pages


Dashboards             After you deploy a dashboard, it is saved in a Dashboards document library that
                       contains only dashboards. Individual dashboard items are not stored here.
                       This list is typically called Dashboards, but SharePoint administrators can change its
                       name when they configure PerformancePoint Services.
Files and other        Other kinds of files, documents, and so forth are saved in a Documents document
miscellaneous          library. The items that are saved here are not typically items that you use in your
documents              dashboards, but can include additional information that users might find helpful. In
                       addition, dashboard users can export some kinds of dashboard items to Microsoft
                       PowerPoint or Microsoft Excel, and then store those files in the Documents library.


Because dashboard items are saved directly to SharePoint Server, you and other dashboard authors can
save time and effort by reusing items. For example, you can create an analytic chart and then use that
report in multiple dashboards.

You can also copy and paste dashboard items, and then make changes to the copied items. In addition,
you can control who can view or use your dashboard content by assigning SharePoint permissions to
individual dashboard elements.

 NOTE     In order to view and assign SharePoint permissions, you must have Full Control or Site
Administrator permissions. If you do not have the necessary permissions, you will not be able to view or
edit permissions for any dashboard items, including the items that you create. Contact your SharePoint
administrator for more information.


How do I navigate Dashboard Designer?

The Dashboard Designer user interface includes a ribbon, a Workspace Browser pane, a center pane, and
a Details pane that you use to create, view, and edit dashboard items.


©2009 Microsoft Corporation.
The workspace also includes the Microsoft Office button menu that you can use to save your workspace
files, deploy a dashboard, and change your server connection.


THE RIBBON
The ribbon includes the Microsoft Office Backstage button and three tabs: the Home tab, the Edit tab,
and the Create tab.


The Microsoft Office Backstage button
Click the Microsoft Office button to access Dashboard Designer settings and other Save options. There,
you can also view workspace files that you recently created or saved.


Click Designer Options to open the Options dialog box. The Options dialog box includes three
tabs: Personalize, Server, and Resources.


©2009 Microsoft Corporation.
Use the Personalize tab to specify the default location for your workspace files and whether to use
wizards to create your scorecards.
Use the Server tab to view or change the server that you connect to when you use Dashboard Designer.
Use the Resources tab to find out which version of Dashboard Designer you are using.


The Home tab in the ribbon
The Home tab includes toolbar commands that you can use to view and open dashboard items.

For example, in the Workspace section of the Home tab, you click Refresh to refresh the list of
dashboard items that have been published to SharePoint Server.


The Edit tab in the ribbon
The Edit tab includes toolbar commands that you can use to change dashboard items that you or other
dashboard authors have created.

The Edit tab is dynamic. It displays only the toolbar commands that are specific to the particular
dashboard items that you want to edit. That is, the Edit tab changes according to the type of dashboard
item that is open in the center pane of the workspace.

For example, if you open a KPI, the Edit tab displays toolbar commands that enable you to change
number formats, such as changing the number of decimal places that are displayed in numeric values.

If you open a scorecard, the Edit tab displays various toolbar commands that you can use. They
include Update. Use the Update command to refresh the information that is displayed after you have
made changes to your scorecard.

If you open an analytic grid for editing, the Edit tab displays various toolbar commands that enable you
to change the font, number, report view, and other settings.

And, if you open a dashboard for editing, the Edit tab displays toolbar commands that are specific to
working with dashboard zones or items within zones.


©2009 Microsoft Corporation.
For some dashboard items, such as filters, the Edit tab has no toolbar commands. For those items, use
the Editor and Properties tabs in the center pane of the workspace to make your changes.


The Create tab in the ribbon
The Create tab includes toolbar commands that you use to create your dashboard items. Each toolbar
command opens a wizard that guides you as you create an item. For example, when you click Dashboard,
the Select a Dashboard Page Template dialog box opens. You select a page layout template for the first
page of your dashboard, and then you start to assemble your dashboard.


THE WORKSPACE BROWSER PANE
The Workspace Browser pane is located on the left side of the screen in Dashboard Designer. You use
the Workspace Browser pane to view, open, and save dashboard items. You also use the Workspace
Browser to deploy your dashboards. The Workspace Browser contains two categories of dashboard
items: PerformancePoint Content, and Data Connections.


Select PerformancePoint Content to create, view, or open indicators, KPIs, scorecards, reports, filters,
and dashboards
Select Data Connections to create, view, or open data sources.

The Workspace Browser uses right-click functionality to perform many tasks. For example, when you
create an item and you want to save it, in the Workspace Browser, right-click the item, and then
click Save.

Similarly, to deploy a dashboard, in the Workspace Browser, right-click the dashboard, and then
click Deploy to SharePoint.


THE CENTER PANE OF THE WORKSPACE
You use the center pane to view, create, and change dashboard items. The center pane changes,
depending on where the focus is in the Workspace Browser. For example, when you
click PerformancePoint Content or Data Connections in the Workspace Browser, you see
the SharePoint and Workspace tabs in the center pane. And, when you click a specific item in
the Workspace Browser, you see two, three, or four tabs in the center pane. Those tabs vary according to
the type of dashboard item that you are working on.


The SharePoint and Workspace tabs
The SharePoint and Workspace tabs are available when an item is selected in the Workspace Browser.
You use these tabs to view lists of dashboard items that you and other dashboard authors have created.


©2009 Microsoft Corporation.
TAB               DESCRIPTION


The               The SharePoint tab displays a list of the dashboard items that you and other dashboard
SharePoint        authors have saved to SharePoint Server. Depending on whether PerformancePoint
tab               Content or Data Connections is selected in the Workspace Browser, you can either see
                  all the data sources or all the other kinds of dashboard items that are available displayed
                  in the center pane.


The               The Workspace tab displays a collection of dashboard items that are saved to SharePoint
Workspace         Server. In particular, the Workspace tab displays dashboard items that you have created
tab               or opened for editing.


When you first open Dashboard Designer, you are working in an untitled, unsaved workspace file. As you
create and open dashboard items, those items become visible on both the SharePoint tab and
the Workspace tab in the center pane.

When you save your workspace file, you create a list of dashboard items that you can then view on
the Workspace tab. You can change which items are included in your workspace file by using the toolbar
commands that are available in the Workspace section of the Home tab in the ribbon.

 IMPORTANT Dashboard items are always saved directly to SharePoint Server, and not to your
computer. However, when you save your workspace file (this is optional), the workspace file is saved to
your computer.


The Editor, Properties, Design, Query, Time, and View tabs
 NOTE    You use the Editor, Properties, Design, Query, Time, and View tabs to configure or change
individual dashboard items. These tabs are available when an item is selected in the Workspace Browser,
or when you are creating a dashboard item. Not all the tabs listed below are available at the same time for
a particular dashboard item. Only the tabs that apply to that item are visible in the center pane.


THE PROPERTIES TAB
The Properties tab is available for all types of dashboard items. You use theProperties tab to specify an
item's name, description, owner (referred to as Person Responsible), and the display folder for that item in
its SharePoint list or document library.

 NOTE    In Dashboard Designer, you can create and use display folders for your dashboard items. In the
SharePoint lists and document libraries that contain your dashboard items, those display folders are listed
in a Display Folder column. You use that Display Folder column to filter and group your dashboard
items together.


©2009 Microsoft Corporation.
THE EDITOR TAB
The Editor tab is available for most types of dashboard items. They include the following:

Dashboards
Scorecards
KPIs
Filters
Indicators
Reports (except analytic charts and grids, which have the Design tab)

You use the Editor tab to add or change the data that you use in your dashboard items. In addition, you
can use the Editor tab to preview some types of dashboard items, such as scorecards and reports.


THE DESIGN TAB
The Design tab is available for analytic charts and grids. You use the Design tab to add or change the
Analysis Services data that you use in your analytic chart or grid. You can also use the Design tab to
preview your report.


THE QUERY TAB
The Query tab is available for analytic charts and grids. You use the Query tab to view, write, or change
the Multidimensional Expressions (MDX) query that is used to display information in your analytic report.

 IMPORTANT When you create your analytic chart or grid by using a custom query, your report will not
be interactive. That is, your dashboard users will be unable to explore data by drilling up or down to see
higher or lower levels of detail in your report.


THE TIME TAB
The Time tab is available for your data sources. You use the Time tab to configure a data source to work
with Time Intelligence by specifying time period levels, such as years, months, or days.


THE VIEW TAB
The View tab is available for some types of data sources, such as tabular data sources. You use
the View tab to preview your data or to specify column definitions.


THE DETAILS PANE
The Details pane is located on the left side in Dashboard Designer. The Details pane is only visible when
you are creating, viewing, or modifying a specific dashboard item. That is, the Details pane is only visible
when a specific dashboard item is selected in the Workspace Browser.

You use the Details pane to add or change the content that you display in a dashboard item. The items
that are available in the Details pane vary according to the dashboard item that you are working on.


©2009 Microsoft Corporation.
For example, when you have an analytic chart or grid open, the Details pane lists items, such as
dimensions, measures, and named sets. These items are available in the SQL Server Analysis Services cube
that is used by that report.

When you have a scorecard open, the Details pane lists KPIs, metrics, aggregations, dimensions, and
other items that are relevant to that scorecard.


©2009 Microsoft Corporation.

More Related Content

What's hot

Share point 2013
Share point 2013Share point 2013
Share point 2013LiquidHub
 
Sharepoint 2013 upgrade process
Sharepoint 2013 upgrade processSharepoint 2013 upgrade process
Sharepoint 2013 upgrade processLiquidHub
 
Share point overview
Share point overviewShare point overview
Share point overview
Muhammad Younis
 
Summary Project Server Psi
Summary Project Server PsiSummary Project Server Psi
Summary Project Server PsiPhuong Nguyen
 
Developing ssrs-reports-for-dynamics-ax-120402001948-phpapp01
Developing ssrs-reports-for-dynamics-ax-120402001948-phpapp01Developing ssrs-reports-for-dynamics-ax-120402001948-phpapp01
Developing ssrs-reports-for-dynamics-ax-120402001948-phpapp01Ahmed Farag
 
Xml transformation-doc
Xml transformation-docXml transformation-doc
Xml transformation-docAmit Sharma
 
informatica
informaticainformatica
informatica
bispsolutions
 
Sql business intelligence
Sql business intelligenceSql business intelligence
Sql business intelligence
Sqlperfomance
 
Advanced SharePoint 2013 Site Administration
Advanced SharePoint 2013 Site AdministrationAdvanced SharePoint 2013 Site Administration
Advanced SharePoint 2013 Site Administration
Learning SharePoint
 
Building End-to-End Solutions Leveraging SharePoint 2010 and Office 2010 Appl...
Building End-to-End Solutions Leveraging SharePoint 2010 and Office 2010 Appl...Building End-to-End Solutions Leveraging SharePoint 2010 and Office 2010 Appl...
Building End-to-End Solutions Leveraging SharePoint 2010 and Office 2010 Appl...
Planet Technologies
 
Microsoft SQL Server - Developing Rich Reporting Solutions Presentation
Microsoft SQL Server - Developing Rich Reporting Solutions PresentationMicrosoft SQL Server - Developing Rich Reporting Solutions Presentation
Microsoft SQL Server - Developing Rich Reporting Solutions PresentationMicrosoft Private Cloud
 
Creating Workflows Windows Share Point Services
Creating Workflows Windows Share Point ServicesCreating Workflows Windows Share Point Services
Creating Workflows Windows Share Point ServicesLiquidHub
 
Jordan Remix - SharePoint 2010
Jordan Remix - SharePoint 2010Jordan Remix - SharePoint 2010
Jordan Remix - SharePoint 2010
Jordan Remix
 
Hol262 Building%20 Info Path%20 Forms%20that%20 Run%20as%20 Both%20 Rich%20 C...
Hol262 Building%20 Info Path%20 Forms%20that%20 Run%20as%20 Both%20 Rich%20 C...Hol262 Building%20 Info Path%20 Forms%20that%20 Run%20as%20 Both%20 Rich%20 C...
Hol262 Building%20 Info Path%20 Forms%20that%20 Run%20as%20 Both%20 Rich%20 C...LiquidHub
 
Hyperion planning integration with odi
Hyperion planning integration with odiHyperion planning integration with odi
Hyperion planning integration with odiAmit Sharma
 
Advanced SharePoint Server Concepts
Advanced SharePoint Server ConceptsAdvanced SharePoint Server Concepts
Advanced SharePoint Server Concepts
Learning SharePoint
 
Update strategy-transformation
Update strategy-transformationUpdate strategy-transformation
Update strategy-transformationAmit Sharma
 

What's hot (17)

Share point 2013
Share point 2013Share point 2013
Share point 2013
 
Sharepoint 2013 upgrade process
Sharepoint 2013 upgrade processSharepoint 2013 upgrade process
Sharepoint 2013 upgrade process
 
Share point overview
Share point overviewShare point overview
Share point overview
 
Summary Project Server Psi
Summary Project Server PsiSummary Project Server Psi
Summary Project Server Psi
 
Developing ssrs-reports-for-dynamics-ax-120402001948-phpapp01
Developing ssrs-reports-for-dynamics-ax-120402001948-phpapp01Developing ssrs-reports-for-dynamics-ax-120402001948-phpapp01
Developing ssrs-reports-for-dynamics-ax-120402001948-phpapp01
 
Xml transformation-doc
Xml transformation-docXml transformation-doc
Xml transformation-doc
 
informatica
informaticainformatica
informatica
 
Sql business intelligence
Sql business intelligenceSql business intelligence
Sql business intelligence
 
Advanced SharePoint 2013 Site Administration
Advanced SharePoint 2013 Site AdministrationAdvanced SharePoint 2013 Site Administration
Advanced SharePoint 2013 Site Administration
 
Building End-to-End Solutions Leveraging SharePoint 2010 and Office 2010 Appl...
Building End-to-End Solutions Leveraging SharePoint 2010 and Office 2010 Appl...Building End-to-End Solutions Leveraging SharePoint 2010 and Office 2010 Appl...
Building End-to-End Solutions Leveraging SharePoint 2010 and Office 2010 Appl...
 
Microsoft SQL Server - Developing Rich Reporting Solutions Presentation
Microsoft SQL Server - Developing Rich Reporting Solutions PresentationMicrosoft SQL Server - Developing Rich Reporting Solutions Presentation
Microsoft SQL Server - Developing Rich Reporting Solutions Presentation
 
Creating Workflows Windows Share Point Services
Creating Workflows Windows Share Point ServicesCreating Workflows Windows Share Point Services
Creating Workflows Windows Share Point Services
 
Jordan Remix - SharePoint 2010
Jordan Remix - SharePoint 2010Jordan Remix - SharePoint 2010
Jordan Remix - SharePoint 2010
 
Hol262 Building%20 Info Path%20 Forms%20that%20 Run%20as%20 Both%20 Rich%20 C...
Hol262 Building%20 Info Path%20 Forms%20that%20 Run%20as%20 Both%20 Rich%20 C...Hol262 Building%20 Info Path%20 Forms%20that%20 Run%20as%20 Both%20 Rich%20 C...
Hol262 Building%20 Info Path%20 Forms%20that%20 Run%20as%20 Both%20 Rich%20 C...
 
Hyperion planning integration with odi
Hyperion planning integration with odiHyperion planning integration with odi
Hyperion planning integration with odi
 
Advanced SharePoint Server Concepts
Advanced SharePoint Server ConceptsAdvanced SharePoint Server Concepts
Advanced SharePoint Server Concepts
 
Update strategy-transformation
Update strategy-transformationUpdate strategy-transformation
Update strategy-transformation
 

Similar to Getting Acquainted with PerformancePoint Dashboard designer - SharePoint 2010

Create a balanced scorecard123 steps
Create a balanced scorecard123 stepsCreate a balanced scorecard123 steps
Create a balanced scorecard123 steps
Manoj Sharma
 
Create a balanced scorecard
Create a balanced scorecardCreate a balanced scorecard
Create a balanced scorecardSteve Xu
 
Share point answer the question
Share point answer the questionShare point answer the question
Share point answer the question
than sare
 
SharePoint PerformancePoint 101
SharePoint PerformancePoint 101SharePoint PerformancePoint 101
SharePoint PerformancePoint 101
Matthew Carter
 
bi-publisher.pptx
bi-publisher.pptxbi-publisher.pptx
bi-publisher.pptx
kjkombrink
 
Power bi slide share pdf it is a very important
Power bi slide share pdf it is a very importantPower bi slide share pdf it is a very important
Power bi slide share pdf it is a very important
Satyabratarath5
 
Office Share Point Server 2007 Product Guide
Office Share Point Server 2007 Product GuideOffice Share Point Server 2007 Product Guide
Office Share Point Server 2007 Product Guide
UGAIA
 
Presentation on Crystal Reports and Business Objects Enterprise Features
Presentation on Crystal Reports and Business Objects Enterprise FeaturesPresentation on Crystal Reports and Business Objects Enterprise Features
Presentation on Crystal Reports and Business Objects Enterprise Features
InfoDev
 
LIBA++Lecture+Notes_Power+BI.docx.pdf
LIBA++Lecture+Notes_Power+BI.docx.pdfLIBA++Lecture+Notes_Power+BI.docx.pdf
LIBA++Lecture+Notes_Power+BI.docx.pdf
Divya Thakur
 
CVNUG - Share Point Development
CVNUG - Share Point DevelopmentCVNUG - Share Point Development
CVNUG - Share Point Developmentryanaoliveira
 
Advanced SharePoint 2010 Features
Advanced SharePoint 2010 FeaturesAdvanced SharePoint 2010 Features
Advanced SharePoint 2010 FeaturesIvor Davies
 
SSRS 2008 R2
SSRS 2008 R2SSRS 2008 R2
SSRS 2008 R2
tomerl
 
SharePoint Connections Coast to Coast Business Intelligence Solutions with Sh...
SharePoint Connections Coast to Coast Business Intelligence Solutions with Sh...SharePoint Connections Coast to Coast Business Intelligence Solutions with Sh...
SharePoint Connections Coast to Coast Business Intelligence Solutions with Sh...
Ivan Sanders
 
SharePoint Saturday Los Angeles 2011 SharePoint 2010 as The Business Intellig...
SharePoint Saturday Los Angeles 2011 SharePoint 2010 as The Business Intellig...SharePoint Saturday Los Angeles 2011 SharePoint 2010 as The Business Intellig...
SharePoint Saturday Los Angeles 2011 SharePoint 2010 as The Business Intellig...
Ivan Sanders
 
Microsoft Viva Connections - Set up and Extend with SPFx
Microsoft Viva Connections - Set up and Extend with SPFxMicrosoft Viva Connections - Set up and Extend with SPFx
Microsoft Viva Connections - Set up and Extend with SPFx
Nanddeep Nachan
 
Improving Business Agility through IBM Business Insight Advanced
Improving Business Agility through IBM Business Insight AdvancedImproving Business Agility through IBM Business Insight Advanced
Improving Business Agility through IBM Business Insight Advanced
DataClarity Corporation
 
Susan Lennon: Building SharePoint Dashboards
Susan Lennon: Building SharePoint DashboardsSusan Lennon: Building SharePoint Dashboards
Susan Lennon: Building SharePoint DashboardsSharePoint Saturday NY
 
Introduction to SharePoint 2013
Introduction to SharePoint 2013Introduction to SharePoint 2013
Introduction to SharePoint 2013
Folio3 Software
 
Companion by Minitab - Desktop App
Companion by Minitab - Desktop AppCompanion by Minitab - Desktop App
Companion by Minitab - Desktop App
GMSL S.r.l.
 
SharePoint Saturday Columbus,Ohio Tony Maddin SharePoint Diagnostic Studio 3.0
SharePoint Saturday Columbus,Ohio Tony Maddin SharePoint Diagnostic Studio 3.0SharePoint Saturday Columbus,Ohio Tony Maddin SharePoint Diagnostic Studio 3.0
SharePoint Saturday Columbus,Ohio Tony Maddin SharePoint Diagnostic Studio 3.0
Tony Maddin
 

Similar to Getting Acquainted with PerformancePoint Dashboard designer - SharePoint 2010 (20)

Create a balanced scorecard123 steps
Create a balanced scorecard123 stepsCreate a balanced scorecard123 steps
Create a balanced scorecard123 steps
 
Create a balanced scorecard
Create a balanced scorecardCreate a balanced scorecard
Create a balanced scorecard
 
Share point answer the question
Share point answer the questionShare point answer the question
Share point answer the question
 
SharePoint PerformancePoint 101
SharePoint PerformancePoint 101SharePoint PerformancePoint 101
SharePoint PerformancePoint 101
 
bi-publisher.pptx
bi-publisher.pptxbi-publisher.pptx
bi-publisher.pptx
 
Power bi slide share pdf it is a very important
Power bi slide share pdf it is a very importantPower bi slide share pdf it is a very important
Power bi slide share pdf it is a very important
 
Office Share Point Server 2007 Product Guide
Office Share Point Server 2007 Product GuideOffice Share Point Server 2007 Product Guide
Office Share Point Server 2007 Product Guide
 
Presentation on Crystal Reports and Business Objects Enterprise Features
Presentation on Crystal Reports and Business Objects Enterprise FeaturesPresentation on Crystal Reports and Business Objects Enterprise Features
Presentation on Crystal Reports and Business Objects Enterprise Features
 
LIBA++Lecture+Notes_Power+BI.docx.pdf
LIBA++Lecture+Notes_Power+BI.docx.pdfLIBA++Lecture+Notes_Power+BI.docx.pdf
LIBA++Lecture+Notes_Power+BI.docx.pdf
 
CVNUG - Share Point Development
CVNUG - Share Point DevelopmentCVNUG - Share Point Development
CVNUG - Share Point Development
 
Advanced SharePoint 2010 Features
Advanced SharePoint 2010 FeaturesAdvanced SharePoint 2010 Features
Advanced SharePoint 2010 Features
 
SSRS 2008 R2
SSRS 2008 R2SSRS 2008 R2
SSRS 2008 R2
 
SharePoint Connections Coast to Coast Business Intelligence Solutions with Sh...
SharePoint Connections Coast to Coast Business Intelligence Solutions with Sh...SharePoint Connections Coast to Coast Business Intelligence Solutions with Sh...
SharePoint Connections Coast to Coast Business Intelligence Solutions with Sh...
 
SharePoint Saturday Los Angeles 2011 SharePoint 2010 as The Business Intellig...
SharePoint Saturday Los Angeles 2011 SharePoint 2010 as The Business Intellig...SharePoint Saturday Los Angeles 2011 SharePoint 2010 as The Business Intellig...
SharePoint Saturday Los Angeles 2011 SharePoint 2010 as The Business Intellig...
 
Microsoft Viva Connections - Set up and Extend with SPFx
Microsoft Viva Connections - Set up and Extend with SPFxMicrosoft Viva Connections - Set up and Extend with SPFx
Microsoft Viva Connections - Set up and Extend with SPFx
 
Improving Business Agility through IBM Business Insight Advanced
Improving Business Agility through IBM Business Insight AdvancedImproving Business Agility through IBM Business Insight Advanced
Improving Business Agility through IBM Business Insight Advanced
 
Susan Lennon: Building SharePoint Dashboards
Susan Lennon: Building SharePoint DashboardsSusan Lennon: Building SharePoint Dashboards
Susan Lennon: Building SharePoint Dashboards
 
Introduction to SharePoint 2013
Introduction to SharePoint 2013Introduction to SharePoint 2013
Introduction to SharePoint 2013
 
Companion by Minitab - Desktop App
Companion by Minitab - Desktop AppCompanion by Minitab - Desktop App
Companion by Minitab - Desktop App
 
SharePoint Saturday Columbus,Ohio Tony Maddin SharePoint Diagnostic Studio 3.0
SharePoint Saturday Columbus,Ohio Tony Maddin SharePoint Diagnostic Studio 3.0SharePoint Saturday Columbus,Ohio Tony Maddin SharePoint Diagnostic Studio 3.0
SharePoint Saturday Columbus,Ohio Tony Maddin SharePoint Diagnostic Studio 3.0
 

More from EPC Group

Power BI vs Tableau - An Overview from EPC Group.pptx
Power BI vs Tableau - An Overview from EPC Group.pptxPower BI vs Tableau - An Overview from EPC Group.pptx
Power BI vs Tableau - An Overview from EPC Group.pptx
EPC Group
 
EPC Group Intune Practice and Capabilities Overview
EPC Group Intune Practice and Capabilities OverviewEPC Group Intune Practice and Capabilities Overview
EPC Group Intune Practice and Capabilities Overview
EPC Group
 
Pop the Hood on Microsoft Teams - EPC Group
Pop the Hood on Microsoft Teams - EPC GroupPop the Hood on Microsoft Teams - EPC Group
Pop the Hood on Microsoft Teams - EPC Group
EPC Group
 
Windows Server 2012 Deep-Dive - EPC Group
Windows Server 2012 Deep-Dive - EPC GroupWindows Server 2012 Deep-Dive - EPC Group
Windows Server 2012 Deep-Dive - EPC Group
EPC Group
 
Understanding Windows Azure’s Active Directory (AD) and PowerShell Tools
Understanding Windows Azure’s Active Directory (AD) and PowerShell ToolsUnderstanding Windows Azure’s Active Directory (AD) and PowerShell Tools
Understanding Windows Azure’s Active Directory (AD) and PowerShell Tools
EPC Group
 
PowerShell with SharePoint 2013 and Office 365 - EPC Group
PowerShell with SharePoint 2013 and Office 365 - EPC GroupPowerShell with SharePoint 2013 and Office 365 - EPC Group
PowerShell with SharePoint 2013 and Office 365 - EPC Group
EPC Group
 
Understanding Office 365’s Identity Solutions: Deep Dive - EPC Group
Understanding Office 365’s Identity Solutions: Deep Dive - EPC GroupUnderstanding Office 365’s Identity Solutions: Deep Dive - EPC Group
Understanding Office 365’s Identity Solutions: Deep Dive - EPC Group
EPC Group
 
System Center 2012 SP1 - Overview - EPC Group
System Center 2012 SP1 - Overview - EPC GroupSystem Center 2012 SP1 - Overview - EPC Group
System Center 2012 SP1 - Overview - EPC Group
EPC Group
 
Windows Azure Pack Enabling Virtual Machines - IaaS & Virtual Machine Role - ...
Windows Azure Pack Enabling Virtual Machines - IaaS & Virtual Machine Role - ...Windows Azure Pack Enabling Virtual Machines - IaaS & Virtual Machine Role - ...
Windows Azure Pack Enabling Virtual Machines - IaaS & Virtual Machine Role - ...
EPC Group
 
Lync 2013 - Audio - Quick Reference - 2 Page Reference - EPC Group
Lync 2013 - Audio - Quick Reference - 2 Page Reference - EPC GroupLync 2013 - Audio - Quick Reference - 2 Page Reference - EPC Group
Lync 2013 - Audio - Quick Reference - 2 Page Reference - EPC Group
EPC Group
 
Lync 2013 - Sharing and Collaboration - Quick Reference 2 Pager
Lync 2013 - Sharing and Collaboration - Quick Reference 2 PagerLync 2013 - Sharing and Collaboration - Quick Reference 2 Pager
Lync 2013 - Sharing and Collaboration - Quick Reference 2 Pager
EPC Group
 
Windows Server 2012 Deep-Dive - EPC Group
Windows Server 2012 Deep-Dive - EPC GroupWindows Server 2012 Deep-Dive - EPC Group
Windows Server 2012 Deep-Dive - EPC Group
EPC Group
 
Hyper-V’s Virtualization Enhancements - EPC Group
Hyper-V’s Virtualization Enhancements - EPC GroupHyper-V’s Virtualization Enhancements - EPC Group
Hyper-V’s Virtualization Enhancements - EPC Group
EPC Group
 
High Level Overview of Windows Azure - EPC Group
High Level Overview of Windows Azure - EPC GroupHigh Level Overview of Windows Azure - EPC Group
High Level Overview of Windows Azure - EPC Group
EPC Group
 
SharePoint 2013 and Office 365 External Sharing
SharePoint 2013 and Office 365 External SharingSharePoint 2013 and Office 365 External Sharing
SharePoint 2013 and Office 365 External Sharing
EPC Group
 
BizTalk Server 2010 - Invoking Restful Services - EPC Group
BizTalk Server 2010 - Invoking Restful Services - EPC GroupBizTalk Server 2010 - Invoking Restful Services - EPC Group
BizTalk Server 2010 - Invoking Restful Services - EPC Group
EPC Group
 
BizTalk Sever 2010 - Basic Principles of Maps - EPC Group
BizTalk Sever 2010 - Basic Principles of Maps - EPC GroupBizTalk Sever 2010 - Basic Principles of Maps - EPC Group
BizTalk Sever 2010 - Basic Principles of Maps - EPC Group
EPC Group
 
EPC Group and Continental Airlines ECM Case Study - SharePoint 2007 Global Study
EPC Group and Continental Airlines ECM Case Study - SharePoint 2007 Global StudyEPC Group and Continental Airlines ECM Case Study - SharePoint 2007 Global Study
EPC Group and Continental Airlines ECM Case Study - SharePoint 2007 Global Study
EPC Group
 
Driving End User Adoption in SharePoint 2013 & 2010 - EPC Group
Driving End User Adoption in SharePoint 2013 & 2010 - EPC GroupDriving End User Adoption in SharePoint 2013 & 2010 - EPC Group
Driving End User Adoption in SharePoint 2013 & 2010 - EPC Group
EPC Group
 
Join EPC Group's Monthly Newsletter
Join EPC Group's Monthly NewsletterJoin EPC Group's Monthly Newsletter
Join EPC Group's Monthly Newsletter
EPC Group
 

More from EPC Group (20)

Power BI vs Tableau - An Overview from EPC Group.pptx
Power BI vs Tableau - An Overview from EPC Group.pptxPower BI vs Tableau - An Overview from EPC Group.pptx
Power BI vs Tableau - An Overview from EPC Group.pptx
 
EPC Group Intune Practice and Capabilities Overview
EPC Group Intune Practice and Capabilities OverviewEPC Group Intune Practice and Capabilities Overview
EPC Group Intune Practice and Capabilities Overview
 
Pop the Hood on Microsoft Teams - EPC Group
Pop the Hood on Microsoft Teams - EPC GroupPop the Hood on Microsoft Teams - EPC Group
Pop the Hood on Microsoft Teams - EPC Group
 
Windows Server 2012 Deep-Dive - EPC Group
Windows Server 2012 Deep-Dive - EPC GroupWindows Server 2012 Deep-Dive - EPC Group
Windows Server 2012 Deep-Dive - EPC Group
 
Understanding Windows Azure’s Active Directory (AD) and PowerShell Tools
Understanding Windows Azure’s Active Directory (AD) and PowerShell ToolsUnderstanding Windows Azure’s Active Directory (AD) and PowerShell Tools
Understanding Windows Azure’s Active Directory (AD) and PowerShell Tools
 
PowerShell with SharePoint 2013 and Office 365 - EPC Group
PowerShell with SharePoint 2013 and Office 365 - EPC GroupPowerShell with SharePoint 2013 and Office 365 - EPC Group
PowerShell with SharePoint 2013 and Office 365 - EPC Group
 
Understanding Office 365’s Identity Solutions: Deep Dive - EPC Group
Understanding Office 365’s Identity Solutions: Deep Dive - EPC GroupUnderstanding Office 365’s Identity Solutions: Deep Dive - EPC Group
Understanding Office 365’s Identity Solutions: Deep Dive - EPC Group
 
System Center 2012 SP1 - Overview - EPC Group
System Center 2012 SP1 - Overview - EPC GroupSystem Center 2012 SP1 - Overview - EPC Group
System Center 2012 SP1 - Overview - EPC Group
 
Windows Azure Pack Enabling Virtual Machines - IaaS & Virtual Machine Role - ...
Windows Azure Pack Enabling Virtual Machines - IaaS & Virtual Machine Role - ...Windows Azure Pack Enabling Virtual Machines - IaaS & Virtual Machine Role - ...
Windows Azure Pack Enabling Virtual Machines - IaaS & Virtual Machine Role - ...
 
Lync 2013 - Audio - Quick Reference - 2 Page Reference - EPC Group
Lync 2013 - Audio - Quick Reference - 2 Page Reference - EPC GroupLync 2013 - Audio - Quick Reference - 2 Page Reference - EPC Group
Lync 2013 - Audio - Quick Reference - 2 Page Reference - EPC Group
 
Lync 2013 - Sharing and Collaboration - Quick Reference 2 Pager
Lync 2013 - Sharing and Collaboration - Quick Reference 2 PagerLync 2013 - Sharing and Collaboration - Quick Reference 2 Pager
Lync 2013 - Sharing and Collaboration - Quick Reference 2 Pager
 
Windows Server 2012 Deep-Dive - EPC Group
Windows Server 2012 Deep-Dive - EPC GroupWindows Server 2012 Deep-Dive - EPC Group
Windows Server 2012 Deep-Dive - EPC Group
 
Hyper-V’s Virtualization Enhancements - EPC Group
Hyper-V’s Virtualization Enhancements - EPC GroupHyper-V’s Virtualization Enhancements - EPC Group
Hyper-V’s Virtualization Enhancements - EPC Group
 
High Level Overview of Windows Azure - EPC Group
High Level Overview of Windows Azure - EPC GroupHigh Level Overview of Windows Azure - EPC Group
High Level Overview of Windows Azure - EPC Group
 
SharePoint 2013 and Office 365 External Sharing
SharePoint 2013 and Office 365 External SharingSharePoint 2013 and Office 365 External Sharing
SharePoint 2013 and Office 365 External Sharing
 
BizTalk Server 2010 - Invoking Restful Services - EPC Group
BizTalk Server 2010 - Invoking Restful Services - EPC GroupBizTalk Server 2010 - Invoking Restful Services - EPC Group
BizTalk Server 2010 - Invoking Restful Services - EPC Group
 
BizTalk Sever 2010 - Basic Principles of Maps - EPC Group
BizTalk Sever 2010 - Basic Principles of Maps - EPC GroupBizTalk Sever 2010 - Basic Principles of Maps - EPC Group
BizTalk Sever 2010 - Basic Principles of Maps - EPC Group
 
EPC Group and Continental Airlines ECM Case Study - SharePoint 2007 Global Study
EPC Group and Continental Airlines ECM Case Study - SharePoint 2007 Global StudyEPC Group and Continental Airlines ECM Case Study - SharePoint 2007 Global Study
EPC Group and Continental Airlines ECM Case Study - SharePoint 2007 Global Study
 
Driving End User Adoption in SharePoint 2013 & 2010 - EPC Group
Driving End User Adoption in SharePoint 2013 & 2010 - EPC GroupDriving End User Adoption in SharePoint 2013 & 2010 - EPC Group
Driving End User Adoption in SharePoint 2013 & 2010 - EPC Group
 
Join EPC Group's Monthly Newsletter
Join EPC Group's Monthly NewsletterJoin EPC Group's Monthly Newsletter
Join EPC Group's Monthly Newsletter
 

Recently uploaded

20240607 QFM018 Elixir Reading List May 2024
20240607 QFM018 Elixir Reading List May 202420240607 QFM018 Elixir Reading List May 2024
20240607 QFM018 Elixir Reading List May 2024
Matthew Sinclair
 
Removing Uninteresting Bytes in Software Fuzzing
Removing Uninteresting Bytes in Software FuzzingRemoving Uninteresting Bytes in Software Fuzzing
Removing Uninteresting Bytes in Software Fuzzing
Aftab Hussain
 
GraphRAG is All You need? LLM & Knowledge Graph
GraphRAG is All You need? LLM & Knowledge GraphGraphRAG is All You need? LLM & Knowledge Graph
GraphRAG is All You need? LLM & Knowledge Graph
Guy Korland
 
SAP Sapphire 2024 - ASUG301 building better apps with SAP Fiori.pdf
SAP Sapphire 2024 - ASUG301 building better apps with SAP Fiori.pdfSAP Sapphire 2024 - ASUG301 building better apps with SAP Fiori.pdf
SAP Sapphire 2024 - ASUG301 building better apps with SAP Fiori.pdf
Peter Spielvogel
 
GridMate - End to end testing is a critical piece to ensure quality and avoid...
GridMate - End to end testing is a critical piece to ensure quality and avoid...GridMate - End to end testing is a critical piece to ensure quality and avoid...
GridMate - End to end testing is a critical piece to ensure quality and avoid...
ThomasParaiso2
 
FIDO Alliance Osaka Seminar: Passkeys at Amazon.pdf
FIDO Alliance Osaka Seminar: Passkeys at Amazon.pdfFIDO Alliance Osaka Seminar: Passkeys at Amazon.pdf
FIDO Alliance Osaka Seminar: Passkeys at Amazon.pdf
FIDO Alliance
 
Smart TV Buyer Insights Survey 2024 by 91mobiles.pdf
Smart TV Buyer Insights Survey 2024 by 91mobiles.pdfSmart TV Buyer Insights Survey 2024 by 91mobiles.pdf
Smart TV Buyer Insights Survey 2024 by 91mobiles.pdf
91mobiles
 
UiPath Test Automation using UiPath Test Suite series, part 4
UiPath Test Automation using UiPath Test Suite series, part 4UiPath Test Automation using UiPath Test Suite series, part 4
UiPath Test Automation using UiPath Test Suite series, part 4
DianaGray10
 
By Design, not by Accident - Agile Venture Bolzano 2024
By Design, not by Accident - Agile Venture Bolzano 2024By Design, not by Accident - Agile Venture Bolzano 2024
By Design, not by Accident - Agile Venture Bolzano 2024
Pierluigi Pugliese
 
Observability Concepts EVERY Developer Should Know -- DeveloperWeek Europe.pdf
Observability Concepts EVERY Developer Should Know -- DeveloperWeek Europe.pdfObservability Concepts EVERY Developer Should Know -- DeveloperWeek Europe.pdf
Observability Concepts EVERY Developer Should Know -- DeveloperWeek Europe.pdf
Paige Cruz
 
Elevating Tactical DDD Patterns Through Object Calisthenics
Elevating Tactical DDD Patterns Through Object CalisthenicsElevating Tactical DDD Patterns Through Object Calisthenics
Elevating Tactical DDD Patterns Through Object Calisthenics
Dorra BARTAGUIZ
 
GraphSummit Singapore | Enhancing Changi Airport Group's Passenger Experience...
GraphSummit Singapore | Enhancing Changi Airport Group's Passenger Experience...GraphSummit Singapore | Enhancing Changi Airport Group's Passenger Experience...
GraphSummit Singapore | Enhancing Changi Airport Group's Passenger Experience...
Neo4j
 
Why You Should Replace Windows 11 with Nitrux Linux 3.5.0 for enhanced perfor...
Why You Should Replace Windows 11 with Nitrux Linux 3.5.0 for enhanced perfor...Why You Should Replace Windows 11 with Nitrux Linux 3.5.0 for enhanced perfor...
Why You Should Replace Windows 11 with Nitrux Linux 3.5.0 for enhanced perfor...
SOFTTECHHUB
 
FIDO Alliance Osaka Seminar: Overview.pdf
FIDO Alliance Osaka Seminar: Overview.pdfFIDO Alliance Osaka Seminar: Overview.pdf
FIDO Alliance Osaka Seminar: Overview.pdf
FIDO Alliance
 
Generative AI Deep Dive: Advancing from Proof of Concept to Production
Generative AI Deep Dive: Advancing from Proof of Concept to ProductionGenerative AI Deep Dive: Advancing from Proof of Concept to Production
Generative AI Deep Dive: Advancing from Proof of Concept to Production
Aggregage
 
Monitoring Java Application Security with JDK Tools and JFR Events
Monitoring Java Application Security with JDK Tools and JFR EventsMonitoring Java Application Security with JDK Tools and JFR Events
Monitoring Java Application Security with JDK Tools and JFR Events
Ana-Maria Mihalceanu
 
GraphSummit Singapore | Graphing Success: Revolutionising Organisational Stru...
GraphSummit Singapore | Graphing Success: Revolutionising Organisational Stru...GraphSummit Singapore | Graphing Success: Revolutionising Organisational Stru...
GraphSummit Singapore | Graphing Success: Revolutionising Organisational Stru...
Neo4j
 
Pushing the limits of ePRTC: 100ns holdover for 100 days
Pushing the limits of ePRTC: 100ns holdover for 100 daysPushing the limits of ePRTC: 100ns holdover for 100 days
Pushing the limits of ePRTC: 100ns holdover for 100 days
Adtran
 
Elizabeth Buie - Older adults: Are we really designing for our future selves?
Elizabeth Buie - Older adults: Are we really designing for our future selves?Elizabeth Buie - Older adults: Are we really designing for our future selves?
Elizabeth Buie - Older adults: Are we really designing for our future selves?
Nexer Digital
 
Essentials of Automations: The Art of Triggers and Actions in FME
Essentials of Automations: The Art of Triggers and Actions in FMEEssentials of Automations: The Art of Triggers and Actions in FME
Essentials of Automations: The Art of Triggers and Actions in FME
Safe Software
 

Recently uploaded (20)

20240607 QFM018 Elixir Reading List May 2024
20240607 QFM018 Elixir Reading List May 202420240607 QFM018 Elixir Reading List May 2024
20240607 QFM018 Elixir Reading List May 2024
 
Removing Uninteresting Bytes in Software Fuzzing
Removing Uninteresting Bytes in Software FuzzingRemoving Uninteresting Bytes in Software Fuzzing
Removing Uninteresting Bytes in Software Fuzzing
 
GraphRAG is All You need? LLM & Knowledge Graph
GraphRAG is All You need? LLM & Knowledge GraphGraphRAG is All You need? LLM & Knowledge Graph
GraphRAG is All You need? LLM & Knowledge Graph
 
SAP Sapphire 2024 - ASUG301 building better apps with SAP Fiori.pdf
SAP Sapphire 2024 - ASUG301 building better apps with SAP Fiori.pdfSAP Sapphire 2024 - ASUG301 building better apps with SAP Fiori.pdf
SAP Sapphire 2024 - ASUG301 building better apps with SAP Fiori.pdf
 
GridMate - End to end testing is a critical piece to ensure quality and avoid...
GridMate - End to end testing is a critical piece to ensure quality and avoid...GridMate - End to end testing is a critical piece to ensure quality and avoid...
GridMate - End to end testing is a critical piece to ensure quality and avoid...
 
FIDO Alliance Osaka Seminar: Passkeys at Amazon.pdf
FIDO Alliance Osaka Seminar: Passkeys at Amazon.pdfFIDO Alliance Osaka Seminar: Passkeys at Amazon.pdf
FIDO Alliance Osaka Seminar: Passkeys at Amazon.pdf
 
Smart TV Buyer Insights Survey 2024 by 91mobiles.pdf
Smart TV Buyer Insights Survey 2024 by 91mobiles.pdfSmart TV Buyer Insights Survey 2024 by 91mobiles.pdf
Smart TV Buyer Insights Survey 2024 by 91mobiles.pdf
 
UiPath Test Automation using UiPath Test Suite series, part 4
UiPath Test Automation using UiPath Test Suite series, part 4UiPath Test Automation using UiPath Test Suite series, part 4
UiPath Test Automation using UiPath Test Suite series, part 4
 
By Design, not by Accident - Agile Venture Bolzano 2024
By Design, not by Accident - Agile Venture Bolzano 2024By Design, not by Accident - Agile Venture Bolzano 2024
By Design, not by Accident - Agile Venture Bolzano 2024
 
Observability Concepts EVERY Developer Should Know -- DeveloperWeek Europe.pdf
Observability Concepts EVERY Developer Should Know -- DeveloperWeek Europe.pdfObservability Concepts EVERY Developer Should Know -- DeveloperWeek Europe.pdf
Observability Concepts EVERY Developer Should Know -- DeveloperWeek Europe.pdf
 
Elevating Tactical DDD Patterns Through Object Calisthenics
Elevating Tactical DDD Patterns Through Object CalisthenicsElevating Tactical DDD Patterns Through Object Calisthenics
Elevating Tactical DDD Patterns Through Object Calisthenics
 
GraphSummit Singapore | Enhancing Changi Airport Group's Passenger Experience...
GraphSummit Singapore | Enhancing Changi Airport Group's Passenger Experience...GraphSummit Singapore | Enhancing Changi Airport Group's Passenger Experience...
GraphSummit Singapore | Enhancing Changi Airport Group's Passenger Experience...
 
Why You Should Replace Windows 11 with Nitrux Linux 3.5.0 for enhanced perfor...
Why You Should Replace Windows 11 with Nitrux Linux 3.5.0 for enhanced perfor...Why You Should Replace Windows 11 with Nitrux Linux 3.5.0 for enhanced perfor...
Why You Should Replace Windows 11 with Nitrux Linux 3.5.0 for enhanced perfor...
 
FIDO Alliance Osaka Seminar: Overview.pdf
FIDO Alliance Osaka Seminar: Overview.pdfFIDO Alliance Osaka Seminar: Overview.pdf
FIDO Alliance Osaka Seminar: Overview.pdf
 
Generative AI Deep Dive: Advancing from Proof of Concept to Production
Generative AI Deep Dive: Advancing from Proof of Concept to ProductionGenerative AI Deep Dive: Advancing from Proof of Concept to Production
Generative AI Deep Dive: Advancing from Proof of Concept to Production
 
Monitoring Java Application Security with JDK Tools and JFR Events
Monitoring Java Application Security with JDK Tools and JFR EventsMonitoring Java Application Security with JDK Tools and JFR Events
Monitoring Java Application Security with JDK Tools and JFR Events
 
GraphSummit Singapore | Graphing Success: Revolutionising Organisational Stru...
GraphSummit Singapore | Graphing Success: Revolutionising Organisational Stru...GraphSummit Singapore | Graphing Success: Revolutionising Organisational Stru...
GraphSummit Singapore | Graphing Success: Revolutionising Organisational Stru...
 
Pushing the limits of ePRTC: 100ns holdover for 100 days
Pushing the limits of ePRTC: 100ns holdover for 100 daysPushing the limits of ePRTC: 100ns holdover for 100 days
Pushing the limits of ePRTC: 100ns holdover for 100 days
 
Elizabeth Buie - Older adults: Are we really designing for our future selves?
Elizabeth Buie - Older adults: Are we really designing for our future selves?Elizabeth Buie - Older adults: Are we really designing for our future selves?
Elizabeth Buie - Older adults: Are we really designing for our future selves?
 
Essentials of Automations: The Art of Triggers and Actions in FME
Essentials of Automations: The Art of Triggers and Actions in FMEEssentials of Automations: The Art of Triggers and Actions in FME
Essentials of Automations: The Art of Triggers and Actions in FME
 

Getting Acquainted with PerformancePoint Dashboard designer - SharePoint 2010

  • 1. Getting acquainted with PerformancePoint Dashboard Designer Applies to: PerformancePoint Dashboard Designer, SharePoint Server 2010 You use PerformancePoint Dashboard Designer to create, edit, and publish dashboards to Microsoft SharePoint Server 2010. This article contains information to help you become familiar with Dashboard Designer and how you use it. How do I install or open Dashboard Designer? If PerformancePoint Services in Microsoft SharePoint Server 2010 is configured for your organization and you have the necessary permissions, you can install or launch Dashboard Designer. IMPORTANT If you are using Mozilla Firefox as your Web browser, make sure that Microsoft .NET Framework Assistant 1.1 is installed on your computer before you attempt to install Dashboard Designer. 1. Using your Web browser, browse to the Business Intelligence Center. (Ask your SharePoint administrator for the Web site address if you do not have it.) The Business Intelligence Center is a SharePoint site that serves as a portal to PerformancePoint Services and other applications. The Business Intelligence Center might resemble the following image: In the Business Intelligence Center, you will find information about SharePoint business intelligence, including Excel Services, status indicators, and PerformancePoint Services. You will also find links that you can use to open Help or locate applications, such as Dashboard Designer. TIP If you cannot find the Business Intelligence Center, contact your SharePoint administrator. 2. In the Business Intelligence Center, click a section, such as Monitor Key Performance, Build and Share Reports, or Create Dashboards. Additional information about each area is displayed in the center pane: Click a link that says, “Start using PerformancePoint Services.”
  • 2. 3. The PerformancePoint site template opens. Click Run Dashboard Designer. 4. If you have the necessary permissions assigned to you in SharePoint Server, Dashboard Designer will install and open. After you have opened Dashboard Designer at least once, you can open it by using additional methods, such as the following: ©2009 Microsoft Corporation.
  • 3. Set up a shortcut on your desktop to the SharePoint site that contains your dashboard items. Then, double-click the desktop shortcut to open Dashboard Designer. Click Start, and then click All Programs. Locate SharePoint, and then clickPerformancePoint Dashboard Designer. NOTE If you are upgrading from Microsoft Office PerformancePoint Server 2007 to PerformancePoint Services in Microsoft SharePoint Server 2010, the previous version of Dashboard Designer will not work. Make sure that you remove the previous version of Dashboard Designer from the Start menu. To do this, click Start, and then click All Programs. Locate Microsoft Office PerformancePoint Server 2007. Right- click Dashboard Designer, and then click Delete. What kinds of dashboard items can I create by using Dashboard Designer? You can use Dashboard Designer to create a wide range of PerformancePoint items, such as data sources, dashboards, scorecards, key performance indicators (KPIs), indicators, filters, and reports. The following table summarizes these items: ITEMS DESCRIPTION Data Data sources are your connections to the databases that you use for the scorecards, Sources reports, and filters that you create by using Dashboard Designer. Dashboards Dashboards are the containers that you use to display your scorecards and reports. When you assemble dashboards, you add reports, scorecards, and filters to zones, which are sections in a dashboard page. A single dashboard can contain more than one page. You can design each page by using the same page layout template, or you can use different templates. You can also customize the sizes of the dashboard zones, and each zone can contain one or more items, such as reports, scorecards, and filters. Scorecards Scorecards are dashboard items that show performance for one or more metrics. They compare actual results to specified goals and express the results by using graphical indicators. A scorecard resembles a table that usually has Target and Actual value columns and several KPIs. KPIs KPIs are metrics that you use in a scorecard. KPIs typically include target and actual values, and graphical indicators that show whether performance is on or off target. Indicators Indicators are graphical symbols that are used in KPIs to show whether performance is on or off target. Commonly used indicators are stoplight symbols, which use green circles to indicate that performance is on target, yellow triangles to indicate that performance is not far off target, and red diamonds to indicate poor performance. ©2009 Microsoft Corporation.
  • 4. Filters Filters are individual dashboard items that enable dashboard users to focus on specific information. For example, you might create a Geography filter and then connect that filter to a report or a scorecard. This enables a user to view information for a specific geographical region. Reports Reports are dashboard items that display information in charts or tables. You can create a wide variety of reports by using Dashboard Designer. Examples include bar charts, line charts, pie charts, and tables, which are known as grids. In addition, you can create some reports directly in Dashboard Designer, and you can create Web Parts to display existing reports that are hosted on other servers. WHERE ARE MY DASHBOARD ITEMS STORED? All your PerformancePoint dashboard items are saved in designated SharePoint lists and document libraries that are set up when PerformancePoint Services is configured. The following image shows a list of SharePoint lists and document libraries that you will typically see in PerformancePoint Services: The following table describes these SharePoint lists and libraries, where your dashboard content and other files are stored. ITEMS DESCRIPTION Data Connections The data sources that you use for your KPIs, scorecards, reports, and filters are saved in a Data Connections document library that contains data sources together with additional information, such as server and security settings. This document library is typically called Data Connections, but SharePoint administrators can change its name when they configure PerformancePoint Services. Individual Scorecards, reports, filters, dashboard pages, and other dashboard items are saved ©2009 Microsoft Corporation.
  • 5. dashboard in a PerformancePoint Content list. elements, NOTE All dashboard pages are stored in the PerformancePoint Content list. including: However, live dashboards that have been deployed to a SharePoint site are also stored in a different document library, which is called Dashboards. Indicators This list is typically called PerformancePoint Content, but SharePoint KPIs administrators can change its name when they configure PerformancePoint Scorecards Services. Reports Filters Dashboard pages Dashboards After you deploy a dashboard, it is saved in a Dashboards document library that contains only dashboards. Individual dashboard items are not stored here. This list is typically called Dashboards, but SharePoint administrators can change its name when they configure PerformancePoint Services. Files and other Other kinds of files, documents, and so forth are saved in a Documents document miscellaneous library. The items that are saved here are not typically items that you use in your documents dashboards, but can include additional information that users might find helpful. In addition, dashboard users can export some kinds of dashboard items to Microsoft PowerPoint or Microsoft Excel, and then store those files in the Documents library. Because dashboard items are saved directly to SharePoint Server, you and other dashboard authors can save time and effort by reusing items. For example, you can create an analytic chart and then use that report in multiple dashboards. You can also copy and paste dashboard items, and then make changes to the copied items. In addition, you can control who can view or use your dashboard content by assigning SharePoint permissions to individual dashboard elements. NOTE In order to view and assign SharePoint permissions, you must have Full Control or Site Administrator permissions. If you do not have the necessary permissions, you will not be able to view or edit permissions for any dashboard items, including the items that you create. Contact your SharePoint administrator for more information. How do I navigate Dashboard Designer? The Dashboard Designer user interface includes a ribbon, a Workspace Browser pane, a center pane, and a Details pane that you use to create, view, and edit dashboard items. ©2009 Microsoft Corporation.
  • 6. The workspace also includes the Microsoft Office button menu that you can use to save your workspace files, deploy a dashboard, and change your server connection. THE RIBBON The ribbon includes the Microsoft Office Backstage button and three tabs: the Home tab, the Edit tab, and the Create tab. The Microsoft Office Backstage button Click the Microsoft Office button to access Dashboard Designer settings and other Save options. There, you can also view workspace files that you recently created or saved. Click Designer Options to open the Options dialog box. The Options dialog box includes three tabs: Personalize, Server, and Resources. ©2009 Microsoft Corporation.
  • 7. Use the Personalize tab to specify the default location for your workspace files and whether to use wizards to create your scorecards. Use the Server tab to view or change the server that you connect to when you use Dashboard Designer. Use the Resources tab to find out which version of Dashboard Designer you are using. The Home tab in the ribbon The Home tab includes toolbar commands that you can use to view and open dashboard items. For example, in the Workspace section of the Home tab, you click Refresh to refresh the list of dashboard items that have been published to SharePoint Server. The Edit tab in the ribbon The Edit tab includes toolbar commands that you can use to change dashboard items that you or other dashboard authors have created. The Edit tab is dynamic. It displays only the toolbar commands that are specific to the particular dashboard items that you want to edit. That is, the Edit tab changes according to the type of dashboard item that is open in the center pane of the workspace. For example, if you open a KPI, the Edit tab displays toolbar commands that enable you to change number formats, such as changing the number of decimal places that are displayed in numeric values. If you open a scorecard, the Edit tab displays various toolbar commands that you can use. They include Update. Use the Update command to refresh the information that is displayed after you have made changes to your scorecard. If you open an analytic grid for editing, the Edit tab displays various toolbar commands that enable you to change the font, number, report view, and other settings. And, if you open a dashboard for editing, the Edit tab displays toolbar commands that are specific to working with dashboard zones or items within zones. ©2009 Microsoft Corporation.
  • 8. For some dashboard items, such as filters, the Edit tab has no toolbar commands. For those items, use the Editor and Properties tabs in the center pane of the workspace to make your changes. The Create tab in the ribbon The Create tab includes toolbar commands that you use to create your dashboard items. Each toolbar command opens a wizard that guides you as you create an item. For example, when you click Dashboard, the Select a Dashboard Page Template dialog box opens. You select a page layout template for the first page of your dashboard, and then you start to assemble your dashboard. THE WORKSPACE BROWSER PANE The Workspace Browser pane is located on the left side of the screen in Dashboard Designer. You use the Workspace Browser pane to view, open, and save dashboard items. You also use the Workspace Browser to deploy your dashboards. The Workspace Browser contains two categories of dashboard items: PerformancePoint Content, and Data Connections. Select PerformancePoint Content to create, view, or open indicators, KPIs, scorecards, reports, filters, and dashboards Select Data Connections to create, view, or open data sources. The Workspace Browser uses right-click functionality to perform many tasks. For example, when you create an item and you want to save it, in the Workspace Browser, right-click the item, and then click Save. Similarly, to deploy a dashboard, in the Workspace Browser, right-click the dashboard, and then click Deploy to SharePoint. THE CENTER PANE OF THE WORKSPACE You use the center pane to view, create, and change dashboard items. The center pane changes, depending on where the focus is in the Workspace Browser. For example, when you click PerformancePoint Content or Data Connections in the Workspace Browser, you see the SharePoint and Workspace tabs in the center pane. And, when you click a specific item in the Workspace Browser, you see two, three, or four tabs in the center pane. Those tabs vary according to the type of dashboard item that you are working on. The SharePoint and Workspace tabs The SharePoint and Workspace tabs are available when an item is selected in the Workspace Browser. You use these tabs to view lists of dashboard items that you and other dashboard authors have created. ©2009 Microsoft Corporation.
  • 9. TAB DESCRIPTION The The SharePoint tab displays a list of the dashboard items that you and other dashboard SharePoint authors have saved to SharePoint Server. Depending on whether PerformancePoint tab Content or Data Connections is selected in the Workspace Browser, you can either see all the data sources or all the other kinds of dashboard items that are available displayed in the center pane. The The Workspace tab displays a collection of dashboard items that are saved to SharePoint Workspace Server. In particular, the Workspace tab displays dashboard items that you have created tab or opened for editing. When you first open Dashboard Designer, you are working in an untitled, unsaved workspace file. As you create and open dashboard items, those items become visible on both the SharePoint tab and the Workspace tab in the center pane. When you save your workspace file, you create a list of dashboard items that you can then view on the Workspace tab. You can change which items are included in your workspace file by using the toolbar commands that are available in the Workspace section of the Home tab in the ribbon. IMPORTANT Dashboard items are always saved directly to SharePoint Server, and not to your computer. However, when you save your workspace file (this is optional), the workspace file is saved to your computer. The Editor, Properties, Design, Query, Time, and View tabs NOTE You use the Editor, Properties, Design, Query, Time, and View tabs to configure or change individual dashboard items. These tabs are available when an item is selected in the Workspace Browser, or when you are creating a dashboard item. Not all the tabs listed below are available at the same time for a particular dashboard item. Only the tabs that apply to that item are visible in the center pane. THE PROPERTIES TAB The Properties tab is available for all types of dashboard items. You use theProperties tab to specify an item's name, description, owner (referred to as Person Responsible), and the display folder for that item in its SharePoint list or document library. NOTE In Dashboard Designer, you can create and use display folders for your dashboard items. In the SharePoint lists and document libraries that contain your dashboard items, those display folders are listed in a Display Folder column. You use that Display Folder column to filter and group your dashboard items together. ©2009 Microsoft Corporation.
  • 10. THE EDITOR TAB The Editor tab is available for most types of dashboard items. They include the following: Dashboards Scorecards KPIs Filters Indicators Reports (except analytic charts and grids, which have the Design tab) You use the Editor tab to add or change the data that you use in your dashboard items. In addition, you can use the Editor tab to preview some types of dashboard items, such as scorecards and reports. THE DESIGN TAB The Design tab is available for analytic charts and grids. You use the Design tab to add or change the Analysis Services data that you use in your analytic chart or grid. You can also use the Design tab to preview your report. THE QUERY TAB The Query tab is available for analytic charts and grids. You use the Query tab to view, write, or change the Multidimensional Expressions (MDX) query that is used to display information in your analytic report. IMPORTANT When you create your analytic chart or grid by using a custom query, your report will not be interactive. That is, your dashboard users will be unable to explore data by drilling up or down to see higher or lower levels of detail in your report. THE TIME TAB The Time tab is available for your data sources. You use the Time tab to configure a data source to work with Time Intelligence by specifying time period levels, such as years, months, or days. THE VIEW TAB The View tab is available for some types of data sources, such as tabular data sources. You use the View tab to preview your data or to specify column definitions. THE DETAILS PANE The Details pane is located on the left side in Dashboard Designer. The Details pane is only visible when you are creating, viewing, or modifying a specific dashboard item. That is, the Details pane is only visible when a specific dashboard item is selected in the Workspace Browser. You use the Details pane to add or change the content that you display in a dashboard item. The items that are available in the Details pane vary according to the dashboard item that you are working on. ©2009 Microsoft Corporation.
  • 11. For example, when you have an analytic chart or grid open, the Details pane lists items, such as dimensions, measures, and named sets. These items are available in the SQL Server Analysis Services cube that is used by that report. When you have a scorecard open, the Details pane lists KPIs, metrics, aggregations, dimensions, and other items that are relevant to that scorecard. ©2009 Microsoft Corporation.