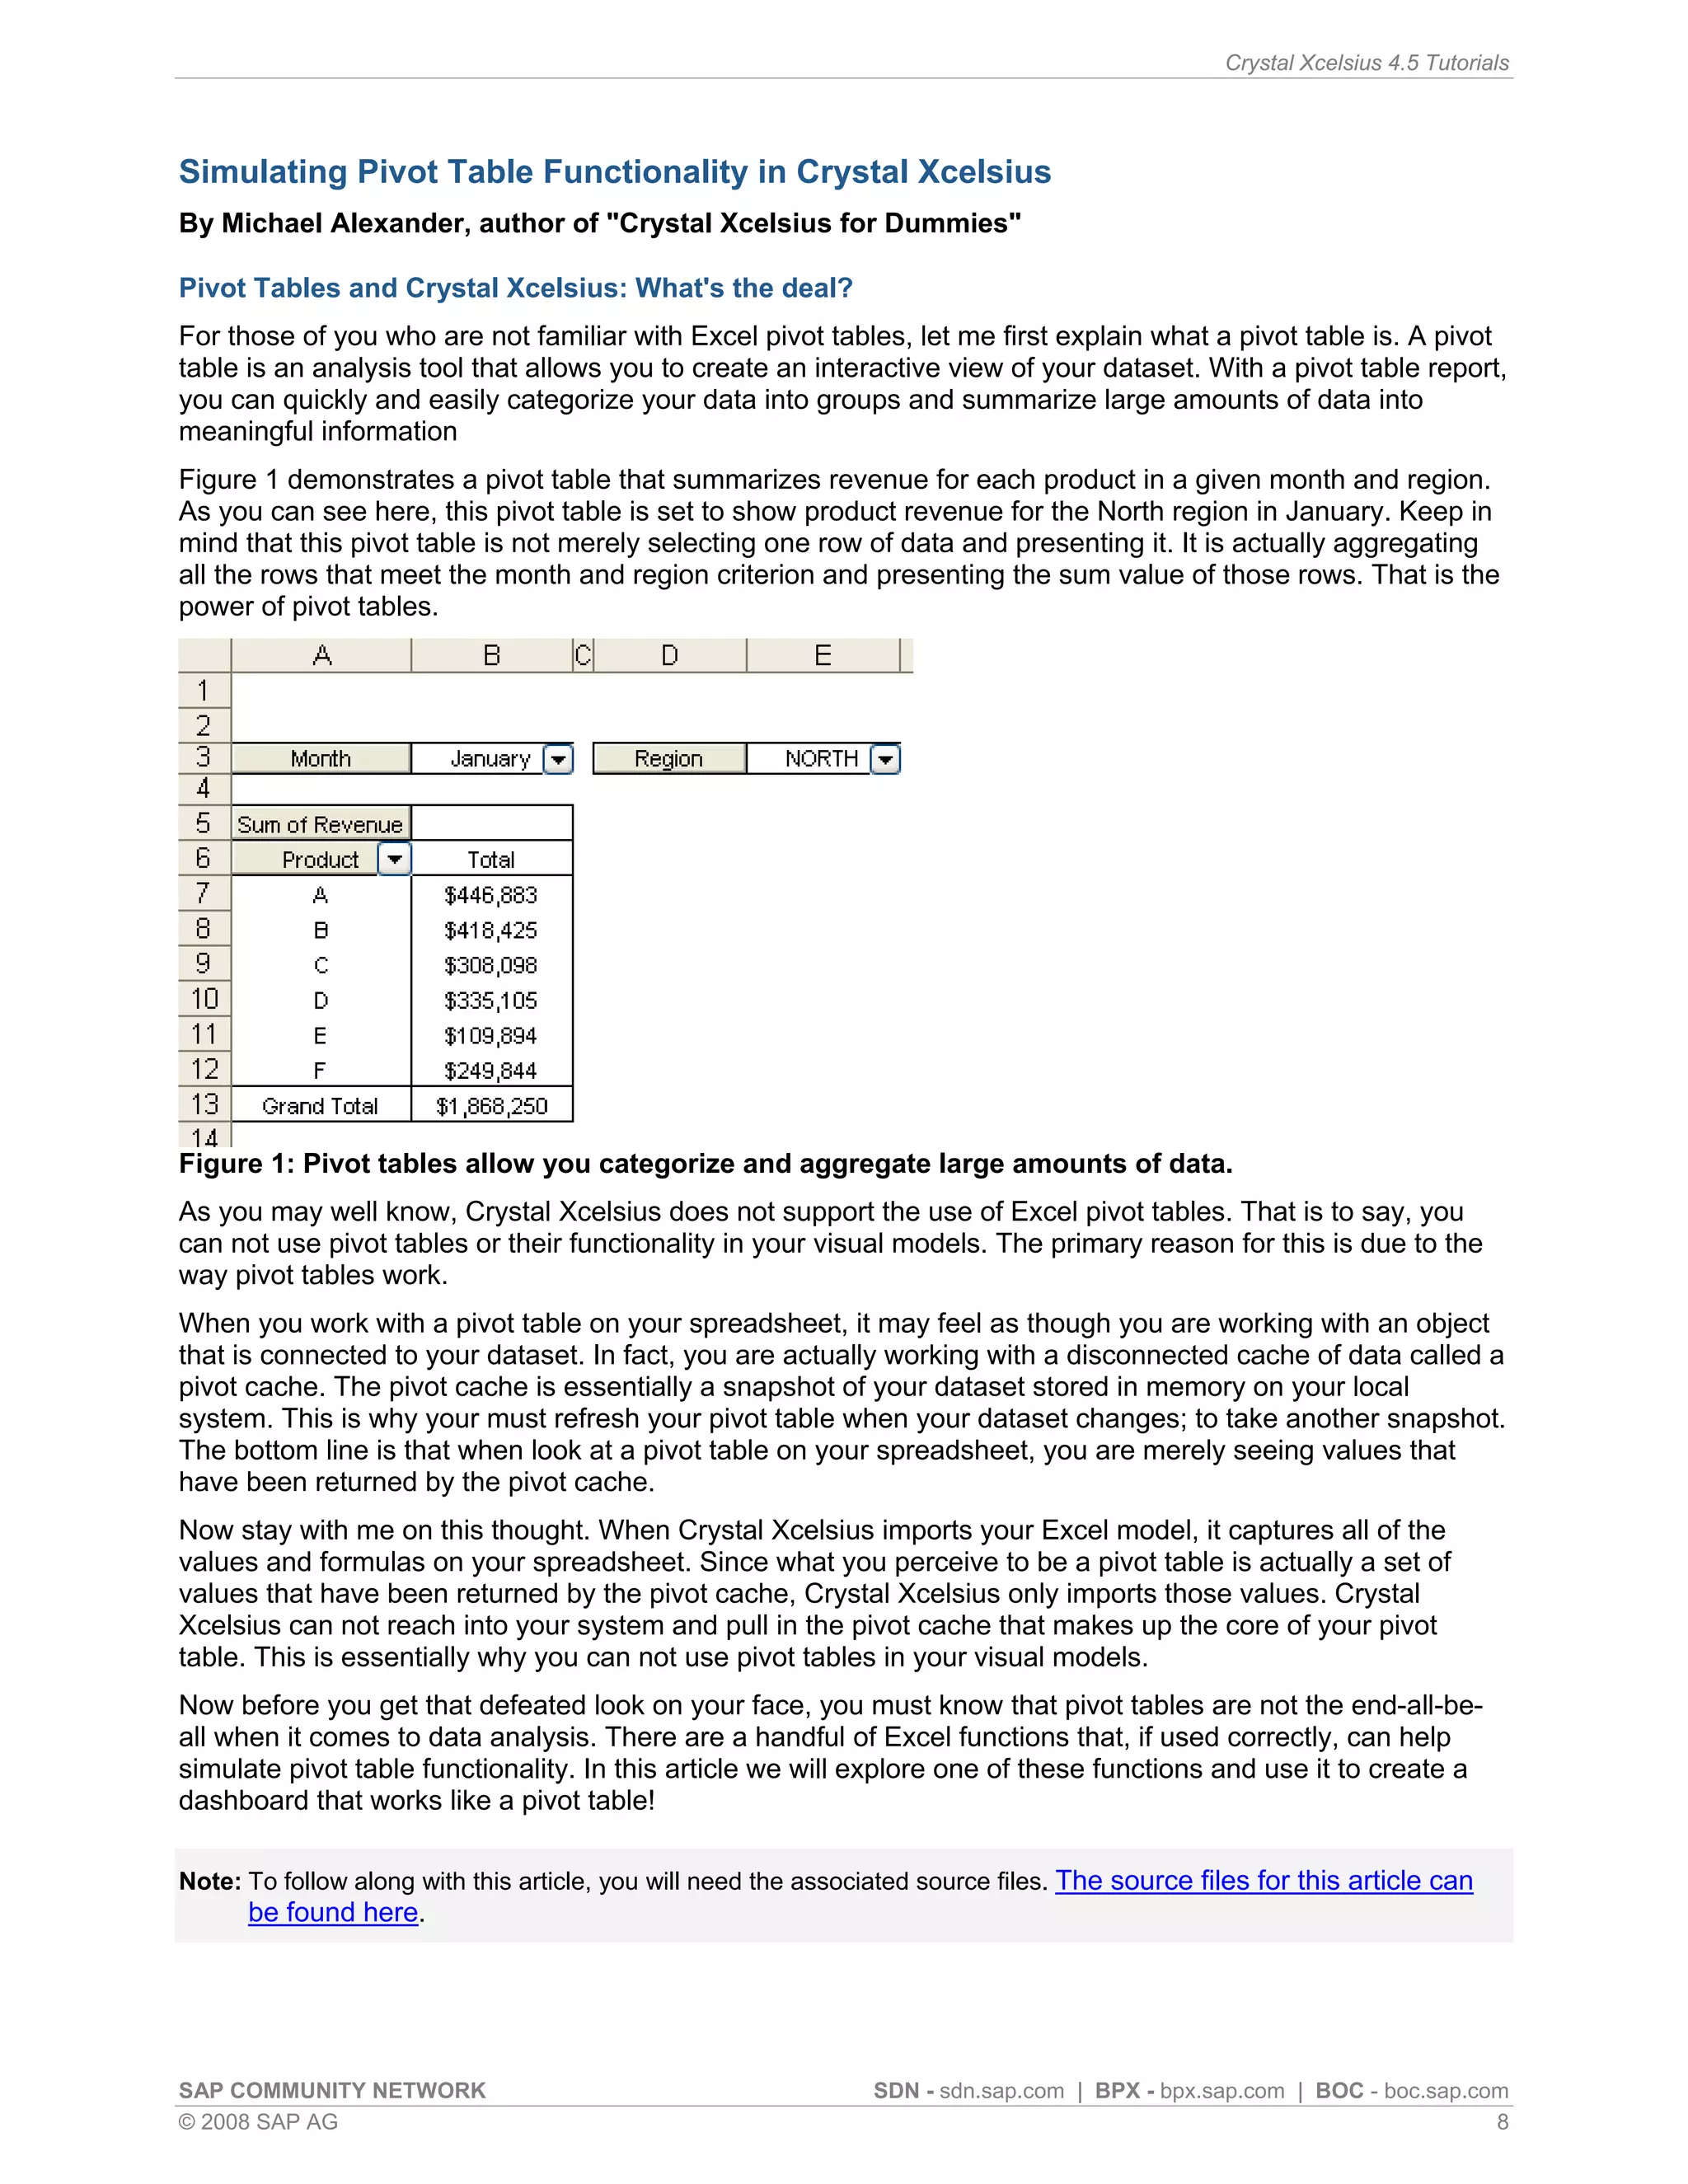
This article discusses simulating pivot table functionality in Crystal Xcelsius. Pivot tables allow categorizing and aggregating large amounts of data, but are not supported in Xcelsius models. The article explores using the SUMIF function to simulate pivot table functionality and create an interactive dashboard that aggregates data based on category selections, similar to how a pivot table works.
Crystal xcelsius best practices and workflows for building enterprise solut...Yogeeswar Reddy
This document provides best practices and workflows for building data visualization solutions in Crystal Xcelsius (now known as SAP BusinessObjects Xcelsius). It discusses spreadsheet design, model design, query design, and basic workflows for building standard and more advanced interactive features like dynamically filtered lists, drill down, and time intelligence calculations. The goals are to optimize performance, reduce data fetching, and create intuitive user experiences.
1) The document proposes MF-Retarget, a query retargeting mechanism that handles multiple fact table schemas in data warehouses and leverages pre-computed aggregates to improve performance.
2) MF-Retarget provides transparency to users by hiding the complexities of joining multiple fact tables and the use of aggregates. It rewrites user queries as needed to produce correct results.
3) The retargeting mechanism sits between the front-end tools and the database to accept user queries and optimize them by leveraging aggregates and properly joining fact tables before returning results to users.
This document provides an overview of using the VBA API in SAP BusinessObjects Analysis Office 1.1. It discusses using the API to build sophisticated BI workbooks, call formulas within cells, get and show information, and set filters using macros. The document then provides code samples for enabling the Analysis Office add-in, refreshing data, creating a drill-down button using cell context information, setting filters with combo boxes, and creating a dynamic grid. All code samples are available for download from a shared link. The document serves as an introduction for developers on using the Analysis Office VBA API.
Business objects integration kit for sap crystal reports 2008Yogeeswar Reddy
This document provides instructions on how to create reports in Crystal Reports using data from SAP Business Warehouse (BW). It explains how to connect to SAP BW using the Crystal Reports toolbar or database explorer. It then walks through creating a sample report, including selecting fields, previewing the report, formatting objects, and saving. It also discusses how SAP BW metadata like dimensions, hierarchies and key figures are represented in Crystal Reports.
Teradata Aggregate Join Indices And Dimensional Modelspepeborja
The document discusses using aggregate join indices and dimensional models in Teradata to improve query performance for reporting and analytics workloads while maintaining a normalized 3NF data model. It provides an example comparing querying sales data from the past year versus the current year using the 3NF model versus a dimensional model with and without aggregate join indices. Using the dimensional model and join indices reduced the data volume accessed, eliminated table joins, and improved performance metrics like CPU usage, disk I/O, and elapsed time. Maintaining both models allows enjoying benefits of each while technology like join indices provides dimensional access at different granularities with low overhead.
This document outlines 6 golden rules for optimizing Teradata SQL queries: 1) Ensure statistic completeness and correctness, 2) Use primary indexes for joins whenever possible, 3) Leverage Teradata indexing techniques like secondary indexes and join indexes, 4) Rewrite queries when possible, 5) Monitor queries in real-time, and 6) Compare resource usage before and after optimization to measure improvement. Following these rules helps improve query performance by ensuring the optimizer selects efficient execution plans.
This white paper describes how to create publications in SAP BusinessObjects Enterprise to schedule report bursting and distribution. Publications allow reports to be personalized and delivered in various formats to dynamic recipients via email, file shares, and databases on a scheduled basis. Key steps include setting up dynamic recipient lists, personalization parameters, formats, destinations, scheduling, and notifications. Considerations are provided for using Crystal Reports or Web Intelligence as the recipient data source.
This document discusses best practices for building large scale relational data warehouses. It recommends partitioning large fact tables, building indexes on the date key of fact tables and foreign keys of dimension tables. Choosing the right partition grain and designing dimension tables efficiently with surrogate keys is also discussed. Maintaining data using sliding window techniques and efficiently loading, deleting, and backing up data are covered.
This document discusses multidimensional databases and provides comparisons to relational databases. It describes how multidimensional databases are optimized for data warehousing and online analytical processing (OLAP) applications. Key aspects covered include dimensional modeling using star and snowflake schemas, data storage in cubes with dimensions and members, and performance benefits of multidimensional databases for interactive analysis of large datasets to support decision making.
Data Warehouse Design and Best PracticesIvo Andreev
A data warehouse is a database designed for query and analysis rather than for transaction processing. An appropriate design leads to scalable, balanced and flexible architecture that is capable to meet both present and long-term future needs. This session covers a comparison of the main data warehouse architectures together with best practices for the logical and physical design that support staging, load and querying.
The document discusses three papers related to data warehouse design.
Paper 1 presents the X-META methodology, which addresses developing a first data warehouse project and integrates metadata creation and management into the development process. It proposes starting with a pilot project and defines three iteration types.
Paper 2 proposes extending the ER conceptual data model to allow modeling of multi-dimensional aggregated entities. It includes entity types for basic dimensions, simple aggregations, and multi-dimensional aggregated entities.
Paper 3 presents a comprehensive UML-based method for designing all phases of a data warehouse, from source data to implementation. It defines four schemas - operational, conceptual, storage, and business - and the mappings between them. It also provides steps
Column-oriented databases like Infobright Community Edition are well-suited for data warehousing due to their high data compression rates and efficient handling of analytic queries. Infobright uses data packs, knowledge nodes, and an optimizer to retrieve only necessary column data without decompressing entire files. It achieves industry-leading compression of 10-40x by optimizing algorithms for each data type and stores metadata to resolve complex queries without traditional row-based indexing. By integrating with MySQL, Infobright leverages existing connectivity and provides a low-cost option for data warehousing and business intelligence.
Teradata - Presentation at Hortonworks Booth - Strata 2014Hortonworks
Hortonworks and Teradata have partnered to provide a clear path to Big Analytics via stable and reliable Hadoop for the enterprise. The Teradata® Portfolio for Hadoop is a flexible offering of products and services for customers to integrate Hadoop into their data architecture while taking advantage of the world-class service and support Teradata provides.
Data Vault Modeling and Methodology introduction that I provided to a Montreal event in September 2011. It covers an introduction and overview of the Data Vault components for Business Intelligence and Data Warehousing. I am Dan Linstedt, the author and inventor of Data Vault Modeling and methodology.
If you use the images anywhere in your presentations, please credit http://LearnDataVault.com as the source (me).
Thank-you kindly,
Daniel Linstedt
Essbase beginner's guide olap fundamental chapter 1Amit Sharma
This document provides an overview and introduction to OLAP concepts for beginners using Essbase. It defines key OLAP terms like cubes, dimensions, measures and explains core functionality like slicing, dicing, rotating and aggregating data in multidimensional databases. The document provides examples and diagrams to illustrate concepts and is intended to help readers understand and learn the basics of working with Hyperion Essbase.
SKILLWISE-SSIS DESIGN PATTERN FOR DATA WAREHOUSINGSkillwise Group
This document provides an overview of the SSIS design pattern for data warehousing and change data capture. It discusses what design patterns are and how they are commonly used for SSIS and data warehousing projects. It then covers 13 specific patterns including truncate and load, slowly changing dimensions, hashbytes, change data capture, merge, and master/child workflows. The document explains when each pattern is best used and provides pros and cons. It also provides guidance on configuring and using SQL Server change data capture functionality.
Creating a Tabular Model Using SQL Server 2012 Analysis ServicesCode Mastery
At Code Mastery Boston Steve Hughes, Principal Consultant at Magenic, highlights: Basics of SQL Server 2012 Analysis Services, Multidimensional Model, VS PowerPivot, Creating a Tabular Model
This chapter covers controls that display and maintain data on web sites, including the GridView, DetailsView, and SqlDataSource controls. It discusses how to display, insert, edit, and delete data using these controls while maintaining data integrity. The chapter also covers storing connection strings and using templates and paging with data controls.
Real-world BISM in SQL Server 2012 SSASLynn Langit
The document discusses the Business Intelligence Semantic Model (BISM) in SQL Server Analysis Services. It provides an overview of what BISM is, why it should be used, how to get started with it, and how to create and enhance BISM models. It also includes demonstrations of creating a BISM model in SQL Server Data Tools and deploying it to Analysis Services.
This document provides tips for optimizing performance in Power BI by focusing on different areas like data sources, the data model, visuals, dashboards, and using trace and log files. Some key recommendations include filtering data early, keeping the data model and queries simple, limiting visual complexity, monitoring resource usage, and leveraging log files to identify specific waits and bottlenecks. An overall approach of focusing on time-based optimization by identifying and addressing the areas contributing most to latency is advocated.
This document discusses SSAS tabular models and compares them to multidimensional models. Tabular models offer shorter development times than multidimensional models. While tabular models have some limitations compared to multidimensional models, they provide high performance through in-memory column-based data storage and up to 10x data compression. The document provides a detailed comparison of the features and capabilities of tabular and multidimensional models. It also discusses considerations for choosing between the two types of models based on factors like data complexity, user requirements, and hardware.
The Data Warehouse is a database which merges, summarizes and analyzes all data sources of a company/organization. Users can request particular data from the system (such the number of sales within a certain period) and will be provided with the respective information.
With the help of the Data Warehouse, you can quickly access different systems and look at historic data. Due to the vast amount of data it provides, the Data Warehouse is an essential tool when making management decisions.
Big Data Warehousing Meetup: Dimensional Modeling Still Matters!!!Caserta
Joe Caserta went over the details inside the big data ecosystem and the Caserta Concepts Data Pyramid, which includes Data Ingestion, Data Lake/Data Science Workbench and the Big Data Warehouse. He then dove into the foundation of dimensional data modeling, which is as important as ever in the top tier of the Data Pyramid. Topics covered:
- The 3 grains of Fact Tables
- Modeling the different types of Slowly Changing Dimensions
- Advanced Modeling techniques like Ragged Hierarchies, Bridge Tables, etc.
- ETL Architecture.
He also talked about ModelStorming, a technique used to quickly convert business requirements into an Event Matrix and Dimensional Data Model.
This was a jam-packed abbreviated version of 4 days of rigorous training of these techniques being taught in September by Joe Caserta (Co-Author, with Ralph Kimball, The Data Warehouse ETL Toolkit) and Lawrence Corr (Author, Agile Data Warehouse Design).
For more information, visit http://casertaconcepts.com/.
The document discusses SQL Parallel Data Warehouse (PDW), which is a massively parallel processing appliance for large data warehousing workloads. It describes the different types of nodes in PDW, including control nodes that manage query execution, compute nodes that store and process data, and administrative nodes. The document also explains how PDW uses a hub and spoke architecture with the PDW appliance acting as a central data hub and individual data marts acting as spokes optimized for different user groups.
Introduction to Microsoft SQL Server 2008 R2 Analysis ServiceQuang Nguyễn Bá
The document discusses SQL Server 2008 R2 Analysis Services and provides an overview of its key components including OLAP, multidimensional data analysis using dimensions and hierarchies, and how it utilizes a dimensional data warehouse with fact and dimension tables to store and retrieve data for analysis. It also explains how Analysis Services provides scalable and extensible solutions for analytics and delivers pervasive business insights.
This document provides a summary of 100 tips and tricks for advanced business reporting in Microsoft Excel. It begins with an overview of the Excel interface and navigation basics. It then provides tips organized under tabs like Home, ranging from formatting text to inserting dates to converting values. The tips aim to help users work more efficiently in Excel for reporting and data analysis.
The document is the Oracle Coherence Developer's Guide, Release 3.7. It provides contextual information, instructions, and examples to teach developers and architects how to use Oracle Coherence and develop Coherence-based applications. Coherence allows for clustered data management, uses a single API for logical operations and XML configuration for physical settings, and supports caching, various data storage and serialization options, and extensibility.
Getting started with entity framework 6 code first using mvc 5Ehtsham Khan
This document summarizes steps for creating an ASP.NET MVC 5 application using Entity Framework 6 Code First to access data. It describes creating a data model with Student, Enrollment, and Course entities, a database context, and test data initialization. It also covers creating a Student controller and views to display and manage student data, adding basic CRUD functionality, sorting, filtering, paging, and connection resiliency.
Better unit testing with microsoft fakes (rtm)Steve Xu
This document provides an introduction to Microsoft Fakes, a framework for unit testing code that is difficult to isolate and test due to dependencies. It discusses challenges with unit testing code due to dependencies, and how Microsoft Fakes addresses this using stubs and shims. Stubs replace dependencies with test doubles, while shims use runtime interception to detour around dependencies and replace them with test-controlled versions. The document covers migrating to Microsoft Fakes from other isolation frameworks, best practices for using it, and advanced techniques like dealing with non-deterministic code.
This chapter introduces cloud computing fundamentals, including definitions of infrastructure as a service (IaaS), platform as a service (PaaS), and software as a service (SaaS). It discusses how enterprise workloads have requirements that can benefit from the cost and convenience of IaaS. Oracle Cloud Infrastructure (OCI) is introduced as an IaaS offering that extends control deeper into the cloud stack compared to first-generation IaaS. OCI can also be extended to independent software vendors.
- Oracle Data Integrator is a tool for integrating data between heterogeneous systems and applications. It has components for modeling data, designing interfaces, executing integration processes, and monitoring results.
- The core components include repositories to store metadata, a design studio to create interfaces and mappings, and run-time agents that execute integration processes.
- This guide will help users get started with Oracle Data Integrator by walking through installing the software, exploring an example ETL project, and learning how to design and run integrations.
This document provides installation and configuration instructions for Oracle Business Intelligence Applications specifically for organizations using Informatica PowerCenter. It covers prerequisites for supported databases, best practices for optimizing performance on different databases, and partitioning guidelines for large fact tables. The document contains information about new features in the current release and how to navigate the Oracle BI repository documentation.
This document provides a developer's guide for using the Oracle Service Bus (OSB) integrated development environment (IDE) to create and configure proxy services, business services, message flows, transformations, transports, and other OSB resources. It describes tasks like creating projects and folders, generating services from WSDLs, designing split-join message flows, debugging message flows, and more.
The Autoscaling Application Block provides a mechanism for adding autoscaling behaviors to Windows Azure applications based on predictive usage patterns or reactive rules. It monitors applications and automatically scales resources up or down based on defined rules. Rules can constrain scaling within certain bounds or react to workload changes by scaling instances. The block hosts in its own role or on-premises to monitor the application and perform scaling.
This document provides an evaluation guide for Microsoft Office SharePoint Server 2007. It begins with an abstract and table of contents. It then discusses the goals of SharePoint Server 2007 in areas like content management, business processes, information sharing, and server administration. It provides overviews of key features like portals, search, content management, business forms and integration, and business intelligence. It also includes instructions for installing an evaluation server and a product walkthrough with exercises.
These are the first 4 chapters of my book Refresh the Road Ahead (www.refreshroadahead.com). A book on how to work successfully with Microsoft. The full book is 12 chapters and 260 pages and you can buy it from the website www.refreshroadahead.com or on Amazon
This document provides an overview and instructions for installing and using Oracle9i on Windows 2000 and Windows NT. It describes new features in Oracle9i Release 2 (9.2) and Release 1 (9.0.1), differences between using Oracle on Windows and UNIX, the Oracle9i architecture and services on Windows, and configuration parameters stored in the Windows registry. The document also covers topics such as multiple Oracle homes, the Optimal Flexible Architecture, accounts and passwords, and tools for developing and administering Oracle databases on Windows.
Plesk 8.0 for Linux/UNIX Client’s Guide provides information about using Plesk control panel software. It describes how to log in to Plesk, customize the interface, view hosting resources and features, create hosting plans using templates, predefine content for new websites, host websites, deploy databases, install applications, secure websites with SSL, and restrict access with passwords. The document is copyright 2006 by SWsoft and contains various legal notices and trademark information.
SPi Global partners with companies to maximize the value of their content online and offline. With escalating costs of
production and printing, changing customer preferences, and the need to adapt, SPi Global enables organizations to exploit
and invest in new media technology. With a complete suite of digital, publishing, content enrichment, marketing and
customer support services, we help companies gain a competitive advantage through our unique and innovative solutions.
This document provides an introduction to ScalaCheck, a library for property-based testing in Scala. It discusses the key concepts of properties and generators in ScalaCheck and provides examples of defining simple properties, grouping properties, and using generators to generate random test data for properties. The document also demonstrates how to integrate ScalaCheck with other testing frameworks like ScalaTest and JUnit.
Here are the key steps to degrade a SQL Server database from a higher version to a lower one:
1. Generate scripts for the database objects (tables, views, stored procedures, etc.) in the lower target version using SQL Server Management Studio.
2. Drop the existing database in the higher version.
3. Create an empty database with the same name in the lower target version.
4. Run the generated scripts to recreate all the database objects in the lower target version.
5. Use SQL Server Integration Services or bcp utility to export the data from the higher version database and import it into the recreated database in the lower target version.
6. Test the degraded database in the lower target
Share point server for business intelligenceVinh Nguyen
- Install Windows Server 2008 R2 on the Contoso-DC virtual machine and promote it to a domain controller for the contoso.com domain.
- Join the other virtual machines like Contoso-SQL and Contoso-AppSrv to the contoso.com domain.
- Create domain user accounts that will be used to deploy and configure SharePoint and SQL Server.
This article describes how to install Windows Server 2008 R2 on the Contoso-DC virtual machine and promote it to a domain controller for the contoso.com domain. It also provides instructions for joining other virtual machines
Share point server for business intelligenceSteve Xu
- Install Windows Server 2008 R2 on the Contoso-DC virtual machine and promote it to a domain controller for the contoso.com domain.
- Join the other virtual machines like Contoso-SQL and Contoso-AppSrv to the contoso.com domain.
- Create domain user accounts that will be used to deploy and configure SharePoint and SQL Server.
This article describes how to install Windows Server 2008 R2 on the Contoso-DC virtual machine and promote it to a domain controller for the contoso.com domain. It also provides instructions for joining other virtual machines
Share point server for business intelligenceVinh Nguyen
- Install Windows Server 2008 R2 on the Contoso-DC virtual machine and promote it to a domain controller for the contoso.com domain.
- Join the other virtual machines (Contoso-SQL, Contoso-AppSrv, Contoso-Client) to the contoso.com domain.
- Create domain user accounts that will be used to deploy and configure SharePoint and SQL Server.
This article describes how to install Windows Server 2008 R2 on the Contoso-DC virtual machine and promote it to a domain controller for the contoso.com domain. It also provides instructions