The case study discusses how a leading medical device company implemented BusinessObjects Xcelsius dashboards to enhance visibility into the utilization of field equipment and track sales performance. By developing an interactive dashboard, the company aimed to optimize asset deployment, improve sales efficiency, and save millions by reducing unnecessary inventory while maintaining sales effectiveness. Key benefits included increased accountability among the sales force, streamlined operations, and enhanced decision-making capabilities based on real-time data analysis.
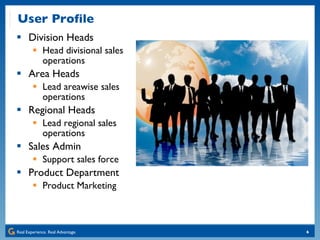
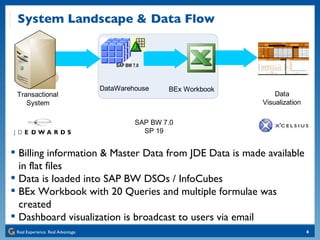
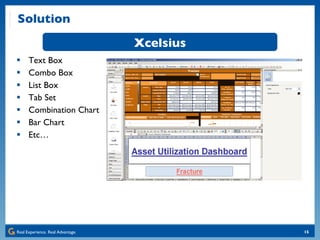
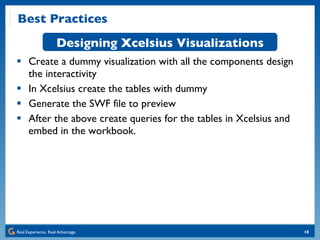
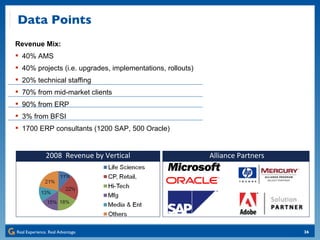
![Key Performance Indicators KPI Definition Asset Dist. Plan # of Assets that are planned for distribution directly to Reps and Branches. Current Onhand # of Assets currently held by Reps and Branches. Normalized YTD Normalized quantity of Assets held as of report date. (Asset Qty)*(# of Days on Hand) / (# of days in Current year) Grants Rep. Value of the Assets accumulated as of Report date with the Rep Cust. Value of the Assets accumulated as of Report date with the cust. Sales/Asset Normalized YTD "Sales – YTD” divided by “Asset – Normalized YTD”. Sales YTD “ Sales” from the Launch Date to the Report Date. LY “ Sales” for prior year. YTD Units “ Sales” in units from Launch Date to the Report Date. # of Proc./Asset Estimated # of procedures conducted per field Asset. {[Sales] / [Asset Val./Proc.]} / {Asset Current Onhand} Unutilized Assets Onhand # of Assets Onhand with no Sales since 4 weeks of Launch. % Assets Onhand to Total %age of Asset Unutilized to the Assets Onhand. Unutilized Assets Sal. Val. Sales value of the Unutilized Assets Onhand. # of Asset Transfers # of transfers of Assets between Reps, Branches and Reps & Branch.](https://image.slidesharecdn.com/sapboxcelsiusdashboardcasestudy-12798342510486-phpapp01/85/SAP-BO-Xcelsius-Dashboard-Case-Study-11-320.jpg)

![] Thank you for participating. Kumar Bhagava Sista Principal Consultant [email_address] 609-558-1848](https://image.slidesharecdn.com/sapboxcelsiusdashboardcasestudy-12798342510486-phpapp01/85/SAP-BO-Xcelsius-Dashboard-Case-Study-29-320.jpg)


![IBM Cognos 10 - Overview [1]](https://cdn.slidesharecdn.com/ss_thumbnails/pc01cognos-110412084132-phpapp01-thumbnail.jpg?width=640&height=640&fit=bounds)