Download to read offline


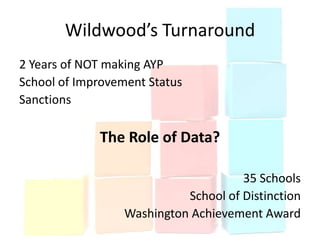


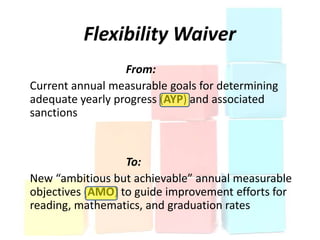
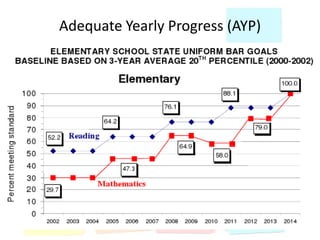
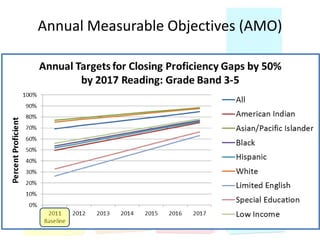

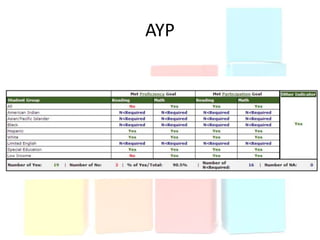
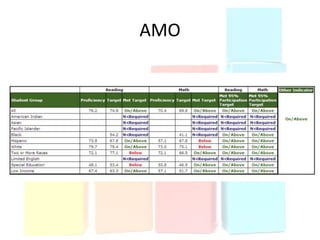
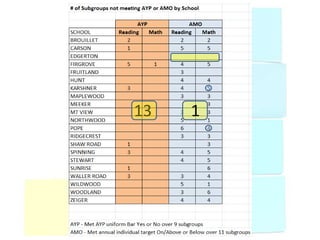
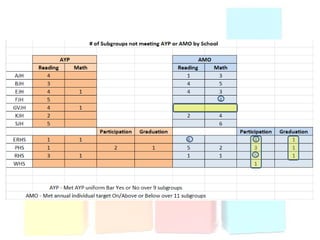
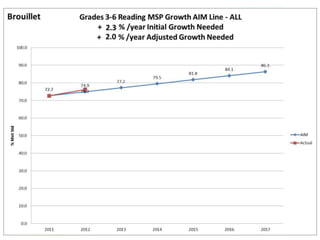
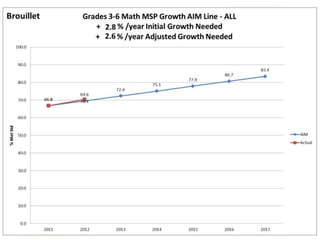


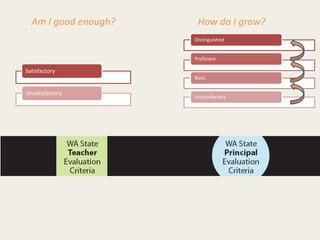
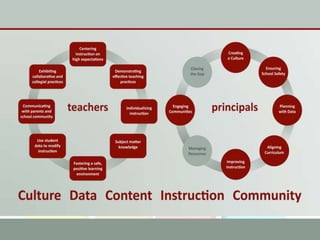
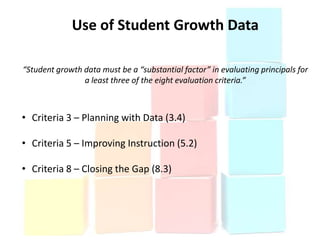


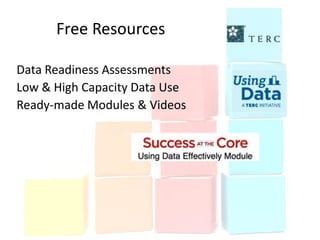
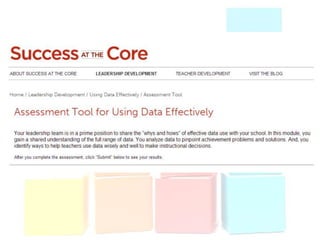
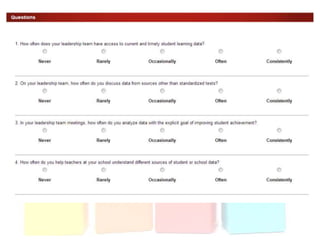


This document discusses using data to help principals and schools improve. It explains that principals need to understand data to evaluate teachers and set student achievement goals. Schools now use annual measurable objectives instead of adequate yearly progress to measure growth. The document provides examples of Washington schools that improved student performance through data-driven initiatives and collaborative inquiry among teachers. It also lists resources available to help principals and teachers explore and use data to inform instruction.


