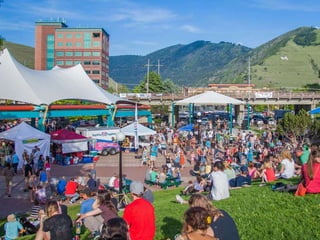
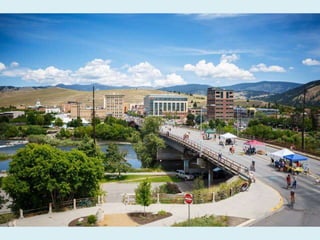
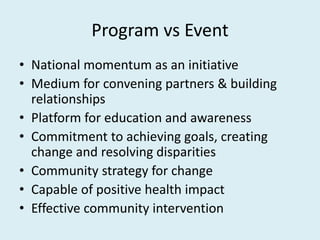
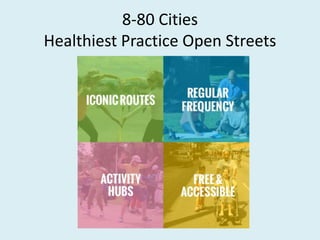
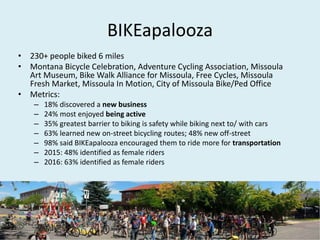
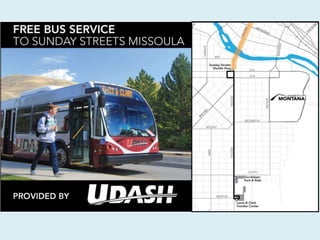
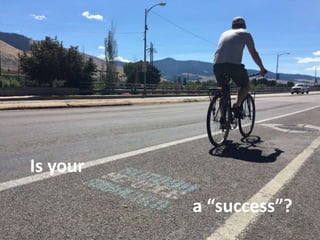
Busting Through Success Driven Complacency
what’s wrong with it?
butt. . .
“People see this as a fun event, and we see it as the
beginning of a conversation about better
transportation.”
Program vs Event
• National momentum as an initiative
• Medium for convening partners & building
relationships
• Platform for education and awareness
• Commitment to achieving goals, creating
change and resolving disparities
• Community strategy for change
• Capable of positive health impact
• Effective community intervention
8-80 Cities
Healthiest Practice Open Streets
Limitations
• Corporate sponsorships
• City entity
• Health buy-in
• Lack action team
• Misconceptions
• Metrics
• Success driven
COMPLACENCY
Targeted Tactics
1. Temporary Wayfinding
2. BIKEapalooza
3. First Friday Parklets
4. Sunday Streets Shuttle
Temporary Wayfinding
• Distance in terms of time
• Foster active living
• Guerilla marketing
• Permeate community
• *Target neighborhoods
• Metrics:
– Attendance increased by 20%
– 39% of attendees heard about
SSM because of these signs
– Let’s Move! Missoula signs
BIKEapalooza
• 230+ people biked 6 miles
• Montana Bicycle Celebration, Adventure Cycling Association, Missoula
Art Museum, Bike Walk Alliance for Missoula, Free Cycles, Missoula
Fresh Market, Missoula In Motion, City of Missoula Bike/Ped Office
• Metrics:
– 18% discovered a new business
– 24% most enjoyed being active
– 35% greatest barrier to biking is safety while biking next to/ with cars
– 63% learned new on-street bicycling routes; 48% new off-street
– 98% said BIKEapalooza encouraged them to ride more for transportation
– 2015: 48% identified as female riders
– 2016: 63% identified as female riders
Accessibility – Sunday Streets Shuttle
• Mountain Line (transit provider)
– ZeroFare
– No service on Sunday
• People live, work and play 7 days each week
• Metrics:
– Less than 1% of Southgate Triangle residents bike
or walk to work
– All other neighborhoods’ combined bicycle and
pedestrian commuter rates are 8 – 48%
Is your
a “success”?

WS 4D-2 Busting Through Success-Driven Complacency - Missoula

  • 1.
    Busting Through SuccessDriven Complacency
  • 3.
    what’s wrong withit? butt. . .
  • 4.
    “People see thisas a fun event, and we see it as the beginning of a conversation about better transportation.”
  • 7.
    Program vs Event •National momentum as an initiative • Medium for convening partners & building relationships • Platform for education and awareness • Commitment to achieving goals, creating change and resolving disparities • Community strategy for change • Capable of positive health impact • Effective community intervention
  • 8.
  • 9.
    Limitations • Corporate sponsorships •City entity • Health buy-in • Lack action team • Misconceptions • Metrics • Success driven COMPLACENCY
  • 10.
    Targeted Tactics 1. TemporaryWayfinding 2. BIKEapalooza 3. First Friday Parklets 4. Sunday Streets Shuttle
  • 11.
    Temporary Wayfinding • Distancein terms of time • Foster active living • Guerilla marketing • Permeate community • *Target neighborhoods • Metrics: – Attendance increased by 20% – 39% of attendees heard about SSM because of these signs – Let’s Move! Missoula signs
  • 14.
    BIKEapalooza • 230+ peoplebiked 6 miles • Montana Bicycle Celebration, Adventure Cycling Association, Missoula Art Museum, Bike Walk Alliance for Missoula, Free Cycles, Missoula Fresh Market, Missoula In Motion, City of Missoula Bike/Ped Office • Metrics: – 18% discovered a new business – 24% most enjoyed being active – 35% greatest barrier to biking is safety while biking next to/ with cars – 63% learned new on-street bicycling routes; 48% new off-street – 98% said BIKEapalooza encouraged them to ride more for transportation – 2015: 48% identified as female riders – 2016: 63% identified as female riders
  • 17.
    Accessibility – SundayStreets Shuttle • Mountain Line (transit provider) – ZeroFare – No service on Sunday • People live, work and play 7 days each week • Metrics: – Less than 1% of Southgate Triangle residents bike or walk to work – All other neighborhoods’ combined bicycle and pedestrian commuter rates are 8 – 48%
  • 20.