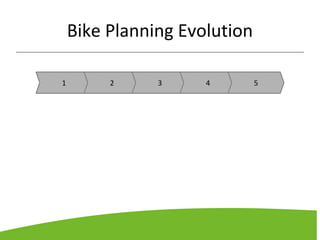
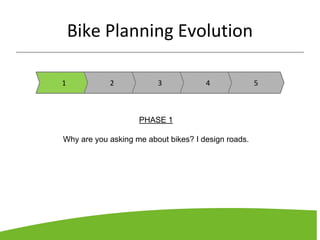
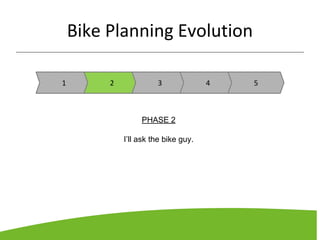
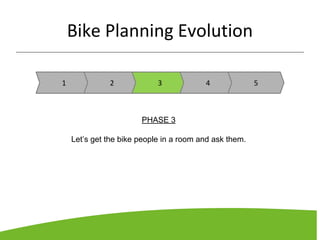
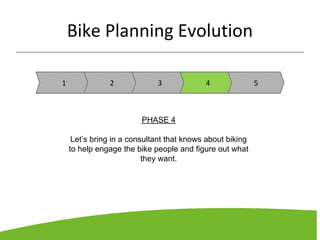
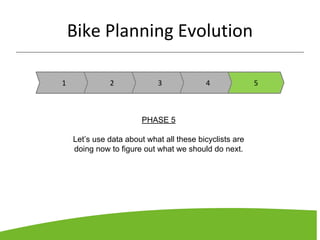
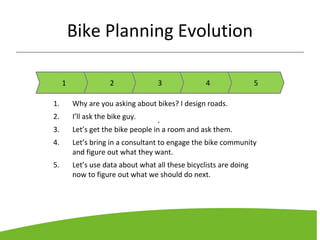
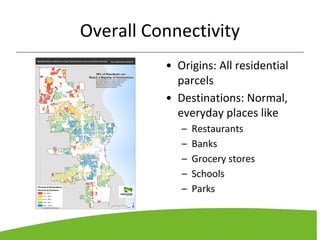
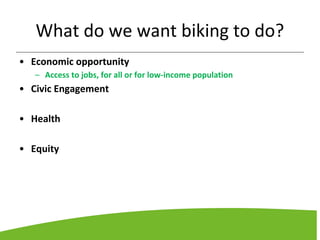
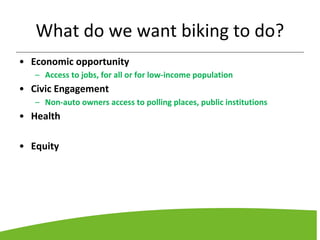
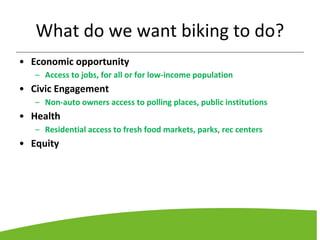
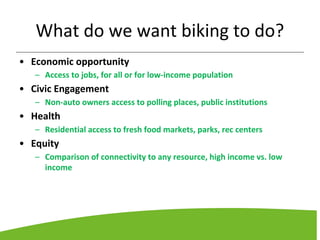
Asking the Right Questions
Combining values and data to improve biking &
build great communities.
Bike Planning Evolution
1 2 3 4 5
Bike Planning Evolution
1 2 3 4 5
PHASE 1
Why are you asking me about bikes? I design roads.
Bike Planning Evolution
1 2 3 4 5
PHASE 2
I’ll ask the bike guy.
Bike Planning Evolution
1 2 3 4 5
PHASE 3
Let’s get the bike people in a room and ask them.
Bike Planning Evolution
1 2 3 4 5
PHASE 4
Let’s bring in a consultant that knows about biking
to help engage the bike people and figure out what
they want.
Bike Planning Evolution
1 2 3 4 5
PHASE 5
Let’s use data about what all these bicyclists are
doing now to figure out what we should do next.
Bike Planning Evolution
1 2 3 4 5
.
1. Why are you asking about bikes? I design roads.
2. I’ll ask the bike guy.
3. Let’s get the bike people in a room and ask them.
4. Let’s bring in a consultant to engage the bike community
and figure out what they want.
5. Let’s use data about what all these bicyclists are doing
now to figure out what we should do next.
There are two key topics at the forefront of
data-driven bike analysis and planning.
SAFETY
&
CONNECTIVITY
Data-driven planning for bicyclist safety is
VISION ZERO.
Data-driven planning for bicyclist safety is
VISION ZERO.
(It’s great.)
Data-driven planning for bicyclist safety is
VISION ZERO.
(But if you wanted to hear about Vision Zero,
you’d be at the other panel right now.)
Data-driven planning for biking connectivity is
BikeAble.
How it works.
Origins | Level of Stress | Destinations
Level of Traffic Stress
• Every road & trail,
categorized by:
– Size
– Speed
– Hills
– Stress-reducing
characteristics
Overall Connectivity
• Origins: All residential
parcels
• Destinations: Normal,
everyday places like
– Restaurants
– Banks
– Grocery stores
– Schools
– Parks
What else can we do?
This is where we get to think big.
VALUES
&
VISION
What do we want biking to do?
• Economic opportunity
• Civic Engagement
• Health
• Equity
What do we want biking to do?
• Economic opportunity
– Access to jobs, for all or for low-income population
• Civic Engagement
• Health
• Equity
What do we want biking to do?
• Economic opportunity
– Access to jobs, for all or for low-income population
• Civic Engagement
– Non-auto owners access to polling places, public institutions
• Health
• Equity
What do we want biking to do?
• Economic opportunity
– Access to jobs, for all or for low-income population
• Civic Engagement
– Non-auto owners access to polling places, public institutions
• Health
– Residential access to fresh food markets, parks, rec centers
• Equity
What do we want biking to do?
• Economic opportunity
– Access to jobs, for all or for low-income population
• Civic Engagement
– Non-auto owners access to polling places, public institutions
• Health
– Residential access to fresh food markets, parks, rec centers
• Equity
– Comparison of connectivity to any resource, high income vs. low
income
Health Analysis: Access to Trails
Equity Analysis: Access to Trails
All Neighborhoods: 24% Disadvantaged: 8%
Data is powerful.
Our analytical capacity is
expanding.
It is up to us to ask the
right questions.
We express our values
through:
• The questions we ask.
• The data we collect.
• The visions we pursue.
• The outcomes we seek.
Let’s put our data to its best use.
COMMUNITIES
HEALTHY | CONNECTED | SAFE
SUSTAINABLE | EQUITABLE | PROSPEROUS
&
BikeAble
About RTC
Rails-to-Trails Conservancy (RTC) is a nonprofit organization dedicated to creating a
nationwide network or trails from former rail lines and connecting corridors to build healthier
places for healthier people.
About BikeAble
BikeAble is a GIS-based analytical tool that models low-stress bicycling connectivity in
communities. To bring BikeAble to your community, contact me.
Shane Farthing
Senior Director, Active Transportation Programs
shane@railstotrails.org

Biking Communities Data

  • 1.
    Asking the RightQuestions Combining values and data to improve biking & build great communities.
  • 2.
  • 3.
    Bike Planning Evolution 12 3 4 5 PHASE 1 Why are you asking me about bikes? I design roads.
  • 4.
    Bike Planning Evolution 12 3 4 5 PHASE 2 I’ll ask the bike guy.
  • 5.
    Bike Planning Evolution 12 3 4 5 PHASE 3 Let’s get the bike people in a room and ask them.
  • 6.
    Bike Planning Evolution 12 3 4 5 PHASE 4 Let’s bring in a consultant that knows about biking to help engage the bike people and figure out what they want.
  • 7.
    Bike Planning Evolution 12 3 4 5 PHASE 5 Let’s use data about what all these bicyclists are doing now to figure out what we should do next.
  • 8.
    Bike Planning Evolution 12 3 4 5 . 1. Why are you asking about bikes? I design roads. 2. I’ll ask the bike guy. 3. Let’s get the bike people in a room and ask them. 4. Let’s bring in a consultant to engage the bike community and figure out what they want. 5. Let’s use data about what all these bicyclists are doing now to figure out what we should do next.
  • 9.
    There are twokey topics at the forefront of data-driven bike analysis and planning.
  • 10.
  • 11.
    Data-driven planning forbicyclist safety is VISION ZERO.
  • 12.
    Data-driven planning forbicyclist safety is VISION ZERO. (It’s great.)
  • 13.
    Data-driven planning forbicyclist safety is VISION ZERO. (But if you wanted to hear about Vision Zero, you’d be at the other panel right now.)
  • 14.
    Data-driven planning forbiking connectivity is BikeAble.
  • 15.
  • 16.
    Origins | Levelof Stress | Destinations
  • 17.
    Level of TrafficStress • Every road & trail, categorized by: – Size – Speed – Hills – Stress-reducing characteristics
  • 18.
    Overall Connectivity • Origins:All residential parcels • Destinations: Normal, everyday places like – Restaurants – Banks – Grocery stores – Schools – Parks
  • 19.
  • 20.
    This is wherewe get to think big. VALUES & VISION
  • 21.
    What do wewant biking to do? • Economic opportunity • Civic Engagement • Health • Equity
  • 22.
    What do wewant biking to do? • Economic opportunity – Access to jobs, for all or for low-income population • Civic Engagement • Health • Equity
  • 23.
    What do wewant biking to do? • Economic opportunity – Access to jobs, for all or for low-income population • Civic Engagement – Non-auto owners access to polling places, public institutions • Health • Equity
  • 24.
    What do wewant biking to do? • Economic opportunity – Access to jobs, for all or for low-income population • Civic Engagement – Non-auto owners access to polling places, public institutions • Health – Residential access to fresh food markets, parks, rec centers • Equity
  • 25.
    What do wewant biking to do? • Economic opportunity – Access to jobs, for all or for low-income population • Civic Engagement – Non-auto owners access to polling places, public institutions • Health – Residential access to fresh food markets, parks, rec centers • Equity – Comparison of connectivity to any resource, high income vs. low income
  • 26.
  • 27.
    Equity Analysis: Accessto Trails All Neighborhoods: 24% Disadvantaged: 8%
  • 28.
  • 29.
  • 30.
    It is upto us to ask the right questions.
  • 31.
    We express ourvalues through: • The questions we ask. • The data we collect. • The visions we pursue. • The outcomes we seek.
  • 32.
    Let’s put ourdata to its best use.
  • 33.
    COMMUNITIES HEALTHY | CONNECTED| SAFE SUSTAINABLE | EQUITABLE | PROSPEROUS & BikeAble
  • 34.
    About RTC Rails-to-Trails Conservancy(RTC) is a nonprofit organization dedicated to creating a nationwide network or trails from former rail lines and connecting corridors to build healthier places for healthier people. About BikeAble BikeAble is a GIS-based analytical tool that models low-stress bicycling connectivity in communities. To bring BikeAble to your community, contact me. Shane Farthing Senior Director, Active Transportation Programs shane@railstotrails.org