
Download to read offline


![Be Brief. To provide an adequately comprehensive but targeted argument within a limited space,
the focus of the brief needs to be limited to a particular problem or area of a problem. If your
research project has several elements don’t try to cover it all in one policy brief.
Get to the point. Your policy audience doesn’t have the time or inclination to read an in-depth 20-
page argument on a policy problem. Do not exceed 4-6 pages in length (i.e. usually not longer than
2,000 words).
Think about your language. This not only refers to using clear and simple language (i.e. not the
jargon and concepts of an academic discipline) but also to providing a well-explained and easy-to-
follow argument targeting a wide but knowledgeable audience.
Make the text accessible. Make it easy for your reader to read all the way through by subdividing
the text using clear descriptive titles as guides. Try to use the following structure as a guide
(suitable for a 2200 word/4 page policy brief):
PREPARATION
Who is your target audience?
What problem does your policy brief aim to address?
What is the core message of your brief?
WRITING THE BRIEF
Executive summary: [220 words max]
Introduction: [330 words max]
Methodology: [110-220 words max]
Results and conclusions: [660 words max]
References and other useful resources: [220 words max]
Be creative. The policy brief should catch the eye of the potential audience in order to create a
favourable impression (e.g. professional, innovative etc.). Think creatively about how you present
the information, e.g. use of colour, use of logos, photographs, slogans, illustrative quotes etc.
Make your policy brief travel. It’s not enough to simply write a policy brief and expect it to be read.
Put some energy behind it, engage with information intermediaries (whose job it is to access
research information and tailor it for different audiences), or go directly to policy makers and make
them aware of your policy brief. You could also explore using social media such as Twitter, Social
Bookmarking e.g. Delicious, Wikipedia and blogging to bring attention to your policy brief, but don’t
lose sight of your the real focus of audience!](https://image.slidesharecdn.com/writingpolicybriefs-140622062959-phpapp01/85/Top-Tips_Research-Communications-Effective-Communication-for-Southern-Researchers-4-320.jpg)
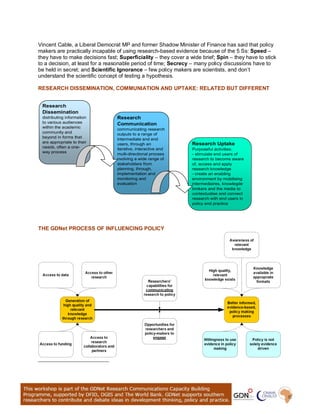
This document discusses various aspects of effectively communicating research to influence policy processes. It begins by outlining different theories on how evidence informs policy, noting the complexity of real-world policymaking. It then provides practical considerations for researchers, such as identifying the target policymaking process and understanding differing notions of evidence between researchers and policymakers. The document also discusses disseminating and communicating research through various means like policy briefs and targeting communications effectively to different audiences. It concludes by emphasizing the importance of analyzing target audiences and using preferred communication formats and channels to share research findings.


![Policy process presn-12feb13- rebecca hanlin [compatibility mode]](https://cdn.slidesharecdn.com/ss_thumbnails/policyprocess-presn-12feb13-rebeccahanlincompatibilitymode-130224115853-phpapp02-thumbnail.jpg?width=640&height=640&fit=bounds)


