Download to read offline
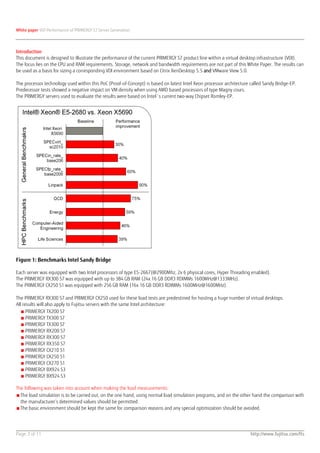
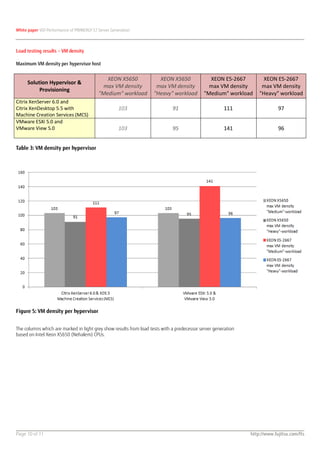

The white paper evaluates the performance of Fujitsu's Primergy S7 servers within a virtual desktop infrastructure (VDI), focusing on CPU and RAM requirements while considering various workloads. Key findings indicate that local storage and RAM configurations significantly impact VM density, with recommendations for optimizing resources to avoid wait states caused by slower disk I/O. The results serve as a foundation for sizing VDI environments using Citrix XenDesktop and VMware View technologies.


![Couchbase meetup20131212 [look back in 2013]](https://cdn.slidesharecdn.com/ss_thumbnails/couchbasemeetup20131212-140212084855-phpapp02-thumbnail.jpg?width=640&height=640&fit=bounds)


![Getting Started with Apache Spark: Big Data Made Simple [Free Meetup]](https://cdn.slidesharecdn.com/ss_thumbnails/apachesparkgettingstarted-260203175547-8361bcc3-thumbnail.jpg?width=640&height=640&fit=bounds)


