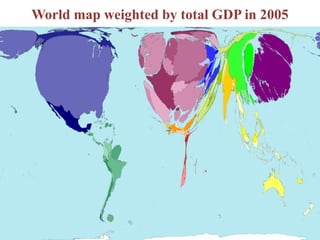
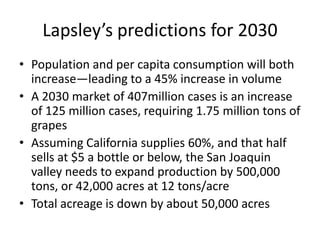
The U.S. Wine Market in a Global
Context
Dr. James Lapsley
Dept. of Viticulture and Enology
Agricultural Issues Center
How might a U.C. perspective differ?
• More Objective? We don’t produce or sell wine.
Treat it as an interesting good but still a good that
responds to supply/demand
• Focus on supply? Grapes are an agricultural
product and we study production. Little actual
consumer research
• California-centric? California dominates U.S.
production
• Historical? Current events placed in longer term
perspective
2010 Wine Market Council Study
Abstainer
39.4%
Core
20.4%
Marginal
13.9%
Beer/Spirits
26.3%
Percent Adult Population
Marginal
consumers drink
less than 1 glass a
week, although
they say they
enjoy wine. They
drink the other 9%
Core Consumers enjoy
at least one glass of
wine a week or more.
At 20% of the adult
population they
number about 36
million and they
consume 91% of all
table wine—averaging
70 liters per person
Source: Wine Market Council
How Does the U.S. Compare?
0
5
10
15
20
25
30
35
40
Germany France U.K. Japan Argentina Canada U.S.
Source: WHO Global Status Report on Alcohol 2004
Percent Adult Abstainers
Wine Consumers – the traditional
view
New to Wine in 1 Year in 3 Years in 5 Years
Quantity & Quality
Thanks to Christian Miller for the slide!
Wine Consumers – Defined by Price
and Frequency of Consumption
Frequency of consumption
Avg.
Price
of
Wine
Occasional
wine
drinkers
Regular wine
drinkers
Bag-in-Box buyers
Wine aficionados
Constellation’s “Project Genome” 3500 in-depth interviews in 2005
% Core
73
49
59
54
33
28
Genome by Quantity
Percent
Consumers
Glasses
per week
Percent all
wine
Enthusiast 12 5.1 18
Image
Seekers
20 3.3 23
S.Shoppers 15 3.5 18
Traditional 16 3.0 16
Satisfied 14 2.2 11
Overwhelm 23 1.7 14
What about supply?
2010 U. S. Wine Sales by Price Category
<$3 $3-$7 $7-15 >$15
% Volume 21 36 30 13
% Price 7 24 36 33
0
5
10
15
20
25
30
35
40
Percent
Data sources: Jon Fredrikson and Christian Miller
The U.S. wine market in 2010
• California supplied 61% of all wine sold.
• 82% of California wine was sold in the U.S.
• Of the 18% exported, half was bulk, and
valued at $1.05 a liter
• Approximately 57% of the wine sold in the
U.S. retailed for under $7 a bottle ($9.33/L)
and 21% sold for less than $3 ($4/L) a bottle
• Most of this wine came from the San Joaquin
Valley
2010 Imports to U.S.
Country Value ($ Millions) Volume (million Ls) $/L
Italy 1,253 246 5.09
France 988 90 10.97
Australia 603 211 2.85
Chile 274 121 2.26
Argentina 269 87 3.09
Spain 264 53 4.98
New Zealand 197 31 6.35
The above figures are import values. Retail prices are at least 2X, perhaps 3X
Tons of U.S. Grapes Crushed
Vintage 2010
California, 90% all
tonnage: 3,400,000
tons
New York: 60,000
tons (only 9,550
vinifera)
Washington:
160,000
Oregon: 40,000
tons
2010 Crush Percentages
Volume: Tons Crushed
Valley
74%
Coast
26%
Value: Percent Dollars
Valley
39%
Coast
61%
California’s San Joaquin Valley (districts
11, 12, 13, 14 and 17) crushed 78% of all
grapes in 2009 but received only 40% of
the value. Districts 12, 13, and 14
crushed 52% of all grapes and District 13
accounted for 1/3rd of California wine
grape production.
Can Winegrapes compete with Almonds?
50 years of Almonds and Winegrapes
0
100000
200000
300000
400000
500000
600000
700000
800000
1960
1970
1980
1990
2000
2010
State Acreage
Almonds Winegrapes
0
500
1000
1500
2000
2500
3000
1960
1970
1980
1990
2000
2010
Value (millions)
Almonds Winegrapes
About 85% of California’s almond acreage and 50% of winegrape acreage are in the
San Joaquin Valley, (winegrapes down from 60% in 1980).
Gross Revenue per Acre
0
500
1000
1500
2000
2500
3000
3500
4000
4500
5000
1980 1985 1990 1995 2000 2005 2009
Almonds
Winegrapes
Bearing Acres San Joaquin Valley
0
100000
200000
300000
400000
500000
600000
1980 1985 1990 1995 2000 2005 2010
Almonds
Winegrapes
5 Year Weighted Average Returns per
Acre San Joaquin Valley, 2005-2009
Almonds Winegrapes
Establishment 4839 6746
Total Cash Costs 2761 2603
Gross Revenue 3747 2571
Difference 986 -32
Costs do not include non-cash overhead expenses such as interest on land or
depreciation of vineyard/orchard establishment. Gross revenue is derived from
County Ag. Commissioner reports and is a 5 year (2005-2009) weighted average.
Total California Shipments
(Domestic and Export)
0
200
400
600
800
1000
1200
1400
1600
1800
Millions of gallons or pounds
Almonds
Wine
The World Matters for Both
Almonds Wine
% World Production 80 7
% California Production Exported 70 17
% of World Shipments 90 4
Two ways of looking at these numbers:
1. Since there is a large demand for wine in the world, California producers have
a major opportunity to increase volume if they can compete with other
producers. In contrast, California almond producers may well face increased
international competition and lose market share.
2. International demand is still growing for Almonds and California has brand
recognition. In contrast, demand for wine is stable or shrinking and major old
world producers dominate
World map weighted by total GDP in 2005
World map weighted by estimated GDP in 2015
Lapsley’s predictions for 2030
• Population and per capita consumption will both
increase—leading to a 45% increase in volume
• A 2030 market of 407million cases is an increase
of 125 million cases, requiring 1.75 million tons of
grapes
• Assuming California supplies 60%, and that half
sells at $5 a bottle or below, the San Joaquin
valley needs to expand production by 500,000
tons, or 42,000 acres at 12 tons/acre
• Total acreage is down by about 50,000 acres
So how will wineries meet demand?
0
0.2
0.4
0.6
0.8
1
1.2
1.4
0
50000
100000
150000
200000
250000
2000
2001
2002
2003
2004
2005
2006
2007
2008
2009
2010
1000’sliters
Bulk Wine Imports and Price per liter
$/liter
Volume
The future of Winegrapes in districts 13 and 14?
• With average yields of over 12 tons/acre, the region is
very productive but is in competition with other bulk
wine producing regions of the world.
• Of the 92,000 acres currently planted in districts 13 and
14, 91,000 are over 10 years old and will probably be
pulled by 2030.
• Will those acres be replanted and another 40,000 added
to meet projected increased demand—or will wineries
meet demand by importing bulk wine?
• Replanting is probable only if major wineries commit to
long-term contracts and if California winegrapes can
compete with winegrapes grown elsewhere.
Thanks for your attention!
And thanks to: Dan Sumner, Jonathan
Barker and Jessica Vergati, Agricultural
Issues Center, UC Davis and to Christian
Miller, Full Glass Research, Berkeley

Wine marketglobalcontext

  • 1.
    The U.S. WineMarket in a Global Context Dr. James Lapsley Dept. of Viticulture and Enology Agricultural Issues Center
  • 2.
    How might aU.C. perspective differ? • More Objective? We don’t produce or sell wine. Treat it as an interesting good but still a good that responds to supply/demand • Focus on supply? Grapes are an agricultural product and we study production. Little actual consumer research • California-centric? California dominates U.S. production • Historical? Current events placed in longer term perspective
  • 3.
    2010 Wine MarketCouncil Study Abstainer 39.4% Core 20.4% Marginal 13.9% Beer/Spirits 26.3% Percent Adult Population Marginal consumers drink less than 1 glass a week, although they say they enjoy wine. They drink the other 9% Core Consumers enjoy at least one glass of wine a week or more. At 20% of the adult population they number about 36 million and they consume 91% of all table wine—averaging 70 liters per person Source: Wine Market Council
  • 4.
    How Does theU.S. Compare? 0 5 10 15 20 25 30 35 40 Germany France U.K. Japan Argentina Canada U.S. Source: WHO Global Status Report on Alcohol 2004 Percent Adult Abstainers
  • 5.
    Wine Consumers –the traditional view New to Wine in 1 Year in 3 Years in 5 Years Quantity & Quality Thanks to Christian Miller for the slide!
  • 6.
    Wine Consumers –Defined by Price and Frequency of Consumption Frequency of consumption Avg. Price of Wine Occasional wine drinkers Regular wine drinkers Bag-in-Box buyers Wine aficionados
  • 7.
    Constellation’s “Project Genome”3500 in-depth interviews in 2005 % Core 73 49 59 54 33 28
  • 8.
    Genome by Quantity Percent Consumers Glasses perweek Percent all wine Enthusiast 12 5.1 18 Image Seekers 20 3.3 23 S.Shoppers 15 3.5 18 Traditional 16 3.0 16 Satisfied 14 2.2 11 Overwhelm 23 1.7 14
  • 9.
  • 10.
    2010 U. S.Wine Sales by Price Category <$3 $3-$7 $7-15 >$15 % Volume 21 36 30 13 % Price 7 24 36 33 0 5 10 15 20 25 30 35 40 Percent Data sources: Jon Fredrikson and Christian Miller
  • 11.
    The U.S. winemarket in 2010 • California supplied 61% of all wine sold. • 82% of California wine was sold in the U.S. • Of the 18% exported, half was bulk, and valued at $1.05 a liter • Approximately 57% of the wine sold in the U.S. retailed for under $7 a bottle ($9.33/L) and 21% sold for less than $3 ($4/L) a bottle • Most of this wine came from the San Joaquin Valley
  • 12.
    2010 Imports toU.S. Country Value ($ Millions) Volume (million Ls) $/L Italy 1,253 246 5.09 France 988 90 10.97 Australia 603 211 2.85 Chile 274 121 2.26 Argentina 269 87 3.09 Spain 264 53 4.98 New Zealand 197 31 6.35 The above figures are import values. Retail prices are at least 2X, perhaps 3X
  • 13.
    Tons of U.S.Grapes Crushed Vintage 2010 California, 90% all tonnage: 3,400,000 tons New York: 60,000 tons (only 9,550 vinifera) Washington: 160,000 Oregon: 40,000 tons
  • 14.
    2010 Crush Percentages Volume:Tons Crushed Valley 74% Coast 26% Value: Percent Dollars Valley 39% Coast 61%
  • 15.
    California’s San JoaquinValley (districts 11, 12, 13, 14 and 17) crushed 78% of all grapes in 2009 but received only 40% of the value. Districts 12, 13, and 14 crushed 52% of all grapes and District 13 accounted for 1/3rd of California wine grape production.
  • 16.
  • 17.
    50 years ofAlmonds and Winegrapes 0 100000 200000 300000 400000 500000 600000 700000 800000 1960 1970 1980 1990 2000 2010 State Acreage Almonds Winegrapes 0 500 1000 1500 2000 2500 3000 1960 1970 1980 1990 2000 2010 Value (millions) Almonds Winegrapes About 85% of California’s almond acreage and 50% of winegrape acreage are in the San Joaquin Valley, (winegrapes down from 60% in 1980).
  • 18.
    Gross Revenue perAcre 0 500 1000 1500 2000 2500 3000 3500 4000 4500 5000 1980 1985 1990 1995 2000 2005 2009 Almonds Winegrapes
  • 19.
    Bearing Acres SanJoaquin Valley 0 100000 200000 300000 400000 500000 600000 1980 1985 1990 1995 2000 2005 2010 Almonds Winegrapes
  • 20.
    5 Year WeightedAverage Returns per Acre San Joaquin Valley, 2005-2009 Almonds Winegrapes Establishment 4839 6746 Total Cash Costs 2761 2603 Gross Revenue 3747 2571 Difference 986 -32 Costs do not include non-cash overhead expenses such as interest on land or depreciation of vineyard/orchard establishment. Gross revenue is derived from County Ag. Commissioner reports and is a 5 year (2005-2009) weighted average.
  • 21.
    Total California Shipments (Domesticand Export) 0 200 400 600 800 1000 1200 1400 1600 1800 Millions of gallons or pounds Almonds Wine
  • 22.
    The World Mattersfor Both Almonds Wine % World Production 80 7 % California Production Exported 70 17 % of World Shipments 90 4 Two ways of looking at these numbers: 1. Since there is a large demand for wine in the world, California producers have a major opportunity to increase volume if they can compete with other producers. In contrast, California almond producers may well face increased international competition and lose market share. 2. International demand is still growing for Almonds and California has brand recognition. In contrast, demand for wine is stable or shrinking and major old world producers dominate
  • 23.
    World map weightedby total GDP in 2005
  • 24.
    World map weightedby estimated GDP in 2015
  • 25.
    Lapsley’s predictions for2030 • Population and per capita consumption will both increase—leading to a 45% increase in volume • A 2030 market of 407million cases is an increase of 125 million cases, requiring 1.75 million tons of grapes • Assuming California supplies 60%, and that half sells at $5 a bottle or below, the San Joaquin valley needs to expand production by 500,000 tons, or 42,000 acres at 12 tons/acre • Total acreage is down by about 50,000 acres
  • 26.
    So how willwineries meet demand? 0 0.2 0.4 0.6 0.8 1 1.2 1.4 0 50000 100000 150000 200000 250000 2000 2001 2002 2003 2004 2005 2006 2007 2008 2009 2010 1000’sliters Bulk Wine Imports and Price per liter $/liter Volume
  • 27.
    The future ofWinegrapes in districts 13 and 14? • With average yields of over 12 tons/acre, the region is very productive but is in competition with other bulk wine producing regions of the world. • Of the 92,000 acres currently planted in districts 13 and 14, 91,000 are over 10 years old and will probably be pulled by 2030. • Will those acres be replanted and another 40,000 added to meet projected increased demand—or will wineries meet demand by importing bulk wine? • Replanting is probable only if major wineries commit to long-term contracts and if California winegrapes can compete with winegrapes grown elsewhere.
  • 28.
    Thanks for yourattention! And thanks to: Dan Sumner, Jonathan Barker and Jessica Vergati, Agricultural Issues Center, UC Davis and to Christian Miller, Full Glass Research, Berkeley