SlideShare a Scribd company logo
1 of 11
Download to read offline
Forecasts W/O the ERP system 2000 2001 2002 2003 2004 2005
Units (in thousands) 2,271 2,271 2,271 2,271 2,271 2,271
Revenue (in thousands) 477,784 477,784 477,785 477,785 477,785 477,785
COGS (In thousands) 418,925 418,925 418,925 418,925 418,925 418,925
Margin (in thousands) 58,859 58,859 58,860 58,860 58,860 58,860
Price per unit 210.38 210.38 210.39 210.39 210.39 210.39
COGS per unit 184.47 184.47 184.47 184.47 184.47 184.47
Margins per unit 25.92 25.92 25.92 25.92 25.92 25.92
Percentage margin 12.32% 12.32% 12.32% 12.32% 12.32% 12.32%
Days Sales' inventories 45 45 45 45 45 45 8.11 times per year
Inventory ($ 51,648) ($ 51,648) ($ 51,648) ($ 51,648) ($ 51,648) ($ 51,648)
DSI = (Inventory/COGS)/365 18851625 18851625 18851625 18851625 18851625 18851625
Inventory Dollar Amt ($ 51,648) ($ 51,648) ($ 51,648) ($ 51,648) ($ 51,648) ($ 51,648)
Impact of ERP System 2000 2001 2002 2003 2004 2005
Additional units (Cumulative) 36 93 143 143 143 143
assuming COGS
stays same for
each prodcut
Chng in margins (b/c more expensive) 0.06% 0.25% 0.25% 0.25% 0.25% 0.25%
DSI Reduction (Cumulative) 3 8 12 12 12 12 days saved
Calculation for additional units 2000 2001 2002 2003 2004 2005
Pre-ERP Units 2,271 2,271 2,271 2,271 2,271 2,271
Pre-ERP Availability 73.5% 73.5% 73.5% 73.5% 73.5% 73.5%
Target Availability (Post ERP) 92% 92% 92% 92% 92% 92%
Improvement in Availability 25.2% 25.2% 25.2% 25.2% 25.2% 25.2%
Sales Increase (Improvement) 25% 25% 25% 25% 25% 25%
% Improvement in DSI in a year 25% 40% 35% - - -
Additional Units in a year 36 57 50
Additional Units (Cumulative) 36 93 143 143 143 143
Calculation for DSI Reduction 2000 2001 2002 2003 2004 2005
Target DSI Reduction 12 12 12 12 12 12
Percentage Improvement 25% 40% 35% - - -
DSI Reduction 3 4.8 4.2
DSI Reduction (Cumulative) 3 7.8 12.0 12.0 12.0 12.0
Forecast W/ ERP System 2000 2001 2002 2003 2004 2005
Units (in thousands) ( 2,307) ( 2,364) ( 2,414) ( 2,414) ( 2,414) ( 2,414)
Revenue (in thousands) ( 485,632) ( 498,748) ( 509,302) ( 509,322) ( 509,322) ( 509,322)
COGS (In thousands) ( 425,515) ( 436,060) ( 445,286) ( 445,304) ( 445,304) ( 445,304)
Margin (in thousands) ( 60,117.25) ( 62,688.47) ( 64,015.93) ( 64,018.50) ( 64,018.50) ( 64,018.50)
Price per unit 210.53 210.99 210.99 210.99 210.99 210.99
didn't change COGS per unit 184.47 184.47 184.47 184.47 184.47 184.47
Margins per unit 26.06 26.52 26.52 26.52 26.52 26.52
Percentage margin 12.38% 12.57% 12.57% 12.57% 12.57% 12.57%
Days Sales' inventories 42 37 33 33 33 33
Inventory ( 48,963) ( 44,442) ( 40,259) ( 40,260) ( 40,260) ( 40,260)
DSI = (Inventory/COGS)/365
Price per unit = COGS per unit / (1 - % margin)
South Forecasts W/O the ERP system 2000 2001 2002 2003 2004 2005
Units (in thousands) 1,416 1,416 1,416 1,416
Revenue (in thousands) 283,549 283,549 283,549 283,549 283,549 283,549
COGS (In thousands) 237,308 237,308 237,308 237,308 237,308 237,308
Margin (in thousands) 46,241 46,241 46,241 46,241
Price per unit 200.25 200.25 200.25 200.25
COGS per unit 167.59 167.59 167.59 167.59
Margins per unit 32.66 32.66 32.66 32.66
Percentage margin 16.31% 16.31% 16.31% 16.31%
Days Sales' inventories 51 51 51 51 7.16
Inventory ($ 33,158) ($ 33,158) ($ 33,158) ($ 33,158)
DSI = (Inventory/COGS)/365 12102708 12102708 12102708 12102708
Inventory Dollar Amt ($ 33,158) ($ 33,158) ($ 33,158) ($ 33,158)
Impact of ERP System 2000 2001 2002 2003 2004 2005
Additional units (Cumulative) 13 28 38 38 38
Chng in margins (b/c more expensive) 0.10% 0.25% 0.25%
DSI Reduction (Cumulative) 4 9 12 days saved
Calculation for additional units 2000 2001 2002 2003 2004 2005
Pre-ERP Units 1,416 1,416 1,416 1,416
Pre-ERP Availability 83.1% 83.1% 83.1% 83.1%
Target Availability (Post ERP) 92% 92% 92% 92%
Improvement in Availability 10.7% 10.7% 10.7% 10.7%
Sales Increase (Improvement) 25% 25% 25% 25%
% Improvement in DSI in a year 35% 40% 25%
Additional Units in a year 13 15 9
Additional Units (Cumulative) 13 28 38
Calculation for DSI Reduction 2000 2001 2002 2003 2004 2005
Target DSI Reduction 12 12 12
Percentage Improvement 35% 40% 25%
DSI Reduction 4.2 4.8 3.0
DSI Reduction (Cumulative) 4.2 9.0 12.0
Forecast W/ ERP System 2000 2001 2002 2003 2004 2005
Units (in thousands) ( 1,416) ( 1,429) ( 1,444) ( 1,454)
Revenue (in thousands) ( 283,752) ( 286,549) ( 290,110) ( 292,013) ( 292,013) ( 292,013)
COGS (In thousands) ( 237,308) ( 239,532) ( 242,073) ( 243,662) ( 243,662) ( 243,662)
Margin (in thousands) ( 46,444.43) ( 47,016.72) ( 48,036.17) ( 48,351.39)
Price per unit 200.39 200.49 200.85 200.85
COGS per unit 167.59 167.59 167.59 167.59
Margins per unit 32.80 32.90 33.26 33.26
Percentage margin 16.37% 16.41% 16.56% 16.56%
Days Sales' inventories 51 47 42 39
Inventory ( 33,158) ( 30,713) ( 27,855) ( 26,035)
DSI = (Inventory/COGS)/365
Price per unit = COGS per unit / (1 - % margin)
Central Forecasts W/O the ERP system 2000 2001 2002 2003 2004 2005
Units (in thousands) 978 978 978 978 978 978
Revenue (in thousands) 185,625 185,625 185,625 185,625 185,625 185,625
COGS (In thousands) 141,947 141,947 141,947 141,947 141,947 141,947
Margin (in thousands) 43,678 43,678 43,678 43,678 43,678 43,678
Price per unit 189.80 189.80 189.80 189.80 189.80 189.80
COGS per unit 145.14 145.14 145.14 145.14 145.14 145.14
Margins per unit 44.66 44.66 44.66 44.66 44.66 44.66
Percentage margin 23.53% 23.53% 23.53% 23.53% 23.53% 23.53%
Days Sales' inventories 67 67 67 67 67 67 5.45
Inventory ($ 26,056) ($ 26,056) ($ 26,056) ($ 26,056) ($ 26,056) ($ 26,056)
DSI = (Inventory/COGS)/365 9510449 9510449 9510449 9510449 9510449 9510449
Inventory Dollar Amt ($ 26,056) ($ 26,056) ($ 26,056) ($ 26,056) ($ 26,056) ($ 26,056)
Impact of ERP System 2000 2001 2002 2003 2004 2005
Additional units (Cumulative) 0 0 19 39 48 48
Chng in margins (b/c more expensive) 0.13% 0.25% 0.25% 0.25%
DSI Reduction (Cumulative) 4.8 9.6 12.0 12 days saved
Calculation for additional units 2000 2001 2002 2003 2004 2005
Pre-ERP Units 978 978 978 978 978 978
Pre-ERP Availability 76.8% 76.8% 76.8% 76.8% 76.8% 76.8%
Target Availability (Post ERP) 92% 92% 92% 92% 92% 92%
Improvement in Availability 19.8% 19.8% 19.8% 19.8% 19.8% 19.8%
Sales Increase (Improvement) 25% 25% 25% 25% 25% 25%
% Improvement in DSI in a year 40% 40% 20%
Additional Units in a year 0 0 19 19 10 0
Additional Units (Cumulative) 0 0 19 39 48 48
Calculation for DSI Reduction 2000 2001 2002 2003 2004 2005
Target DSI Reduction 12 12 12 12 12 12
Percentage Improvement 40% 40% 20%
DSI Reduction 0 0.0 4.8 4.8 2.4
DSI Reduction (Cumulative) 0 0.0 4.8 9.6 12.0 12
Forecast W/ ERP System 2000 2001 2002 2003 2004 2005
Units (in thousands) ( 978) ( 978) ( 997) ( 1,017) ( 1,026) ( 1,026)
Revenue (in thousands) ( 185,771) ( 185,625) ( 189,621) ( 193,606) ( 195,449) ( 195,449)
COGS (In thousands) ( 141,947) ( 141,947) ( 144,756) ( 147,566) ( 148,970) ( 148,970)
Margin (in thousands) ( 43,823.76) ( 43,678.00) ( 44,864.82) ( 46,039.87) ( 46,478.12) ( 46,478.12)
Price per unit 189.95 189.80 190.12 190.42 190.42 190.42
COGS per unit 145.14 145.14 145.14 145.14 145.14 145.14
Margins per unit 44.81 44.66 44.98 45.28 45.28 45.28
Percentage margin 23.59% 23.53% 23.66% 23.78% 23.78% 23.78%
Days Sales' inventories 67 67 62 57 55 55
Inventory ( 26,056) ( 26,056) ( 24,668) ( 23,206) ( 22,448) ( 22,448)
DSI = (Inventory/COGS)/365
Price per unit = COGS per unit / (1 - % margin)
North Forecasts W/O the ERP system 2000 2001 2002 2003 2004 2005
Units (in thousands) 1,443 1,443 1,443 1,443 1,443 1,443
Revenue (in thousands) 280,901 280,901 280,901 280,901 280,901 280,901
COGS (In thousands) 251,083 251,083 251,083 251,083 251,083 251,083
Margin (in thousands) 29,818 29,818 29,818 29,818 29,818 29,818
Price per unit 194.66 194.66 194.66 194.66 194.66 194.66
COGS per unit 174.00 174.00 174.00 174.00 174.00 174.00
Margins per unit 20.66 20.66 20.66 20.66 20.66 20.66
Percentage margin 10.62% 10.62% 10.62% 10.62% 10.62% 10.62%
Days Sales' inventories 55 55 55 55 55 55 6.64
Inventory ($ 37,834) ($ 37,834) ($ 37,834) ($ 37,834) ($ 37,834) ($ 37,834)
DSI = (Inventory/COGS)/365 13809565 13809565 13809565 13809565 13809565 13809565
Inventory Dollar Amt ($ 37,834) ($ 37,834) ($ 37,834) ($ 37,834) ($ 37,834) ($ 37,834)
Impact of ERP System 2000 2001 2002 2003 2004 2005
Additional units (Cumulative) 0 0 0 15 31 38
Chng in margins (b/c more expensive) 0.13% 0.25% 0.25%
DSI Reduction (Cumulative) 0 0 0 5 10 12 days saved
Calculation for additional units 2000 2001 2002 2003 2004 2005
Pre-ERP Units 1,443 1,443 1,443 1,443 1,443 1,443
Pre-ERP Availability 83.2% 83.2% 83.2% 83.2% 83.2% 83.2%
Target Availability (Post ERP) 92% 92% 92% 92% 92% 92%
Improvement in Availability 10.6% 10.6% 10.6% 10.6% 10.6% 10.6%
Sales Increase (Improvement) 25% 25% 25% 25% 25% 25%
% Improvement in DSI in a year 40% 40% 20%
Additional Units in a year 0 0 0 15 15 8
Additional Units (Cumulative) 0 0 0 15 31 38
Calculation for DSI Reduction 2000 2001 2002 2003 2004 2005
Target DSI Reduction 12 12 12 12 12 12
Percentage Improvement 40% 40% 20%
DSI Reduction 0 0.0 0.0 5 4.8 2.4
DSI Reduction (Cumulative) 0 0.0 0.0 5 9.6 12.0
Forecast W/ ERP System 2000 2001 2002 2003 2004 2005
Units (in thousands) ( 1,443) ( 1,443) ( 1,443) ( 1,458) ( 1,474) ( 1,481)
Revenue (in thousands) ( 280,901) ( 280,901) ( 280,901) ( 284,286) ( 287,648) ( 289,137)
COGS (In thousands) ( 251,083) ( 251,083) ( 251,083) ( 253,739) ( 256,394) ( 257,722)
Margin (in thousands) ( 29,818.00) ( 29,818.00) ( 29,818.00) ( 30,546.84) ( 31,253.29) ( 31,415.14)
Price per unit 194.66 194.66 194.66 194.95 195.21 195.21
COGS per unit 174.00 174.00 174.00 174.00 174.00 174.00
Margins per unit 20.66 20.66 20.66 20.95 21.21 21.21
Percentage margin 10.62% 10.62% 10.62% 10.75% 10.87% 10.87%
Days Sales' inventories 55 55 55 50 45 43
Inventory ( 37,834) ( 37,834) ( 37,834) ( 34,898) ( 31,891) ( 30,362)
DSI = (Inventory/COGS)/365
Price per unit = COGS per unit / (1 - % margin)
Net Present Value of Cash Flows
Year 1999 2000 2001 2002 2003 2004 2005 2006 2007 Discount Rate 9%
(+)Depreciation 980 2760 4140 4960 4960 3980 2200 820
(-) CAPX 4900 8900 6900 4100
(+/-) Working Capital ($ 2,685) ( 6,967) ( 8,429) ( 6,218) ( 3,765) ( 1,529)
Operational Cash Flow -3817 -2,768 -1,530 152 2,820 3,781 4,673 6,631 7,478
Total ($ (8,717) ($ (8,003) ( 1,297) ( 8,621) ( 13,998) ( 12,506) ( 10,183) 8,831 8,298
NPV $22,752.59 In Thousands
Sensitivity Analysis
Discount rate 5% 6% 7% 8% 9% 10% 11% 12% 13% 14% 15% 16%
NPV $31,514.02 $29,071.34 $26,806.32 $24,704.45 $22,752.59 $20,938.74 $19,252.00 $17,682.44 $16,220.98 $14,859.34 $13,589.95 $12,405.88
Capital Expenditure and Depreciation
Year 1999 2000 2001 2002 2003 2004 2005 2006 2007
Capital Equipment 4300 8600 6900 4100
Software Licence 600 300
Capital Expenditure Total 4900 8900 6900 4100
Depreciation
West 980 980 980 980 980
South 1780 1780 1780 1780 1780
Central 1380 1380 1380 1380 1380
North 820 820 820 820 820
Total Depreciation 980 2760 4140 4960 4960 3980 2200 820
Operating Expenses/Savings
Year 1999 2000 2001 2002 2003 2004 2005 2006 2007
Additonal Employees 2250 2250 2250 2250
Consultants 3511 1663 1294 739
Ongoing Operational 600 1200 1800 2400 3000 3000 3000 3000 3000
License Maintaince 100 200 300 400 400 400
Compliance Task force 300 600 600 600 300
Total Costs 6361 5513 6144 6289 4000 3700 3400 3000 3000-Cost savings from
Reduction in Employees,
Warehouse. Returns -621 -1749 -2544 -3300 -3457 -3503 -3534 -3566
Total Operating Expenses 6361 4892 4395 3745 700 243 -103 -534 -566
Revenues of Additional Units
Year 1999 2000 2001 2002 2003 2004 2005 2006 2007
Additonal Units 36 106 191 235 260 268 289 289
Additional Revenue ( 7,848) ( 23,964) ( 42,074) ( 51,367) ( 56,572) ( 58,061) 63,197 63,197
COGS ( 6,590) ( 19,358) ( 33,936) ( 41,007) ( 45,068) ( 46,395) 50,480 50,480
Margin ( 1,258) ( 4,605) ( 8,138) ( 10,360) ( 11,504) ( 11,666) 12,717 12,717
Reduction in Inventory- WC ($ 2,685) ( 6,967) ( 8,429) ( 6,218) ( 3,765) ( 1,529)
Cash Flow of ERP Project
Year 1999 2000 2001 2002 2003 2004 2005 2006 2007
Revenue 0 ( 7,848) ( 23,964) ( 42,074) ( 51,367) ( 56,572) ( 58,061) 63,197 63,197
COGS 0 ( 6,590) ( 19,358) ( 33,936) ( 41,007) ( 45,068) ( 46,395) 50,480 50,480
Gross Margin 0 1,258 4,605 8,138 10,360 11,504 11,666 12,717 12,717
Operating Expenses 6361 4892 4395 3745 700 243 -103 -534 -566
Depreciation 0 980 2760 4140 4960 4960 3980 2200 820
EBIT -6361 -4,614 -2,550 253 4,700 6,301 7,789 11,051 12,463
Tax @ 40% -2544.4 -1846 -1020 101 1880 2520 3116 4420 4985
Cash Flow -3817 -2,768 -1,530 152 2,820 3,781 4,673 6,631 7,478
Whirlpool case

More Related Content

Similar to Whirlpool case

Presentation call3 t 2011 (english)
Presentation call3 t 2011 (english)Presentation call3 t 2011 (english)
Presentation call3 t 2011 (english)
ideiasnet
 
Presentation 3Q 2011 (english)
Presentation 3Q 2011 (english)Presentation 3Q 2011 (english)
Presentation 3Q 2011 (english)
ideiasnet
 
Erin Parker Atvidcf V1
Erin Parker Atvidcf V1Erin Parker Atvidcf V1
Erin Parker Atvidcf V1
Caneskid05
 
fr06_is-nongaap
fr06_is-nongaapfr06_is-nongaap
fr06_is-nongaap
finance44
 
goodrich Q403PresentationBW
goodrich  Q403PresentationBWgoodrich  Q403PresentationBW
goodrich Q403PresentationBW
finance44
 
Eli Lilly and Co Ratios - KeyEli Lilly and Co Ratios - Key Met.docx
Eli Lilly and Co  Ratios - KeyEli Lilly and Co  Ratios - Key Met.docxEli Lilly and Co  Ratios - KeyEli Lilly and Co  Ratios - Key Met.docx
Eli Lilly and Co Ratios - KeyEli Lilly and Co Ratios - Key Met.docx
christinemaritza
 

Similar to Whirlpool case (20)

Hansson
HanssonHansson
Hansson
 
Wassim Zhani Kroger Value.pdf
Wassim Zhani Kroger Value.pdfWassim Zhani Kroger Value.pdf
Wassim Zhani Kroger Value.pdf
 
Spdr debunking-5-common-gold-misconceptions
Spdr debunking-5-common-gold-misconceptionsSpdr debunking-5-common-gold-misconceptions
Spdr debunking-5-common-gold-misconceptions
 
Presentation call3 t 2011 (english)
Presentation call3 t 2011 (english)Presentation call3 t 2011 (english)
Presentation call3 t 2011 (english)
 
Presentation 3Q 2011 (english)
Presentation 3Q 2011 (english)Presentation 3Q 2011 (english)
Presentation 3Q 2011 (english)
 
itw_050127
itw_050127itw_050127
itw_050127
 
FP_Examples.pptx
FP_Examples.pptxFP_Examples.pptx
FP_Examples.pptx
 
CPG-Financial-Model-and-Valuation-v2.pdf
CPG-Financial-Model-and-Valuation-v2.pdfCPG-Financial-Model-and-Valuation-v2.pdf
CPG-Financial-Model-and-Valuation-v2.pdf
 
Erin Parker Atvidcf V1
Erin Parker Atvidcf V1Erin Parker Atvidcf V1
Erin Parker Atvidcf V1
 
Modernizing Finance
Modernizing FinanceModernizing Finance
Modernizing Finance
 
fr06_is-nongaap
fr06_is-nongaapfr06_is-nongaap
fr06_is-nongaap
 
Monsanto company
Monsanto companyMonsanto company
Monsanto company
 
Release 3Q01
Release 3Q01Release 3Q01
Release 3Q01
 
$ANF Valuation Model
$ANF Valuation Model$ANF Valuation Model
$ANF Valuation Model
 
goodrich Q403PresentationBW
goodrich  Q403PresentationBWgoodrich  Q403PresentationBW
goodrich Q403PresentationBW
 
Eli Lilly and Co Ratios - KeyEli Lilly and Co Ratios - Key Met.docx
Eli Lilly and Co  Ratios - KeyEli Lilly and Co  Ratios - Key Met.docxEli Lilly and Co  Ratios - KeyEli Lilly and Co  Ratios - Key Met.docx
Eli Lilly and Co Ratios - KeyEli Lilly and Co Ratios - Key Met.docx
 
Digital realty 3 q17 earnings presentation final
Digital realty 3 q17 earnings presentation finalDigital realty 3 q17 earnings presentation final
Digital realty 3 q17 earnings presentation final
 
2Q14 Results Presentation
2Q14 Results Presentation2Q14 Results Presentation
2Q14 Results Presentation
 
Silver river manufacturing company
Silver river manufacturing companySilver river manufacturing company
Silver river manufacturing company
 
Investor Presentation - Quanta Services, Inc.
Investor Presentation - Quanta Services, Inc.Investor Presentation - Quanta Services, Inc.
Investor Presentation - Quanta Services, Inc.
 

Recently uploaded

Obat Aborsi Surabaya 0851\7696\3835 Jual Obat Cytotec Di Surabaya
Obat Aborsi Surabaya 0851\7696\3835 Jual Obat Cytotec Di SurabayaObat Aborsi Surabaya 0851\7696\3835 Jual Obat Cytotec Di Surabaya
Obat Aborsi Surabaya 0851\7696\3835 Jual Obat Cytotec Di Surabaya
Obat Aborsi Jakarta Wa 085176963835 Apotek Jual Obat Cytotec Di Jakarta
 
What is paper chromatography, principal, procedure,types, diagram, advantages...
What is paper chromatography, principal, procedure,types, diagram, advantages...What is paper chromatography, principal, procedure,types, diagram, advantages...
What is paper chromatography, principal, procedure,types, diagram, advantages...
srcw2322l101
 
00971508021841 حبوب الإجهاض في دبي | أبوظبي | الشارقة | السطوة |❇ ❈ ((![© ر
00971508021841 حبوب الإجهاض في دبي | أبوظبي | الشارقة | السطوة |❇ ❈ ((![©  ر00971508021841 حبوب الإجهاض في دبي | أبوظبي | الشارقة | السطوة |❇ ❈ ((![©  ر
00971508021841 حبوب الإجهاض في دبي | أبوظبي | الشارقة | السطوة |❇ ❈ ((![© ر
nafizanafzal
 
Shots fired Budget Presentation.pdf12312
Shots fired Budget Presentation.pdf12312Shots fired Budget Presentation.pdf12312
Shots fired Budget Presentation.pdf12312
LR1709MUSIC
 
#Mtp-Kit Prices » Qatar. Doha (+27737758557) Abortion Pills For Sale In Doha,...
#Mtp-Kit Prices » Qatar. Doha (+27737758557) Abortion Pills For Sale In Doha,...#Mtp-Kit Prices » Qatar. Doha (+27737758557) Abortion Pills For Sale In Doha,...
#Mtp-Kit Prices » Qatar. Doha (+27737758557) Abortion Pills For Sale In Doha,...
drm1699
 
Abortion pills in Muscut<Oman(+27737758557) Cytotec available.inn Kuwait City.
Abortion pills in Muscut<Oman(+27737758557) Cytotec available.inn Kuwait City.Abortion pills in Muscut<Oman(+27737758557) Cytotec available.inn Kuwait City.
Abortion pills in Muscut<Oman(+27737758557) Cytotec available.inn Kuwait City.
daisycvs
 
Powerpoint showing results from tik tok metrics
Powerpoint showing results from tik tok metricsPowerpoint showing results from tik tok metrics
Powerpoint showing results from tik tok metrics
CaitlinCummins3
 
Presentation4 (2) survey responses clearly labelled
Presentation4 (2) survey responses clearly labelledPresentation4 (2) survey responses clearly labelled
Presentation4 (2) survey responses clearly labelled
CaitlinCummins3
 

Recently uploaded (20)

Obat Aborsi Surabaya 0851\7696\3835 Jual Obat Cytotec Di Surabaya
Obat Aborsi Surabaya 0851\7696\3835 Jual Obat Cytotec Di SurabayaObat Aborsi Surabaya 0851\7696\3835 Jual Obat Cytotec Di Surabaya
Obat Aborsi Surabaya 0851\7696\3835 Jual Obat Cytotec Di Surabaya
 
What is paper chromatography, principal, procedure,types, diagram, advantages...
What is paper chromatography, principal, procedure,types, diagram, advantages...What is paper chromatography, principal, procedure,types, diagram, advantages...
What is paper chromatography, principal, procedure,types, diagram, advantages...
 
Top^Clinic ^%[+27785538335__Safe*Women's clinic//Abortion Pills In Harare
Top^Clinic ^%[+27785538335__Safe*Women's clinic//Abortion Pills In HarareTop^Clinic ^%[+27785538335__Safe*Women's clinic//Abortion Pills In Harare
Top^Clinic ^%[+27785538335__Safe*Women's clinic//Abortion Pills In Harare
 
Innomantra Viewpoint - Building Moonshots : May-Jun 2024.pdf
Innomantra Viewpoint - Building Moonshots : May-Jun 2024.pdfInnomantra Viewpoint - Building Moonshots : May-Jun 2024.pdf
Innomantra Viewpoint - Building Moonshots : May-Jun 2024.pdf
 
Should Law Firms Outsource their Bookkeeping
Should Law Firms Outsource their BookkeepingShould Law Firms Outsource their Bookkeeping
Should Law Firms Outsource their Bookkeeping
 
Toyota Kata Coaching for Agile Teams & Transformations
Toyota Kata Coaching for Agile Teams & TransformationsToyota Kata Coaching for Agile Teams & Transformations
Toyota Kata Coaching for Agile Teams & Transformations
 
00971508021841 حبوب الإجهاض في دبي | أبوظبي | الشارقة | السطوة |❇ ❈ ((![© ر
00971508021841 حبوب الإجهاض في دبي | أبوظبي | الشارقة | السطوة |❇ ❈ ((![©  ر00971508021841 حبوب الإجهاض في دبي | أبوظبي | الشارقة | السطوة |❇ ❈ ((![©  ر
00971508021841 حبوب الإجهاض في دبي | أبوظبي | الشارقة | السطوة |❇ ❈ ((![© ر
 
Pitch Deck Teardown: Goodcarbon's $5.5m Seed deck
Pitch Deck Teardown: Goodcarbon's $5.5m Seed deckPitch Deck Teardown: Goodcarbon's $5.5m Seed deck
Pitch Deck Teardown: Goodcarbon's $5.5m Seed deck
 
What are the differences between an international company, a global company, ...
What are the differences between an international company, a global company, ...What are the differences between an international company, a global company, ...
What are the differences between an international company, a global company, ...
 
Shots fired Budget Presentation.pdf12312
Shots fired Budget Presentation.pdf12312Shots fired Budget Presentation.pdf12312
Shots fired Budget Presentation.pdf12312
 
#Mtp-Kit Prices » Qatar. Doha (+27737758557) Abortion Pills For Sale In Doha,...
#Mtp-Kit Prices » Qatar. Doha (+27737758557) Abortion Pills For Sale In Doha,...#Mtp-Kit Prices » Qatar. Doha (+27737758557) Abortion Pills For Sale In Doha,...
#Mtp-Kit Prices » Qatar. Doha (+27737758557) Abortion Pills For Sale In Doha,...
 
Abortion pills in Muscut<Oman(+27737758557) Cytotec available.inn Kuwait City.
Abortion pills in Muscut<Oman(+27737758557) Cytotec available.inn Kuwait City.Abortion pills in Muscut<Oman(+27737758557) Cytotec available.inn Kuwait City.
Abortion pills in Muscut<Oman(+27737758557) Cytotec available.inn Kuwait City.
 
10 Easiest Ways To Buy Verified TransferWise Accounts
10 Easiest Ways To Buy Verified TransferWise Accounts10 Easiest Ways To Buy Verified TransferWise Accounts
10 Easiest Ways To Buy Verified TransferWise Accounts
 
Powerpoint showing results from tik tok metrics
Powerpoint showing results from tik tok metricsPowerpoint showing results from tik tok metrics
Powerpoint showing results from tik tok metrics
 
hyundai capital 2023 consolidated financial statements
hyundai capital 2023 consolidated financial statementshyundai capital 2023 consolidated financial statements
hyundai capital 2023 consolidated financial statements
 
WAM Corporate Presentation May 2024_w.pdf
WAM Corporate Presentation May 2024_w.pdfWAM Corporate Presentation May 2024_w.pdf
WAM Corporate Presentation May 2024_w.pdf
 
Sex service available my WhatsApp number 7374088497
Sex service available my WhatsApp number 7374088497Sex service available my WhatsApp number 7374088497
Sex service available my WhatsApp number 7374088497
 
HAL Financial Performance Analysis and Future Prospects
HAL Financial Performance Analysis and Future ProspectsHAL Financial Performance Analysis and Future Prospects
HAL Financial Performance Analysis and Future Prospects
 
Presentation4 (2) survey responses clearly labelled
Presentation4 (2) survey responses clearly labelledPresentation4 (2) survey responses clearly labelled
Presentation4 (2) survey responses clearly labelled
 
Goal Presentation_NEW EMPLOYEE_NETAPS FOUNDATION.pptx
Goal Presentation_NEW EMPLOYEE_NETAPS FOUNDATION.pptxGoal Presentation_NEW EMPLOYEE_NETAPS FOUNDATION.pptx
Goal Presentation_NEW EMPLOYEE_NETAPS FOUNDATION.pptx
 

Whirlpool case

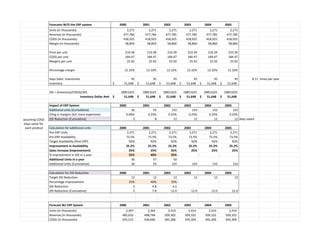
  • 1. Forecasts W/O the ERP system 2000 2001 2002 2003 2004 2005 Units (in thousands) 2,271 2,271 2,271 2,271 2,271 2,271 Revenue (in thousands) 477,784 477,784 477,785 477,785 477,785 477,785 COGS (In thousands) 418,925 418,925 418,925 418,925 418,925 418,925 Margin (in thousands) 58,859 58,859 58,860 58,860 58,860 58,860 Price per unit 210.38 210.38 210.39 210.39 210.39 210.39 COGS per unit 184.47 184.47 184.47 184.47 184.47 184.47 Margins per unit 25.92 25.92 25.92 25.92 25.92 25.92 Percentage margin 12.32% 12.32% 12.32% 12.32% 12.32% 12.32% Days Sales' inventories 45 45 45 45 45 45 8.11 times per year Inventory ($ 51,648) ($ 51,648) ($ 51,648) ($ 51,648) ($ 51,648) ($ 51,648) DSI = (Inventory/COGS)/365 18851625 18851625 18851625 18851625 18851625 18851625 Inventory Dollar Amt ($ 51,648) ($ 51,648) ($ 51,648) ($ 51,648) ($ 51,648) ($ 51,648) Impact of ERP System 2000 2001 2002 2003 2004 2005 Additional units (Cumulative) 36 93 143 143 143 143 assuming COGS stays same for each prodcut Chng in margins (b/c more expensive) 0.06% 0.25% 0.25% 0.25% 0.25% 0.25% DSI Reduction (Cumulative) 3 8 12 12 12 12 days saved Calculation for additional units 2000 2001 2002 2003 2004 2005 Pre-ERP Units 2,271 2,271 2,271 2,271 2,271 2,271 Pre-ERP Availability 73.5% 73.5% 73.5% 73.5% 73.5% 73.5% Target Availability (Post ERP) 92% 92% 92% 92% 92% 92% Improvement in Availability 25.2% 25.2% 25.2% 25.2% 25.2% 25.2% Sales Increase (Improvement) 25% 25% 25% 25% 25% 25% % Improvement in DSI in a year 25% 40% 35% - - - Additional Units in a year 36 57 50 Additional Units (Cumulative) 36 93 143 143 143 143 Calculation for DSI Reduction 2000 2001 2002 2003 2004 2005 Target DSI Reduction 12 12 12 12 12 12 Percentage Improvement 25% 40% 35% - - - DSI Reduction 3 4.8 4.2 DSI Reduction (Cumulative) 3 7.8 12.0 12.0 12.0 12.0 Forecast W/ ERP System 2000 2001 2002 2003 2004 2005 Units (in thousands) ( 2,307) ( 2,364) ( 2,414) ( 2,414) ( 2,414) ( 2,414) Revenue (in thousands) ( 485,632) ( 498,748) ( 509,302) ( 509,322) ( 509,322) ( 509,322) COGS (In thousands) ( 425,515) ( 436,060) ( 445,286) ( 445,304) ( 445,304) ( 445,304)
  • 2. Margin (in thousands) ( 60,117.25) ( 62,688.47) ( 64,015.93) ( 64,018.50) ( 64,018.50) ( 64,018.50) Price per unit 210.53 210.99 210.99 210.99 210.99 210.99 didn't change COGS per unit 184.47 184.47 184.47 184.47 184.47 184.47 Margins per unit 26.06 26.52 26.52 26.52 26.52 26.52 Percentage margin 12.38% 12.57% 12.57% 12.57% 12.57% 12.57% Days Sales' inventories 42 37 33 33 33 33 Inventory ( 48,963) ( 44,442) ( 40,259) ( 40,260) ( 40,260) ( 40,260) DSI = (Inventory/COGS)/365 Price per unit = COGS per unit / (1 - % margin)
  • 3. South Forecasts W/O the ERP system 2000 2001 2002 2003 2004 2005 Units (in thousands) 1,416 1,416 1,416 1,416 Revenue (in thousands) 283,549 283,549 283,549 283,549 283,549 283,549 COGS (In thousands) 237,308 237,308 237,308 237,308 237,308 237,308 Margin (in thousands) 46,241 46,241 46,241 46,241 Price per unit 200.25 200.25 200.25 200.25 COGS per unit 167.59 167.59 167.59 167.59 Margins per unit 32.66 32.66 32.66 32.66 Percentage margin 16.31% 16.31% 16.31% 16.31% Days Sales' inventories 51 51 51 51 7.16 Inventory ($ 33,158) ($ 33,158) ($ 33,158) ($ 33,158) DSI = (Inventory/COGS)/365 12102708 12102708 12102708 12102708 Inventory Dollar Amt ($ 33,158) ($ 33,158) ($ 33,158) ($ 33,158) Impact of ERP System 2000 2001 2002 2003 2004 2005 Additional units (Cumulative) 13 28 38 38 38 Chng in margins (b/c more expensive) 0.10% 0.25% 0.25% DSI Reduction (Cumulative) 4 9 12 days saved Calculation for additional units 2000 2001 2002 2003 2004 2005 Pre-ERP Units 1,416 1,416 1,416 1,416 Pre-ERP Availability 83.1% 83.1% 83.1% 83.1% Target Availability (Post ERP) 92% 92% 92% 92% Improvement in Availability 10.7% 10.7% 10.7% 10.7% Sales Increase (Improvement) 25% 25% 25% 25% % Improvement in DSI in a year 35% 40% 25% Additional Units in a year 13 15 9 Additional Units (Cumulative) 13 28 38 Calculation for DSI Reduction 2000 2001 2002 2003 2004 2005 Target DSI Reduction 12 12 12 Percentage Improvement 35% 40% 25%
  • 4. DSI Reduction 4.2 4.8 3.0 DSI Reduction (Cumulative) 4.2 9.0 12.0 Forecast W/ ERP System 2000 2001 2002 2003 2004 2005 Units (in thousands) ( 1,416) ( 1,429) ( 1,444) ( 1,454) Revenue (in thousands) ( 283,752) ( 286,549) ( 290,110) ( 292,013) ( 292,013) ( 292,013) COGS (In thousands) ( 237,308) ( 239,532) ( 242,073) ( 243,662) ( 243,662) ( 243,662) Margin (in thousands) ( 46,444.43) ( 47,016.72) ( 48,036.17) ( 48,351.39) Price per unit 200.39 200.49 200.85 200.85 COGS per unit 167.59 167.59 167.59 167.59 Margins per unit 32.80 32.90 33.26 33.26 Percentage margin 16.37% 16.41% 16.56% 16.56% Days Sales' inventories 51 47 42 39 Inventory ( 33,158) ( 30,713) ( 27,855) ( 26,035) DSI = (Inventory/COGS)/365 Price per unit = COGS per unit / (1 - % margin)
  • 5. Central Forecasts W/O the ERP system 2000 2001 2002 2003 2004 2005 Units (in thousands) 978 978 978 978 978 978 Revenue (in thousands) 185,625 185,625 185,625 185,625 185,625 185,625 COGS (In thousands) 141,947 141,947 141,947 141,947 141,947 141,947 Margin (in thousands) 43,678 43,678 43,678 43,678 43,678 43,678 Price per unit 189.80 189.80 189.80 189.80 189.80 189.80 COGS per unit 145.14 145.14 145.14 145.14 145.14 145.14 Margins per unit 44.66 44.66 44.66 44.66 44.66 44.66 Percentage margin 23.53% 23.53% 23.53% 23.53% 23.53% 23.53% Days Sales' inventories 67 67 67 67 67 67 5.45 Inventory ($ 26,056) ($ 26,056) ($ 26,056) ($ 26,056) ($ 26,056) ($ 26,056) DSI = (Inventory/COGS)/365 9510449 9510449 9510449 9510449 9510449 9510449 Inventory Dollar Amt ($ 26,056) ($ 26,056) ($ 26,056) ($ 26,056) ($ 26,056) ($ 26,056) Impact of ERP System 2000 2001 2002 2003 2004 2005 Additional units (Cumulative) 0 0 19 39 48 48 Chng in margins (b/c more expensive) 0.13% 0.25% 0.25% 0.25% DSI Reduction (Cumulative) 4.8 9.6 12.0 12 days saved Calculation for additional units 2000 2001 2002 2003 2004 2005 Pre-ERP Units 978 978 978 978 978 978 Pre-ERP Availability 76.8% 76.8% 76.8% 76.8% 76.8% 76.8% Target Availability (Post ERP) 92% 92% 92% 92% 92% 92% Improvement in Availability 19.8% 19.8% 19.8% 19.8% 19.8% 19.8% Sales Increase (Improvement) 25% 25% 25% 25% 25% 25% % Improvement in DSI in a year 40% 40% 20% Additional Units in a year 0 0 19 19 10 0 Additional Units (Cumulative) 0 0 19 39 48 48 Calculation for DSI Reduction 2000 2001 2002 2003 2004 2005 Target DSI Reduction 12 12 12 12 12 12 Percentage Improvement 40% 40% 20%
  • 6. DSI Reduction 0 0.0 4.8 4.8 2.4 DSI Reduction (Cumulative) 0 0.0 4.8 9.6 12.0 12 Forecast W/ ERP System 2000 2001 2002 2003 2004 2005 Units (in thousands) ( 978) ( 978) ( 997) ( 1,017) ( 1,026) ( 1,026) Revenue (in thousands) ( 185,771) ( 185,625) ( 189,621) ( 193,606) ( 195,449) ( 195,449) COGS (In thousands) ( 141,947) ( 141,947) ( 144,756) ( 147,566) ( 148,970) ( 148,970) Margin (in thousands) ( 43,823.76) ( 43,678.00) ( 44,864.82) ( 46,039.87) ( 46,478.12) ( 46,478.12) Price per unit 189.95 189.80 190.12 190.42 190.42 190.42 COGS per unit 145.14 145.14 145.14 145.14 145.14 145.14 Margins per unit 44.81 44.66 44.98 45.28 45.28 45.28 Percentage margin 23.59% 23.53% 23.66% 23.78% 23.78% 23.78% Days Sales' inventories 67 67 62 57 55 55 Inventory ( 26,056) ( 26,056) ( 24,668) ( 23,206) ( 22,448) ( 22,448) DSI = (Inventory/COGS)/365 Price per unit = COGS per unit / (1 - % margin)
  • 7. North Forecasts W/O the ERP system 2000 2001 2002 2003 2004 2005 Units (in thousands) 1,443 1,443 1,443 1,443 1,443 1,443 Revenue (in thousands) 280,901 280,901 280,901 280,901 280,901 280,901 COGS (In thousands) 251,083 251,083 251,083 251,083 251,083 251,083 Margin (in thousands) 29,818 29,818 29,818 29,818 29,818 29,818 Price per unit 194.66 194.66 194.66 194.66 194.66 194.66 COGS per unit 174.00 174.00 174.00 174.00 174.00 174.00 Margins per unit 20.66 20.66 20.66 20.66 20.66 20.66 Percentage margin 10.62% 10.62% 10.62% 10.62% 10.62% 10.62% Days Sales' inventories 55 55 55 55 55 55 6.64 Inventory ($ 37,834) ($ 37,834) ($ 37,834) ($ 37,834) ($ 37,834) ($ 37,834) DSI = (Inventory/COGS)/365 13809565 13809565 13809565 13809565 13809565 13809565 Inventory Dollar Amt ($ 37,834) ($ 37,834) ($ 37,834) ($ 37,834) ($ 37,834) ($ 37,834) Impact of ERP System 2000 2001 2002 2003 2004 2005 Additional units (Cumulative) 0 0 0 15 31 38 Chng in margins (b/c more expensive) 0.13% 0.25% 0.25% DSI Reduction (Cumulative) 0 0 0 5 10 12 days saved Calculation for additional units 2000 2001 2002 2003 2004 2005 Pre-ERP Units 1,443 1,443 1,443 1,443 1,443 1,443 Pre-ERP Availability 83.2% 83.2% 83.2% 83.2% 83.2% 83.2% Target Availability (Post ERP) 92% 92% 92% 92% 92% 92% Improvement in Availability 10.6% 10.6% 10.6% 10.6% 10.6% 10.6% Sales Increase (Improvement) 25% 25% 25% 25% 25% 25% % Improvement in DSI in a year 40% 40% 20% Additional Units in a year 0 0 0 15 15 8 Additional Units (Cumulative) 0 0 0 15 31 38 Calculation for DSI Reduction 2000 2001 2002 2003 2004 2005 Target DSI Reduction 12 12 12 12 12 12 Percentage Improvement 40% 40% 20% DSI Reduction 0 0.0 0.0 5 4.8 2.4 DSI Reduction (Cumulative) 0 0.0 0.0 5 9.6 12.0
  • 8. Forecast W/ ERP System 2000 2001 2002 2003 2004 2005 Units (in thousands) ( 1,443) ( 1,443) ( 1,443) ( 1,458) ( 1,474) ( 1,481) Revenue (in thousands) ( 280,901) ( 280,901) ( 280,901) ( 284,286) ( 287,648) ( 289,137) COGS (In thousands) ( 251,083) ( 251,083) ( 251,083) ( 253,739) ( 256,394) ( 257,722) Margin (in thousands) ( 29,818.00) ( 29,818.00) ( 29,818.00) ( 30,546.84) ( 31,253.29) ( 31,415.14) Price per unit 194.66 194.66 194.66 194.95 195.21 195.21 COGS per unit 174.00 174.00 174.00 174.00 174.00 174.00 Margins per unit 20.66 20.66 20.66 20.95 21.21 21.21 Percentage margin 10.62% 10.62% 10.62% 10.75% 10.87% 10.87% Days Sales' inventories 55 55 55 50 45 43 Inventory ( 37,834) ( 37,834) ( 37,834) ( 34,898) ( 31,891) ( 30,362) DSI = (Inventory/COGS)/365 Price per unit = COGS per unit / (1 - % margin)
  • 9. Net Present Value of Cash Flows Year 1999 2000 2001 2002 2003 2004 2005 2006 2007 Discount Rate 9% (+)Depreciation 980 2760 4140 4960 4960 3980 2200 820 (-) CAPX 4900 8900 6900 4100 (+/-) Working Capital ($ 2,685) ( 6,967) ( 8,429) ( 6,218) ( 3,765) ( 1,529) Operational Cash Flow -3817 -2,768 -1,530 152 2,820 3,781 4,673 6,631 7,478 Total ($ (8,717) ($ (8,003) ( 1,297) ( 8,621) ( 13,998) ( 12,506) ( 10,183) 8,831 8,298 NPV $22,752.59 In Thousands Sensitivity Analysis Discount rate 5% 6% 7% 8% 9% 10% 11% 12% 13% 14% 15% 16% NPV $31,514.02 $29,071.34 $26,806.32 $24,704.45 $22,752.59 $20,938.74 $19,252.00 $17,682.44 $16,220.98 $14,859.34 $13,589.95 $12,405.88 Capital Expenditure and Depreciation Year 1999 2000 2001 2002 2003 2004 2005 2006 2007 Capital Equipment 4300 8600 6900 4100 Software Licence 600 300 Capital Expenditure Total 4900 8900 6900 4100 Depreciation West 980 980 980 980 980 South 1780 1780 1780 1780 1780 Central 1380 1380 1380 1380 1380 North 820 820 820 820 820 Total Depreciation 980 2760 4140 4960 4960 3980 2200 820 Operating Expenses/Savings Year 1999 2000 2001 2002 2003 2004 2005 2006 2007 Additonal Employees 2250 2250 2250 2250 Consultants 3511 1663 1294 739 Ongoing Operational 600 1200 1800 2400 3000 3000 3000 3000 3000 License Maintaince 100 200 300 400 400 400 Compliance Task force 300 600 600 600 300 Total Costs 6361 5513 6144 6289 4000 3700 3400 3000 3000-Cost savings from Reduction in Employees, Warehouse. Returns -621 -1749 -2544 -3300 -3457 -3503 -3534 -3566 Total Operating Expenses 6361 4892 4395 3745 700 243 -103 -534 -566 Revenues of Additional Units Year 1999 2000 2001 2002 2003 2004 2005 2006 2007 Additonal Units 36 106 191 235 260 268 289 289 Additional Revenue ( 7,848) ( 23,964) ( 42,074) ( 51,367) ( 56,572) ( 58,061) 63,197 63,197 COGS ( 6,590) ( 19,358) ( 33,936) ( 41,007) ( 45,068) ( 46,395) 50,480 50,480
  • 10. Margin ( 1,258) ( 4,605) ( 8,138) ( 10,360) ( 11,504) ( 11,666) 12,717 12,717 Reduction in Inventory- WC ($ 2,685) ( 6,967) ( 8,429) ( 6,218) ( 3,765) ( 1,529) Cash Flow of ERP Project Year 1999 2000 2001 2002 2003 2004 2005 2006 2007 Revenue 0 ( 7,848) ( 23,964) ( 42,074) ( 51,367) ( 56,572) ( 58,061) 63,197 63,197 COGS 0 ( 6,590) ( 19,358) ( 33,936) ( 41,007) ( 45,068) ( 46,395) 50,480 50,480 Gross Margin 0 1,258 4,605 8,138 10,360 11,504 11,666 12,717 12,717 Operating Expenses 6361 4892 4395 3745 700 243 -103 -534 -566 Depreciation 0 980 2760 4140 4960 4960 3980 2200 820 EBIT -6361 -4,614 -2,550 253 4,700 6,301 7,789 11,051 12,463 Tax @ 40% -2544.4 -1846 -1020 101 1880 2520 3116 4420 4985 Cash Flow -3817 -2,768 -1,530 152 2,820 3,781 4,673 6,631 7,478