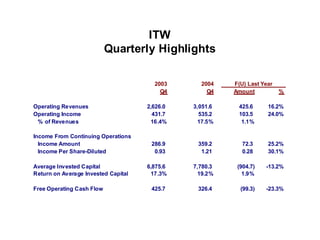
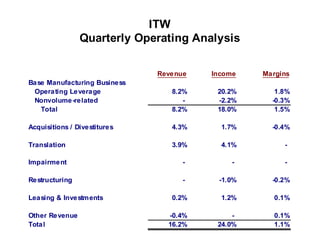
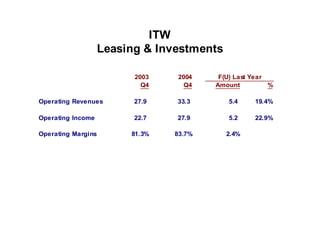
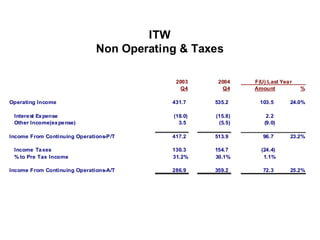
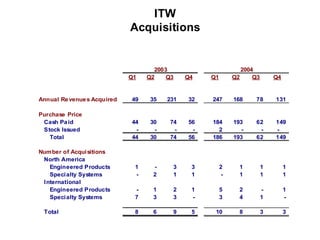
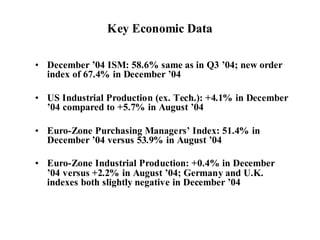
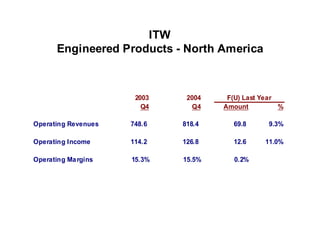
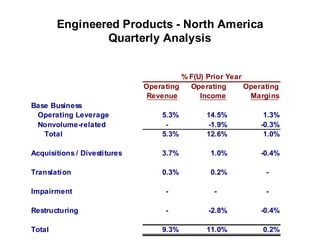
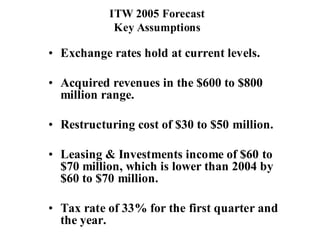
This document summarizes ITW's fourth quarter 2004 conference call. It includes an agenda for the call, forward-looking statements, highlights and analysis of financial results, segment results for engineered products in North America and internationally, and key economic data. John Brooklier and Jon Kinney will provide introductions, a financial overview, and forecast for 2005. They will also take questions from attendees.
This document provides an agenda and financial overview from an ITW conference call for the third quarter of 2004. Key highlights include a 17.2% increase in operating revenues and 20% increase in operating income compared to the same period in 2003. Segment performances are discussed for engineered products in North America and internationally, with revenue growth noted in construction and industrial end markets. Forecasts for 2004 indicate continued growth.
The document provides details from ITW's third quarter 2003 conference call. It includes an agenda for the call, forward-looking statements, and quarterly highlights and analysis for ITW's revenue, income, margins, invested capital, cash flow, return on invested capital, acquisitions, and performance of its manufacturing segments. Key points indicate stable or modest growth expected in construction and declines in automotive production for North America and Europe.
This document provides an agenda and summaries from ITW's second quarter 2005 conference call. The call covered ITW's financial performance, operating results by manufacturing segment, 2005 forecasts, and Q&A. Key highlights included 9.8% revenue growth and a 1.5% decline in operating margins from the prior year. Revenue growth was driven by acquisitions, translation effects, and base business operating leverage, while restructuring costs and the leasing business decline impacted profits.
The document provides details from ITW's third quarter 2006 conference call. It includes an agenda for the call, forward-looking statements, and quarterly highlights and analysis of ITW's financial performance, operating segments, forecasts, invested capital, debt and equity, cash flow, return on capital, and acquisitions. Key details include 10.6% revenue growth and 10.9% operating income growth compared to Q3 2005.
The document summarizes ITW's first quarter 2005 conference call. It includes an agenda for the call, forward-looking statements, highlights of financial results and forecasts, summaries of performance by business segment, and key economic indicators. John Brooklier will provide an introduction and discuss manufacturing segments. Ron Kropp will discuss financial results, and Jon Kinney will discuss the 2005 forecast, followed by a Q&A session.
The document provides details from ITW's fourth quarter 2003 conference call, including:
1. An agenda for the call covering introductions, financial overview, manufacturing segments, 2004 forecast, and Q&A.
2. Forward-looking statements noting risks that could impact results.
3. Financial and operating highlights for ITW in Q4 2003 vs Q4 2002 showing increases in revenues, income, margins, capital returns, and cash flow.
4. Segment analyses for engineered products in North America and internationally, and for specialty systems in North America, including revenue, income and margin details.
This document provides an agenda and summaries from ITW's third quarter 2005 conference call. It includes sections on financial performance, segment results, forecasts, and economic indicators. Some key highlights include 9.8% revenue growth and 20.9% operating income growth for ITW overall in Q3 2005 compared to Q3 2004. The engineered products segments in North America and internationally grew revenues by 10.3% and 5.2% respectively. The document also outlines ITW's acquisition activity and investment in capital expenditures.
- The document provides details from ITW's second quarter 2006 conference call, including financial results, segment performances, forecasts, and economic indicators.
- Key highlights include 8.9% revenue growth and 17.8% operating income growth in Q2 2006 compared to Q2 2005. Engineered Products - North America saw 13.4% revenue growth while Engineered Products - International grew 3.9%.
- Economic indicators showed narrowing gaps between stronger North America and weaker international end markets, with signs of improvement in Europe. Construction and auto were mixed while industrial grew strongly.
This document provides an agenda and summaries from ITW's fourth quarter 2005 conference call. The call covered ITW's financial performance, operating results by manufacturing segment, 2006 forecasts, and Q&A. Key highlights included 8% revenue growth and 11.2% operating income growth in Q4 2005 compared to 2004. Operating margins increased 0.6% to 18.1%. The document also summarized performance and forecasts for various ITW segments such as Engineered Products in North America and internationally.
The document summarizes ITW's first quarter 2006 conference call. It includes sections on financial highlights, operating analysis by segment, forecasts, and Q&A. Key highlights include 8% revenue growth and 18% operating income growth. Manufacturing segments saw 6.1% base revenue growth and 18.4% operating income growth. The conference call agenda included introductions, financial overview, segment reviews, 2006 forecast, and Q&A.
This document provides an agenda and financial overview for ITW's second quarter 2004 conference call. The agenda includes introductions, financial and segment overviews, 2004 forecasts, and a Q&A session. Financial highlights show increases in revenues, operating income, income from continuing operations, and free operating cash flow compared to the second quarter of 2003. Segment analyses provide details on performance and key factors for engineered products in North America and internationally.
This document provides an agenda and financial overview for ITW's Q2 2003 conference call. Key points include:
- Revenue increased 5.3% to $2.56B in Q2 2003 compared to Q2 2002. Operating income rose 5.9% and margins were flat.
- Engineered Products North America saw a 3% revenue decline and 14.2% operating income decline due to weakness in construction and auto.
- Engineered Products International had 20.1% revenue growth and 16.2% operating income growth driven by acquisitions and foreign exchange.
- Specialty Systems North America reported a 4.5% revenue decline but a 4.1% increase in operating income
Nordnet reported increased operating income and profit after tax for 2010 compared to 2009. However, earnings per share were down slightly. For 2011, Nordnet plans cost reductions of 15% to secure goals and visions in light of decreased market activity. Measures include reducing consultants, marketing investments, and potentially reducing staff. Nordnet also reported highlights for 2010 such as successful integrations and new products, and goals to double revenues by 2013 while maintaining operating margins.
This document provides quarterly financial highlights for Nationwide Financial Services for Q1 2008. Key points include:
- Total revenues for Q1 2008 were $916.3 million, down from $1,068.7 million in Q4 2007.
- Net operating earnings for Q1 2008 were $131.5 million, down from $161.7 million in Q4 2007.
- Total customer funds managed and administered as of Q1 2008 were $153.3 billion, down from $162.4 billion as of Q4 2007.
This document provides unaudited selected financial data for Telefónica Group from January to December 2004. Some key details include:
- Revenues increased each quarter from €7.1 billion in Q1 to €8.2 billion in Q4. Full year revenues were €30.3 billion.
- Operating income before depreciation and amortization (OIBDA) was highest in Q3 at €3.4 billion. Full year OIBDA was €12.2 billion.
- Net income increased each quarter except Q4, ranging from €671 million in Q1 to €925 million in Q3. Full year net income was €3.2 billion.
This document provides quarterly financial highlights and statistical data for Nationwide Financial Services for the fourth quarter of 2006:
- Total revenues were $1.127 billion for Q4 2006, up slightly from the previous year. Net income was $154.2 million.
- Sales across all channels increased to $5.043 billion in Q4 2006, up from $3.950 billion the previous year.
- By segment, the Individual Investments segment saw revenues of $376.2 million in Q4 2006, down slightly from the prior year, while pre-tax operating earnings declined to $41.5 million.
- The Corporate and Other segment had the largest increase in revenues, growing to $
Zappos.com financial statements for 2007, 2008, and the first quarter of 2009. These figures are excerpted from Amazon's recent S-4 filing with the SEC
The document provides the company's 3Q09 results. It highlights that traffic grew 14.5% in 3Q09 and 16.3% in 9M09. Net revenue increased 6.9% in 3Q09 and 12.4% in 9M09. EBITDA grew 7.5% in 3Q09 to R$518.7 million with an EBITDA margin of 65.2%. The company also paid a dividend of R$1.26 per share totaling R$507.9 million in September 2009 and completed a capital increase of R$1,098.9 million through the issue of new shares.
This document is Nationwide Financial Services' statistical supplement for the first quarter of 2007. It provides quarterly financial highlights and key metrics for Nationwide's business segments. Nationwide saw total operating revenues of $1.1 billion for Q1 2007, with the Individual Investments segment contributing $365 million and pre-tax operating earnings of $217.6 million. Total customer funds managed and administered were $156.1 billion. Nationwide also reported net income of $203.2 million or $1.38 per diluted share for the quarter.
This document is a statistical supplement from Nationwide Financial Services for the fourth quarter of 2007. It includes:
1) Consolidated income statements and balance sheets for Nationwide showing quarterly results. Pre-tax operating earnings were $216.6 million for Q4 2007.
2) Segment results for individual investments, retirement plans, individual protection, and corporate and other. Retirement plans pre-tax operating earnings were $75.9 million in Q4 2007.
3) Key metrics for individual segments such as account values, policy reserves, sales and earnings trends. Sales in Q4 2007 were $4.79 billion.
4) Other financial data like customer funds managed, separate account assets
- Bank of America reported third quarter 2006 results with total revenue of $18.961 billion, an 11% increase from third quarter 2005, and net income of $5.416 billion, a 20% increase.
- Net interest income was $8.894 billion, a 1% increase, impacted by the sale of Brazilian operations and prior year FAS 133 impact. Noninterest income increased 20% to $10.067 billion.
- Global Consumer & Small Business Banking reported net income of $2.889 billion, a 13% increase, driven by increases in cards, deposits, and debit purchase volume.
This document provides quarterly financial highlights and statistics for Nationwide Financial Services for the second quarter of 2007:
- Total operating revenues were $1.18 billion for the quarter, consistent with the prior year. Net income was $197 million.
- The Individual Investments segment reported pre-tax operating earnings of $109 million for the quarter driven by improved investment income and gains.
- Customer funds managed and administered by Nationwide grew to $164 billion, an increase of 5% from the prior year.
- Total assets were $121 billion and shareholders' equity was $5.45 billion at quarter end. Net operating return on average equity excluding accumulated other comprehensive income was 14.1% for
The document provides a summary of CCR's 4Q09 results and upcoming events. Key highlights include:
- Traffic grew 19.5% in 4Q09 and 17.1% in 2009, excluding new assets. EBITDA increased 10% in 4Q09.
- Management proposes an additional dividend of R$101.5 million for 2009, totaling an 89.7% payout ratio.
- A capital increase of R$1.276 billion through the issue of new shares was completed.
- Capex is projected to be R$483 million for AutoBAn and R$308.2 million for NovaDutra in 2010.
Danaher reported record results for the fourth quarter and full year of 2006. Net earnings for Q4 2006 increased 28.5% to $323.7 million compared to Q4 2005. For the full year, net earnings increased 25% to $1.122 billion compared to 2005. Sales for Q4 2006 increased 17.5% to $2.66 billion and increased 20% for the full year to $9.596 billion. Danaher also expanded its segment reporting to include Medical Technologies as its own segment.
1) CCR reported strong financial results for 2Q08 and 1H08, with net revenue growth of 14.3% and 14.0% respectively, and net income growth of 13.3% and 13.6% respectively.
2) Traffic grew 9.4% in 2Q08 and 8.4% in 1H08, demonstrating continued growth in the business.
3) CCR continues to focus on expanding its concessions portfolio through investments in existing assets and pursuing new concession opportunities.
SK broadband reported a 1.9% increase in operating revenues for 2013 compared to 2012. While broadband revenues decreased 2.8% due to lower ARPU, TV revenues increased 55.4% from subscriber growth. Net income decreased 45.3% for the year. Capital expenditures increased 33.6% in 2013 to KRW 576.2 billion, with KRW 226.3 billion spent on last-mile investments. Subscriber counts grew for broadband, TV and corporate voice customers in the fourth quarter of 2013.
This document provides financial and operational results for AT&T across several business segments. Key highlights include:
- Wireless operating revenues increased 6% to $49.3 billion in 2008, with segment income increasing 58% to $10.8 billion. The number of wireless customers grew 5% to over 77 million.
- Wireline operating revenues declined 2% to $69.9 billion while segment income declined 7% to $11.2 billion in 2008 compared to 2007.
- Advertising & Publishing operating revenues declined 6% to $5.5 billion in 2008, with segment income declining 20% to $1.7 billion.
Banco ABC - 4th Quarter 2007 Earnings PresentationBanco ABC Brasil
Banco ABC Brasil had a successful year in 2007. The credit portfolio grew 71% to R$4,992 million while maintaining high quality with 99.5% of loans rated AA-C. Net income increased 154.6% in 4Q07 and 93.8% for the full year 2007. The middle market credit portfolio grew 89.9% with a focus on Sao Paulo clients and an average ticket size of R$1.9 million.
- Lexmark printers are used by some of the world's most important companies every day.
- In 2006, Lexmark made progress on its action plan to improve lifetime product profitability, reduce costs, and invest in strategic growth initiatives.
- Looking ahead, Lexmark is optimistic about opportunities for growth in distributed output markets and its ability to capitalize on these opportunities through increased investment in R&D and strengthening its brand.
- Revenue for Lexmark in 2005 was $5.22 billion, down 2% from 2004, with gross profit margin declining from 33.7% to 31.3%. Net earnings were $356.3 million compared to $568.7 million in 2004.
- The company faced challenging market conditions in 2005, particularly in the second half of the year, and took steps to lower prices and reduce workforce to improve competitiveness.
- Lexmark continued investing in R&D, introducing new products, and maintained marketing support, though this impacted short-term financial results.
- For 2006, Lexmark plans further cost reductions and profitability improvements through manufacturing consolidation and expense reductions, while continuing investment in new
15000
10000
5000
0
2005 2006 2007
- The financial ratios of SRM are projected to improve in 2006 and 2007 compared to 2005. However, they remain below industry averages.
- While liquidity, leverage, and asset management ratios improve, profitability ratios only marginally increase and remain poor.
- A key weakness is low profit margins, despite improvements in sales, inventory management, and debt repayment. Increased expenses constrain profits.
- Repaying debt improves financial stability in the short term, but sustained profitability is still lacking for long term financial health.
Anthem Southeast reported financial results for 2001 and the first two quarters of 2002. In 2001, operating revenue was $4.4 billion and net income was $116.1 million. Medical membership increased from 2.3 million to 2.4 million between the first and fourth quarters of 2001. For the first half of 2002, operating revenue was $2.5 billion and net income was $65 million, with medical membership at 2.5 million. Benefit expenses accounted for over 80% of operating expenses in both 2001 and the first half of 2002.
Reconciliations and Financial Slides from Safeway Investor Conferencefinance6
1) The document provides reconciliations of net income to adjusted EBITDA and net cash flow from operating activities to adjusted EBITDA for Safeway for 2007-2003. It also provides rolling 4 quarter reconciliations.
2) It reconciles gross margin and operating expense changes excluding factors like fuel.
3) EPS is reconciled excluding unusual items from 1992-2008G and a percentage change is calculated.
4) Free cash flow is reconciled from net cash flow from operating activities from 2013F-2005 by subtracting net cash used by investing activities.
This document provides a five-year summary of key financial metrics for the company from 2008-2004. It includes information on net sales, gross profit, expenses, income, per share information, balance sheet data, and other financial ratios. The summary shows that net sales grew at a compound annual growth rate of 7.2% from 2004-2008. However, income from continuing operations grew at a slower rate of 1.7% during this period.
The document provides financial information for Thermo Fisher Scientific from 2004 to Q3 2008, including revenue, costs, operating income, net income, and other metrics. It presents this information in both GAAP and non-GAAP terms, reconciling the two. It explains that the non-GAAP measures exclude certain one-time or unusual items to provide a better understanding of core operating performance and allow comparisons over time. Key data points include revenue of $7.9 billion in Q3 2008, operating income of $907 million, and net income of $704 million for that quarter.
The document provides financial information for Thermo Fisher Scientific from 2004 to Q3 2008, including revenue, costs, operating income, net income, and other metrics. It presents this information in both GAAP and non-GAAP terms, reconciling the two. It explains that the non-GAAP measures exclude certain one-time or unusual items to provide a better understanding of core operating performance and allow comparisons over time. Key data points include revenue of $7.9B in Q3 2008, operating income of $907M in Q3 2008 under GAAP and $458M under non-GAAP measures.
The document is a reconciliation report from Thermo Fisher Scientific for the fourth quarter of 2008. It includes:
1) GAAP profit and loss statements for 2004-2008.
2) A reconciliation of GAAP operating income to non-GAAP "adjusted" operating income for 2004-2008, which excludes certain one-time charges and acquisition-related expenses.
3) Information on Thermo Fisher's use of non-GAAP financial measures to evaluate core operating performance by excluding items outside normal operations.
This document provides financial information for Thermo Fisher Scientific for 2004-2008, including:
1) GAAP P&L statements for 2004-2008 with revenues, costs, operating income, taxes, and net income.
2) Plans to provide reconciliations of GAAP to non-GAAP financial measures to exclude certain items to allow comparison of core operating performance.
3) Intent to use additional non-GAAP measures like free cash flow for strategic decision making and resource allocation.
4) Acknowledgement that non-GAAP measures are not superior to GAAP but help investors understand core results.
The document is Thermo Fisher Scientific's reconciliation of financial information for Q4-2008. It includes:
1) GAAP P&L statements for 2004-2008 and key metrics like operating income and margins.
2) A reconciliation of GAAP operating income to non-GAAP "adjusted" operating income for 2004-2008, excluding items like acquisition costs and restructuring charges.
3) An explanation of why non-GAAP measures are used in addition to GAAP, to allow for consistent performance comparisons over time.
The document is Thermo Fisher Scientific's reconciliation of financial information for Q4-2008. It includes:
1) GAAP P&L statements for 2004-2008 and key metrics like operating margins.
2) A reconciliation of GAAP operating income to non-GAAP "adjusted" operating income for 2004-2008, which excludes certain one-time charges.
3) An explanation of why non-GAAP measures are used in addition to GAAP, to allow for consistent comparisons over time.
This document contains quarterly consolidated income statements for Peabody Energy Corporation for 2004 through the first quarter of 2007. It shows revenues, costs, operating profits, income before taxes, net income and earnings per share on a quarterly and annual basis. Key figures included are total revenues, operating costs and expenses, depreciation costs, operating profits, interest expenses and income, income before taxes, net income and earnings per share.
Ryder System, Inc. reported financial results for the third quarter and first nine months of 2005. Revenue increased 14.1% to $1.49 billion for the quarter and 10.8% to $4.2 billion for the nine month period. Net earnings grew 16.7% to $63.3 million for the quarter and 9.9% to $168.1 million for the nine months. Earnings per share increased 17.6% to $0.98 for the quarter on higher revenue and earnings across business segments. The Fleet Management Solutions segment saw the largest revenue growth at 10.0% for the quarter due to increased fuel sales and rental revenues.
This document contains financial statements and key metrics for Ryder System, Inc. for the third quarter and first nine months of 2005 compared to the same periods in 2004. It shows that revenue increased 14.1% to $1.49 billion for the quarter and 10.8% to $4.2 billion for the nine month period. Net earnings increased 16.7% to $63.3 million for the quarter and 9.7% to $168.1 million for the nine months. The debt to equity ratio increased to 137% as of September 30, 2005 from 118% as of December 31, 2004.
Danaher Corporation announced record results for its third quarter and first nine months of 2005. Net earnings for Q3 2005 were $229 million, up 14% from Q3 2004. Sales for Q3 2005 were $1.966 billion, an increase of 12.5% over Q3 2004. For the first nine months of 2005, net earnings were $646 million, up 22.5% compared to the same period in 2004. Sales for the first nine months were $5.721 billion, up 16.5% year-over-year. The CEO attributed record results to growth from existing businesses and acquisitions.
Big Lots reported financial results for fiscal year 2007 with net sales decreasing 1.8% to $4.656 billion. Income from continuing operations increased 28.8% to $145.08 million while earnings per share increased 39.6% to $1.41. Inventory turnover improved to 3.5 times from 3.4 times in 2006. Cash flow decreased to $249.17 million from $351.06 million in 2006 due to lower operating cash flow and higher capital expenditures.
Ryder System, Inc. and Subsidiaries reported financial results for the fourth quarter and full year 2005. Revenue for the quarter increased 13.3% to $1.54 billion compared to the same period in 2004. For the full year, revenue rose 11.5% to $5.74 billion. Net earnings for the quarter were $58.8 million compared to $62.6 million in 2004, while full year net earnings increased to $226.9 million from $215.6 million in the prior year. The company saw growth across its business segments, with the largest increases in supply chain solutions and fuel revenue.
Ryder System, Inc. and Subsidiaries reported financial results for the fourth quarter and full year 2005. Revenue for the quarter increased 13.3% to $1.54 billion compared to the same period in 2004. For the full year, revenue rose 11.5% to $5.74 billion. Net earnings for the quarter were $58.8 million, a decrease of 6.1% from 2004. However, full year net earnings increased 5.3% to $226.9 million compared to 2004. The company saw growth across its business segments, with the largest increases in its Supply Chain Solutions and Fuel revenue.
This document provides consolidated financial highlights for Burlington Northern Santa Fe Corporation for the years 1991-1995. Some key points:
- Revenues grew from $4.559 billion in 1991 to $6.183 billion in 1995. Operating income improved from a loss of $239 million in 1991 to income of $526 million in 1995, excluding unusual merger-related charges.
- Net income was $92 million in 1995 but would have been $416 million without accounting changes and debt retirement costs related to the merger.
- Capital expenditures were $1.042 billion in 1995 and are planned to be nearly $1.7 billion in 1996 to support revenue growth and cost reduction initiatives.
This document summarizes the financial performance of Burlington Northern Santa Fe Corporation for the years 1992-1996. It reports that in 1996:
- Operating income increased 14% to $1.75 billion compared to 1995 on a comparable basis.
- Revenues reached $8.19 billion despite a drop in agricultural commodities revenues.
- Operating expenses were $178 million below 1995 levels, lowering the operating ratio to 78.6%.
- Net income grew 21% to $889 million, or $5.70 per share, compared to $733 million in 1995.
This annual report summarizes Burlington Northern Santa Fe Corporation's financial and operational performance in 1998. Some key highlights include:
- Revenues reached a record $8.94 billion, a 6.8% increase over 1997.
- Adjusted operating income grew 16% to a record $2.16 billion.
- Adjusted net income exceeded $1.12 billion, a 19% improvement over 1997.
- The operating ratio improved to 75.9%, nearly 2 points better than 1997's adjusted ratio.
- Safety continued to improve, with reductions in reportable injuries and rail accidents.
Burlington Northern Santa Fe Corporation's 1999 Annual Report summarizes the company's performance in 1999 and compares it to 1994, the year before the BNSF merger. Key points:
1) BNSF achieved record results in safety, customer service, efficiency and financial performance in 1999 compared to 1994.
2) Safety metrics like lost workdays and injuries dropped significantly. Customer service improved with 91% on-time performance. Operating expenses per ton-mile dropped 20-25%.
3) Financial results were also much stronger, with operating income reaching a record $2.24 billion, up 14% annually from 1994. The operating ratio improved 9 points to 75.4%.
Burlington Northern Santa Fe Corporation's 2000 Annual Report summarizes the company's performance for the year. Key points include:
- Revenues grew to $9.2 billion while operating expenses only increased 1% despite a $230 million rise in fuel costs.
- Intermodal revenues increased 6% to a record level while safety and efficiency improvements were made.
- However, weak coal demand, high fuel prices, and a slow US economy impacted results for the year.
- Over the past five years since the Burlington Northern and Santa Fe merger, significant progress has been made in safety, service, efficiency and financials.
This document is the 2001 Annual Report to Shareholders for Burlington Northern Santa Fe Corporation. It contains the following key information:
1) The CEO discusses BNSF's progress on its strategic priorities of People, Growth, Ease of Doing Business, Service, and Efficiency in 2001, noting challenges from the economic slowdown but some record achievements.
2) Safety improvements were made but injuries remained level, while discussions progressed with unions on safety agreements.
3) Revenues were flat in 2001 due to economic conditions, but some business lines like Mexico grew, and new customers and services helped capture additional market share.
4) Financial results disappointed expectations for revenue and operating ratio goals, though costs
BNSF is a major railroad network in the United States that transports a variety of goods. In 2003, BNSF saw revenue growth of 5% driven by strong intermodal growth, though on-time performance fell short of goals. Safety performance reached record levels with injury rates down significantly. Looking forward, BNSF aims to continue revenue growth through initiatives like expanding intermodal capacity and pursuing market-based pricing across all business lines.
Burlington Northern Santa Fe Corporation reported earnings of $0.36 per diluted share for the first quarter of 2001, compared to $0.55 per diluted share for the same period in 2000. Freight revenues were $2.26 billion, up slightly due to a 4% increase in ton-miles. Operating expenses increased 7% to $1.87 billion due to higher fuel costs, severe winter weather, and increased energy costs. The operating ratio was 81.5% compared to 77.3% in 2000. Revenue from agricultural commodities increased 11% while industrial revenues declined 3% and coal revenues declined 1% compared to the first quarter of 2000.
The document is Burlington Northern Santa Fe Corporation's 2nd Quarter 2001 Investors' Report. It summarizes that:
1) Earnings were $0.50 per diluted share compared to $0.53 per diluted share in the same period last year, with revenues remaining even despite 2% higher ton-miles.
2) Operating expenses were $65 million higher due to factors like flooding in the Midwest and higher fuel costs.
3) Operating income decreased to $428 million from $483 million last year, and the operating ratio increased to 80.9% from 78.4% last year.
The document is Burlington Northern Santa Fe Corporation's third quarter 2001 investors' report. Key points:
- Earnings per share were $0.58 compared to $0.64 in third quarter 2000. Freight revenues were $2.31 billion, even with last year.
- Operating expenses were higher by $69 million due to increased compensation, benefits, and fuel costs. Operating income was $502 million versus $571 million in 2000.
- 4.1 million shares were repurchased in the quarter, bringing the total under the buyback program to 101.1 million shares.
- The report provides financial statements and statistics on revenues, expenses, operations, and capital expenditures for
This document provides an annual investors' report for Burlington Northern Santa Fe Corporation for 2001. It includes key financial information such as earnings results for Q4 and full year 2001, operating revenues and expenses, balance sheet information, and cash flow information. Specifically, it notes that Q4 2001 earnings were $0.46 per share including workforce reduction costs, or $0.57 per share excluding those costs. For the full year, earnings were $1.87 per share including unusual items, or $2.08 per share excluding unusual items. It also highlights free cash flow of $443 million for the full year, up 3% from 2000.
1. Burlington Northern Santa Fe reported first quarter 2002 earnings of $0.45 per share, up from $0.34 per share in first quarter 2001, which included non-recurring losses.
2. Freight revenues decreased 6% to $2.14 billion due to softer demand across all major product sectors and mild winter weather reducing coal shipments.
3. Operating expenses decreased 4% to $1.8 billion due to reductions in fuel costs, compensation, and equipment rents, partially offsetting the revenue decline.
Burlington Northern Santa Fe reported earnings of $0.51 per share for Q2 2002, up slightly from $0.50 per share in Q2 2001. Freight revenues were $2.18 billion, down 3% from the previous year, with declines in coal, agricultural products, and industrial products offsetting growth in consumer products. Operating expenses decreased 2% despite lower fuel prices, helping maintain the operating ratio at 81.4%. The company also repurchased 4.2 million shares during the quarter.
The document is Burlington Northern Santa Fe Corporation's third quarter 2002 investors' report. It includes:
- BNSF reported earnings of $0.51 per share for Q3 2002, even with adjusted earnings of $0.56 per share for the same period in 2001.
- Freight revenues were $2.28 billion for Q3 2002, even with adjusted revenues of $2.28 billion for Q3 2001.
- Operating income decreased to $421 million for Q3 2002 compared to adjusted operating income of $470 million for Q3 2001, with the operating ratio increasing to 81.6% from 79.4%.
This document provides an annual investors' report for Burlington Northern Santa Fe Corporation for 2002. It includes:
1) Key financial highlights for Q4 2002 including $0.54 earnings per share, $2.27 billion in freight revenues, and $436 million in operating income.
2) Annual 2002 results including $2.00 earnings per share, $8.87 billion in freight revenues, and $1.66 billion in operating income.
3) Details of common stock repurchases totaling approximately 116 million shares under their repurchase program.
OJP data from firms like Vicinity Jobs have emerged as a complement to traditional sources of labour demand data, such as the Job Vacancy and Wages Survey (JVWS). Ibrahim Abuallail, PhD Candidate, University of Ottawa, presented research relating to bias in OJPs and a proposed approach to effectively adjust OJP data to complement existing official data (such as from the JVWS) and improve the measurement of labour demand.
[4:55 p.m.] Bryan Oates
OJPs are becoming a critical resource for policy-makers and researchers who study the labour market. LMIC continues to work with Vicinity Jobs’ data on OJPs, which can be explored in our Canadian Job Trends Dashboard. Valuable insights have been gained through our analysis of OJP data, including LMIC research lead
Suzanne Spiteri’s recent report on improving the quality and accessibility of job postings to reduce employment barriers for neurodivergent people.
Decoding job postings: Improving accessibility for neurodivergent job seekers
Improving the quality and accessibility of job postings is one way to reduce employment barriers for neurodivergent people.
Independent Study - College of Wooster Research (2023-2024) FDI, Culture, Glo...AntoniaOwensDetwiler
"Does Foreign Direct Investment Negatively Affect Preservation of Culture in the Global South? Case Studies in Thailand and Cambodia."
Do elements of globalization, such as Foreign Direct Investment (FDI), negatively affect the ability of countries in the Global South to preserve their culture? This research aims to answer this question by employing a cross-sectional comparative case study analysis utilizing methods of difference. Thailand and Cambodia are compared as they are in the same region and have a similar culture. The metric of difference between Thailand and Cambodia is their ability to preserve their culture. This ability is operationalized by their respective attitudes towards FDI; Thailand imposes stringent regulations and limitations on FDI while Cambodia does not hesitate to accept most FDI and imposes fewer limitations. The evidence from this study suggests that FDI from globally influential countries with high gross domestic products (GDPs) (e.g. China, U.S.) challenges the ability of countries with lower GDPs (e.g. Cambodia) to protect their culture. Furthermore, the ability, or lack thereof, of the receiving countries to protect their culture is amplified by the existence and implementation of restrictive FDI policies imposed by their governments.
My study abroad in Bali, Indonesia, inspired this research topic as I noticed how globalization is changing the culture of its people. I learned their language and way of life which helped me understand the beauty and importance of cultural preservation. I believe we could all benefit from learning new perspectives as they could help us ideate solutions to contemporary issues and empathize with others.
2. Elemental Economics - Mineral demand.pdfNeal Brewster
After this second you should be able to: Explain the main determinants of demand for any mineral product, and their relative importance; recognise and explain how demand for any product is likely to change with economic activity; recognise and explain the roles of technology and relative prices in influencing demand; be able to explain the differences between the rates of growth of demand for different products.
"Does Foreign Direct Investment Negatively Affect Preservation of Culture in the Global South? Case Studies in Thailand and Cambodia."
Do elements of globalization, such as Foreign Direct Investment (FDI), negatively affect the ability of countries in the Global South to preserve their culture? This research aims to answer this question by employing a cross-sectional comparative case study analysis utilizing methods of difference. Thailand and Cambodia are compared as they are in the same region and have a similar culture. The metric of difference between Thailand and Cambodia is their ability to preserve their culture. This ability is operationalized by their respective attitudes towards FDI; Thailand imposes stringent regulations and limitations on FDI while Cambodia does not hesitate to accept most FDI and imposes fewer limitations. The evidence from this study suggests that FDI from globally influential countries with high gross domestic products (GDPs) (e.g. China, U.S.) challenges the ability of countries with lower GDPs (e.g. Cambodia) to protect their culture. Furthermore, the ability, or lack thereof, of the receiving countries to protect their culture is amplified by the existence and implementation of restrictive FDI policies imposed by their governments.
My study abroad in Bali, Indonesia, inspired this research topic as I noticed how globalization is changing the culture of its people. I learned their language and way of life which helped me understand the beauty and importance of cultural preservation. I believe we could all benefit from learning new perspectives as they could help us ideate solutions to contemporary issues and empathize with others.
Economic Risk Factor Update: June 2024 [SlideShare]Commonwealth
May’s reports showed signs of continued economic growth, said Sam Millette, director, fixed income, in his latest Economic Risk Factor Update.
For more market updates, subscribe to The Independent Market Observer at https://blog.commonwealth.com/independent-market-observer.
3. ITW
Forward - Looking Statements
This conference call contains forward-looking state ments within the
meaning of the Private Securities Litigation Reform Act of 1995, including,
without limitation, statements regarding end market conditions and base
business and future tax rate expectations for full year 2005 and the
Company’s related earnings forecasts. These statements are subject to
certain risks, uncertainties, and othe r factors, which could cause actual
results to differ materially from those anticipated, including, without
limitation, the risks described herein. Important factors that may
influence future results include (1) a downturn in the construction,
automotive, general industrial, food service and retail, or comme rcial real
estate markets, (2) deterioration in global and domestic business and
economic conditions, particularly in North Ame rica, the European
Community or Australia, (3) the unfavorable impact of foreign currency
fluctuations and prices of raw materials, (4) an interruption in, or
reduction in, introducing ne w products into the Company’s product lines,
(5) an unfavorable environment for making acquisitions or dis positions,
domestic and international, including adverse accounting or regulatory
requirements and market values of candidates, and (6) unfavorable tax law
changes and tax authority rulings.
4. Conference Call Playback
Replay numbe r: 402-530-7662
No pass code necessary
Telephone replay available through midnight of
February 10, 2005
Webcast / PowerPoint replay available at itw.com
website
5. ITW
Quarterly Highlights
2003 2004 F(U) Last Year
Q4 Q4 Amount %
Operating Revenues 2,626.0 3,051.6 425.6 16.2%
Operating Income 431.7 535.2 103.5 24.0%
% of Revenues 16.4% 17.5% 1.1%
Income From Continuing Operations
Income Amount 286.9 359.2 72.3 25.2%
Income Per Share-Diluted 0.93 1.21 0.28 30.1%
Average Invested Capital 6,875.6 7,780.3 (904.7) -13.2%
Return on Average Invested Capital 17.3% 19.2% 1.9%
Free Operating Cash Flow 425.7 326.4 (99.3) -23.3%
6. ITW
Quarterly Operating Analysis
Revenue Income Margins
Base Manufacturing Business
Operating Leverage 8.2% 20.2% 1.8%
Nonvolume-related - -2.2% -0.3%
Total 8.2% 18.0% 1.5%
Acquisitions / Divestitures 4.3% 1.7% -0.4%
Translation 3.9% 4.1% -
Impairment - - -
Restructuring - -1.0% -0.2%
Leasing & Investments 0.2% 1.2% 0.1%
Other Revenue -0.4% - 0.1%
Total 16.2% 24.0% 1.1%
8. ITW
Non Operating & Taxes
2003 2004 F(U) Last Yea r
Q4 Q4 Amount %
Operating Income 431.7 535.2 103.5 24.0%
Intere st Ex pense (18.0) (15.8) 2.2
Other Income(ex pe nse) 3.5 (5.5) (9.0)
Income From Continuing Operations-P/T 417.2 513.9 96.7 23.2%
Income Ta xes 130.3 154.7 (24.4)
% to Pre Tax Income 31.2% 30.1% 1.1%
Income From Continuing Operations-A/T 286.9 359.2 72.3 25.2%
9. ITW
Invested Capital
12/31/03 9/30/04 12/31/04
Trade Receivables 1,721.2 1,983.6 2,054.6
Days Sales Outstanding 59.0 60.2 60.6
Inventories 992.0 1,142.5 1,281.2
Months on Hand 1.7 1.8 1.9
Other Current Assets 385.5 360.1 319.0
Accounts Payable & Accruals (1,432.8) (1,910.1) (1,647.4)
Operating Working Capital 1,665.9 1,576.1 2,007.4
% to Revenue(Prior 4 Qtrs.) 17% 14% 17%
Net Plant & Equipment 1,728.6 1,807.9 1,876.9
Investments, net of L&I Debt 633.4 820.9 833.5
Goodwill 2,511.3 2,686.8 2,753.1
Other, net 428.1 663.0 534.9
Invested Capital 6,967.3 7,554.7 8,005.8
10. ITW
Debt & Equity
12/31/03 9/30/04 12/31/04
Total Capital
Short Term Debt 56.1 97.1 203.5
Long Term Debt 920.4 924.0 921.1
Total Debt 976.5 1,021.1 1,124.6
Stockholders' Equity 7,874.3 7,543.3 7,627.6
Total Capital 8,850.8 8,564.4 8,752.2
Less:
Leasing & Investments Debt (199.0) (79.4) (79.0)
Cash (1,684.5) (930.3) (667.4)
Net Debt & Equity 6,967.3 7,554.7 8,005.8
Debt to Total Capital 11% 12% 13%
11. ITW
Cash Flow
2003 2004
Q4 Q4
Net Income 283.3 358.1
Adjust for Non-Cash Items 263.1 276.7
Changes in Operating Assets & Liabilities (66.2) (251.8)
Net Cash From Operating Activities 480.2 383.0
Additions to Plant & Equipment (75.3) (84.7)
Proceeds from investments 20.8 28.1
Free Operating Cash Flow 425.7 326.4
Stock Repurchase - (527.7)
Acquisitions (55.6) (148.9)
Investments (25.4) (28.8)
Dividends (73.8) (83.0)
Debt (34.2) 100.6
Other 74.9 98.5
Net Cash Increase/(Decrease) 311.6 (262.9)
12. ITW
Return on Average Invested Capital
2003 2004 F(U)
Current Quarte r Q4 Q4 Prior Yr.
Ope rating Income after ta xes 296.9 374.1 77.2
Opera ting Margins 11.3% 12.3% 1.0%
Ave rage Inve sted Ca pital 6,875.6 7,780.3 (904.7)
Ca pita l Turnover 1.53 1.57 0.04
Return on Average Invested Capital 17.3% 19.2% 1.9%
2003 2004 F(U)
Ye ar to Da te Q4 Q4 Prior Yr.
Ope rating Income after ta xes 1,078.1 1,377.9 299.8
Opera ting Margins 10.7% 11.7% 1.0%
Ave rage Inve sted Ca pital 6,685.3 7,465.2 (779.9)
Ca pita l Turnover 1.50 1.57 0.07
Return on Average Invested Capital 16.1% 18.5% 2.4%
13. ITW
Acquisitions
2003 2004
Q1 Q2 Q3 Q4 Q1 Q2 Q3 Q4
Annual Re venue s Acquired 49 35 231 32 247 168 78 131
Purchase Price
Cash Pa id 44 30 74 56 184 193 62 149
Stock Issued - - - - 2 - - -
Total 44 30 74 56 186 193 62 149
Number of Acqui sitions
North America
Engineered Products 1 - 3 3 2 1 1 1
Speci alty Systems - 2 1 1 - 1 1 1
I nternational
Engineered Products - 1 2 1 5 2 - 1
Speci alty Systems 7 3 3 - 3 4 1 -
Total 8 6 9 5 10 8 3 3
14. Key Economic Data
• December ’04 ISM: 58.6% same as in Q3 ’04; new order
index of 67.4% in December ’04
• US Industrial Production (ex. Tech.): +4.1% in December
’04 compared to +5.7% in August ’04
• Euro-Zone Purchasing Managers’ Index: 51.4% in
December ’04 versus 53.9% in August ’04
• Euro-Zone Industrial Production: +0.4% in December
’04 versus +2.2% in August ’04; Germany and U.K.
indexes both slightly negative in December ’04
15. ITW
Engineered Products - North America
2003 2004 F(U) Last Year
Q4 Q4 Amount %
Operating Revenues 748.6 818.4 69.8 9.3%
Operating Income 114.2 126.8 12.6 11.0%
Operating Ma rgins 15.3% 15.5% 0.2%
16. Engineered Products - North America
Quarterly Analysis
% F(U) Prior Year
Opera ting Ope rating Operating
Revenue Income Margins
Base Business
Operating Leverage 5.3% 14.5% 1.3%
Nonvolume-related - -1.9% -0.3%
Total 5.3% 12.6% 1.0%
Acquisitions / Divestitures 3.7% 1.0% -0.4%
Translation 0.3% 0.2% -
Impairment - - -
Restructuring - -2.8% -0.4%
Total 9.3% 11.0% 0.2%
17. Engineered Products - North America
Key Points
• Total construction: +7% for Q4 ’04
• ITW construction (Paslode/Buildex/Ramset/ITW
Brands) base revenues: +8% for Q4 ’04; new
housing and renovation markets +5% to +8%;
commercial +5%
• Wilsonart base revenues: +6%; basic laminate and
flooring products add to growth
18. Engineered Products - North America
Key Points
Auto base revenues: -4% for Q4 ’04
•
Big 3 build rates: -6% for Q4 ’04
•
– GM: -10%
– Ford: -12%
– Chrysler: +11%
– Transplants: +9%
• Big 3 inventories: 78 days at 12-31-04
– GM: 77 days
– Ford: 79 days
– Chrysler: 80 days
– Transplants: 49 days
• ITW build estimates for 2005:
– Q1: -7%
– FY: flat
Industrial: base revenues +11% for Q4 ’04
•
– Top performers: Minigrip/ZipPak, fluid products, industrial
plastics
19. ITW
Engineered Products - International
2003 2004 F(U) Last Year
Q4 Q4 Amount %
Operating Revenues 535.9 684.2 148.3 27.7%
Operating Income 86.5 108.8 22.3 25.8%
Operating Margins 16.1% 15.9% -0.2%
20. Engineered Products - International
Quarterly Analysis
% F(U) Prior Yea r
Operating Operating Operating
Revenue Income Margins
Base Business
Operating Leverage 4.3% 10.6% 1.0%
Nonvolume-relate d - - -
Total 4.3% 10.6% 1.0%
Acquisitions / Divestitures 14.0% 8.4% -0.8%
Tra nsla tion 9.4% 10.6% 0.2%
Impairment - - -
Restructuring - -3.8% -0.6%
Total 27.7% 25.8% -0.2%
21. Engineered Products - International
Key Points
Construction base revenues: +6% in Q4 ’04
•
– Europe: +5% growth (strength in UK, Belgium, Italy)
– Austral-Asia: +3% (numerous businesses in Australia)
– Wilsonart Intl.: +18% (good activity in U.K. and China)
• Automotive base revenues: +3% in Q4 ’04
– Builds: -3.5% in Q4 ’04
– BMW: +15.6%; Ford: -2%; Daimler/Chrysler -2.8%; GM
-11.4%; Fiat -15.5% in Q4 ’04
– ITW forecasting FY ’05 builds: +2%
• Industrial base revenues: +2% in Q4 ’04
– Top performers: fluid products and polymers
22. ITW
Specialty Systems - North America
2003 2004 F(U) Last Year
Q4 Q4 Amount %
Operating Revenues 870.3 972.2 101.9 11.7%
Operating Income 140.8 183.3 42.5 30.2%
Operating Margins 16.2% 18.8% 2.6%
23. Specialty Systems - North America
Quarterly Analysis
% F(U) Prior Year
Operating Operating Operating
Revenue Income Margins
Base Business
Operating Leverage 10.9% 27.7% 2.4%
Nonvolume-related - 0.6% 0.1%
Total 10.9% 28.3% 2.5%
Acquisitions / Divestitures 0.4% -0.2% -0.1%
Translation 0.4% 0.7% 0.0%
Impairment - - -
Restructuring - 1.4% 0.2%
Total 11.7% 30.2% 2.6%
24. Specialty Systems - North America
Key Points
• Welding base revenues: 20+% in Q4 ’04 due primarily
to stronger equipment sales to construction and variety
of other end markets; consumables and components
units also grew sales
• Industrial packaging: Signode base revenue grew
+15% in Q4 ’04 ; consumables / machinery both
showed improvement
• Food Equipment base revenues: +3% in Q4 ’04;
growth due to restaurant/institutional customers and
parts/service
25. ITW
Specialty Systems - International
2003 2004 F(U) Last Year
Q4 Q4 Amount %
Operating Revenues 542.0 653.4 111.4 20.6%
Operating Income 67.5 88.4 20.9 31.0%
Operating Margins 12.4% 13.5% 1.1%
26. Specialty Systems - International
Quarterly Analysis
% F(U) Prior Year
Operating Operating Ope rating
Revenue Income Margins
Base Business
Operating Leverage 10.8% 32.8% 2.5%
Nonvolume-related - -11.3% -1.3%
Total 10.8% 21.5% 1.2%
Acquisitions / Divestitures 1.2% -1.5% -0.3%
Translation 8.6% 10.7% 0.2%
Impairme nt - - -
Restructuring - 0.3% 0.0%
Total 20.6% 31.0% 1.1%
27. Specialty Systems - International
Key Points
• Signode base revenues strengthen in Q4 ’04:
-Europe: +20%
-Asia/Pacific: +20%
• Food Equipment: base revenues +8% in Q4 ’04;
growth from all geographic regions
• Finishing: base revenue grew 13% in Q4 ’04
28. ITW
2005 Forecast
Mid
Low High Point
1st Quarter
Base Revenues 5.1% 7.1% 6.1%
Income Per Share-Diluted $1.01 $1.07 $1.04
%F(U) 2004 9% 15% 12%
Full Year
Base Revenues 4.4% 6.4% 5.4%
Income Per Share-Diluted $4.91 $5.11 $5.01
%F(U) 2004 12% 16% 14%
29. ITW 2005 Forecast
Key Assumptions
• Exchange rates hold at current levels.
• Acquired revenues in the $600 to $800
million range.
• Restructuring cost of $30 to $50 million.
• Leasing & Investments income of $60 to
$70 million, which is lower than 2004 by
$60 to $70 million.
• Tax rate of 33% for the first quarter and
the year.