This document provides financial information for Kroger from 2008-2022. It includes historical and forecasted data on store counts, capital expenditures, property/equipment, depreciation expenses, and income statements. Some key points:
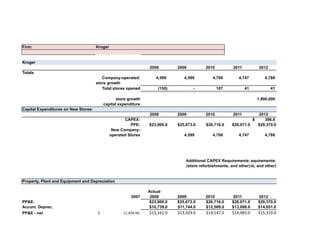
- Kroger opened 107-150 new stores per year from 2008-2012 and forecasts 40 new stores annually through 2022.
- Capital expenditures are forecasted to increase annually from $455.7 million in 2013 to $1.055 billion in 2021 to support new store growth.
- Property/equipment is forecasted to increase from $15.3 billion in 2012 to over $33 billion in 2021 due to capital expenditures exceeding depreciation expenses.
- Net earnings are
Horniman Horticulture, FIL 349 ( Advanced Financial Theory and Problems)CameronMcintosh8
Overview: This is a presentation on Horniman Horticulture, we have devised a Naïve and Revised forecast to extrapolate out the income statement and balance sheet from 2016 to 2018. Our presentation outlines the difference between Profits and Cash. Horniman Horticulture had high profitability but their cash balance was decreasing year-over-year. Our Revised Forecast applies our assumptions to create manageable growth without addition financing through debt or equity.
Problem: Horniman Horticulture started with a cash balance $120,000 at the end of 2012, then decreased to $9,400 at the end 2015. Cash was eroding year-over-year with no signs of stopping as the naive forecast shows they will have a negative cash balance in 2016 through 2018.
Solution/Assumption: We discovered that Horniman Horticulture was growing to fast for the business to fund its operations without debt or equity. Their cash cycle was above industry average with high receivable days, low payable days, and high inventory days. We kept payable days constant as the firm gets a 2% discount from suppliers when paid under 10 days. We increased receivable days and inventory days as they go to a more mature plant which increase gross margin. The change in cash cycle decreases revenue growth from 30% to and controllable growth of 8.3%.
5YR Equity ValuationNOTE Rule of thumb - 20 growth in forecast o.docxevonnehoggarth79783
5YR Equity ValuationNOTE: Rule of thumb - 20% growth in forecast of 5 years; 80% residualSelect Market Prices and Other InformationForecast Period Information (Years 1-5)Last Year's Revenue$ 3,392,000,000.00Shares Outstanding100,291,843Revenue Growth Rate 3% then 2%Debt Outstanding (assume book value = market value)$ 685,003,000.00Operating Margin (including depreciation expense)18%Cash and Marketable Securities$ 2,066,000,000.00Incremental Investment in Operating Capital10%WACC6.1%Tax Rate6%Instructions: Calculate the Stock Price based on the given assumptions and under 3 long term growth scenariosNO GROWTHFORCAST YEARSYear 1Year 2Year 3Year 4Year 5Year 6Revenue3,493,760,0003,598,572,8003,706,529,9843,780,660,5843,856,273,7953,933,399,271 Costs2,864,883,2002,950,829,6963,039,354,5873,100,141,6793,162,144,5123,225,387,402EBIT628,876,800647,743,104667,175,397680,518,905694,129,283708,011,869 Taxes35,594,42736,662,26037,762,12738,517,37039,287,71740,073,472NOPAT593,282,373611,080,844629,413,270642,001,535654,841,566667,938,397 Incremental Investment in Operating Capital59,328,23761,108,08462,941,32764,200,15465,484,1570%Perpetuity Cash Flow (forever and ever cash flows)FCF533,954,136549,972,760566,471,943577,801,382589,357,409667,938,39710,956,897,959.88PV FCF503,274,266488,587,912474,330,129456,017,650438,412,162496,867,117No Growth Strategy (Year 6 expected growth rate = 0% and WACC = ROIC)PV of Forecast2,360,622,118PV of Residual or Terminal Value8,150,635,3301) fcf yr 6 (given) 2) perp formula 3) /1+I (wacc)Perp= (fcf YR 6/wacc-g)10,956,897,959.88PV of All Future Cash Flows10,511,257,448add fcf all 6 yearsCash and Marketable Securies2,066,000,000Corporate Valuation12,577,257,448Value of Debt685,003,000Value of Equity Holders11,892,254,448Value per Equity Share118.58GROWTHFORCAST YEARSYear 1Year 2Year 3Year 4Year 5Year 6Revenue3,493,760,0003,598,572,8003,706,529,9843,780,660,5843,856,273,7953,933,399,271 Costs2,864,883,2002,950,829,6963,039,354,5873,100,141,6793,162,144,5123,225,387,402EBIT628,876,800647,743,104667,175,397680,518,905694,129,283708,011,869 Taxes35,594,42736,662,26037,762,12738,517,37039,287,71740,073,472NOPAT593,282,373611,080,844629,413,270642,001,535654,841,566667,938,397 Incremental Investment in Operating Capital59,328,23761,108,08462,941,32764,200,15465,484,157136,313,958.588%FCF166,860,000171,865,800177,021,774180,562,209184,173,454531,624,438PV FCF155,218,605148,721,082142,495,548135,205,078128,287,609145,392,624Growth Strategy (Year 6 expected growth rate = 2% and ROIC = 9.8%)PV of Forecast709,927,921PV of Residual or Terminal Value9,654,796,5761) fcf yr 6 (given) 2) perp formula 3) /1+I (wacc)Perp= (fcf YR 6/wacc-g)12,978,941,717PV of All Future Cash Flows10,364,724,497add fcf all 6 yearsCash and Marketable Securies2,066,000,000Corporate Value12,430,724,497Value of Debt685,003,000Value of Equity Holders11,745,721,497Value per Equity Share 117.12
10YR Equity Valuation NOTE: Rule of thumb - 20% growth in.
SBUX ISIncome Statement - As Reported 10K in millionsIncome Statem.docxtodd331
SBUX ISIncome Statement - As Reported 10K in millionsIncome Statement - As Reported 10Q in millions9/30/139/30/149/30/159/30/169/30/179/30/18TTM12/30/173/30/186/30/189/30/1812/29/18TTM Company-operated stores$11,793.2$12,977.9$15,197.3$16,844.1$17,650.719,690.320,318.8 Company-operated stores4,741.84,828.05,060.45,060.1$5,370.3020,318.8 Total specialty$3,073.6$3,469.9$3,965.4$4,471.8$4,736.15,029.24,959.6 Total specialty1,331.91,203.81,249.91,243.5$1,262.404,959.6 Licensed stores$1,360.5$1,588.6$1,861.9$2,154.2$2,355.02,652.22,706.9 Licensed stores682.4625.6660.6683.6$737.102,706.9 CPG, foodservice and other$1,713.1$1,881.3$2,103.5$2,317.6$2,381.12,377.02,252.7 CPG, foodservice and other649.5578.2589.3559.9$525.302,252.7Total net revenues$14,866.8$16,447.8$19,162.7$21,315.9$22,386.8$24,719.525,278.4Total net revenues6,073.76,031.86,310.36,303.6$6,632.7025,278.4 Cost of sales including occupancy costs-$6,382.3-$6,858.8-$7,787.5-$8,511.1-$9,038.2-10,174.5-10,434.2 Cost of sales including occupancy costs-2,502.9-2,516.0-2,554.9-2,604.6($2,758.70)-10,434.2 Store operating expenses-$4,286.1-$4,638.2-$5,411.1-$6,064.3-$6,493.3-7,193.2-7,449.2 Store operating expenses-1,737.0-1,789.6-1,825.0-1,841.6($1,993.00)-7,449.2 Other operating expenses-$431.8-$457.3-$522.4-$545.4-$553.8-539.3-532.2 Other operating expenses-141.6-134.3-148.0-156.7($93.20)-532.2 Depreciation and amortization expenses-$621.4-$709.6-$893.9-$980.8-$1,011.4-1,247.0-1,321.6 Depreciation and amortization expenses-258.8-331.6-330.0-326.6($333.40)-1,321.6 General and administrative expenses-$937.9-$991.3-$1,196.7-$1,360.6-$1,393.3-1,759.0-1,797.8 General and administrative expenses-379.1-405.8-468.7-460.0($463.30)-1,797.8 Restructuring and impairments$0.0$0.0$0.0$0.0-$153.5-224.4-240.0 Restructuring and impairments-27.6-134.7-16.9-45.2($43.20)-240.0 Litigation credit / charge-$2,784.1$20.2$0.0$0.0$0.0$0.0Income from equity investees89.452.771.487.7$67.80279.6Income from equity investees$251.4$268.3$249.9$318.2$391.4301.2279.6Operating income / loss1,116.1772.51,038.2956.6$1,015.703,783.0Operating income / loss-$325.4$3,081.1$3,601.0$4,171.9$4,134.7$3,883.33,783.0Gain resulting from acquisition of joint venture1,326.3Net interest and other income62.3483-$24.8074.9 Gain resulting from acquisition of joint venture$0.0$0.0$390.6$0.0$0.01,376.4$0.0 Interest income and other, net88.2313239$24.80126.0Loss on divestiture of certain operations$0.0$0.0-$61.1$0.0$0.0499.2 Interest expense-25.9-503($75.00)-77.0 Interest income and other, net$123.6$142.7$43.0$108.0$275.3191.4$126.0Earnings / loss before income taxes3,005.9363236$965.501,068.7 Interest expense-$28.1-$64.1-$70.5-$81.3-$92.5-170.3-$77.0Income tax expense / benefit-755.8-35-45-64($205.10)-349.4Earnings / loss before income taxes-$229.9$3,159.7$3,903.0$4,198.6$4,317.5$5,780.0$1,068.7Net earnings / loss including noncontrolling interests2,250.18161,027932$760.403,534.721.83%Net earnings / loss attributab.
Wassim Zhani Federal Taxation Chapter 4 Personal and Dependency Examptions; F...Wassim Zhani
Wassim Zhani Federal Taxation Chapter 4 Personal and Dependency Examptions; Filing Status; Determination of Tax for Individual, Filing Requirements.pdf
Affordable Stationery Printing Services in Jaipur | Navpack n PrintNavpack & Print
Looking for professional printing services in Jaipur? Navpack n Print offers high-quality and affordable stationery printing for all your business needs. Stand out with custom stationery designs and fast turnaround times. Contact us today for a quote!
3.0 Project 2_ Developing My Brand Identity Kit.pptxtanyjahb
A personal brand exploration presentation summarizes an individual's unique qualities and goals, covering strengths, values, passions, and target audience. It helps individuals understand what makes them stand out, their desired image, and how they aim to achieve it.
RMD24 | Debunking the non-endemic revenue myth Marvin Vacquier Droop | First ...BBPMedia1
Marvin neemt je in deze presentatie mee in de voordelen van non-endemic advertising op retail media netwerken. Hij brengt ook de uitdagingen in beeld die de markt op dit moment heeft op het gebied van retail media voor niet-leveranciers.
Retail media wordt gezien als het nieuwe advertising-medium en ook mediabureaus richten massaal retail media-afdelingen op. Merken die niet in de betreffende winkel liggen staan ook nog niet in de rij om op de retail media netwerken te adverteren. Marvin belicht de uitdagingen die er zijn om echt aansluiting te vinden op die markt van non-endemic advertising.
Putting the SPARK into Virtual Training.pptxCynthia Clay
This 60-minute webinar, sponsored by Adobe, was delivered for the Training Mag Network. It explored the five elements of SPARK: Storytelling, Purpose, Action, Relationships, and Kudos. Knowing how to tell a well-structured story is key to building long-term memory. Stating a clear purpose that doesn't take away from the discovery learning process is critical. Ensuring that people move from theory to practical application is imperative. Creating strong social learning is the key to commitment and engagement. Validating and affirming participants' comments is the way to create a positive learning environment.
Memorandum Of Association Constitution of Company.pptseri bangash
www.seribangash.com
A Memorandum of Association (MOA) is a legal document that outlines the fundamental principles and objectives upon which a company operates. It serves as the company's charter or constitution and defines the scope of its activities. Here's a detailed note on the MOA:
Contents of Memorandum of Association:
Name Clause: This clause states the name of the company, which should end with words like "Limited" or "Ltd." for a public limited company and "Private Limited" or "Pvt. Ltd." for a private limited company.
https://seribangash.com/article-of-association-is-legal-doc-of-company/
Registered Office Clause: It specifies the location where the company's registered office is situated. This office is where all official communications and notices are sent.
Objective Clause: This clause delineates the main objectives for which the company is formed. It's important to define these objectives clearly, as the company cannot undertake activities beyond those mentioned in this clause.
www.seribangash.com
Liability Clause: It outlines the extent of liability of the company's members. In the case of companies limited by shares, the liability of members is limited to the amount unpaid on their shares. For companies limited by guarantee, members' liability is limited to the amount they undertake to contribute if the company is wound up.
https://seribangash.com/promotors-is-person-conceived-formation-company/
Capital Clause: This clause specifies the authorized capital of the company, i.e., the maximum amount of share capital the company is authorized to issue. It also mentions the division of this capital into shares and their respective nominal value.
Association Clause: It simply states that the subscribers wish to form a company and agree to become members of it, in accordance with the terms of the MOA.
Importance of Memorandum of Association:
Legal Requirement: The MOA is a legal requirement for the formation of a company. It must be filed with the Registrar of Companies during the incorporation process.
Constitutional Document: It serves as the company's constitutional document, defining its scope, powers, and limitations.
Protection of Members: It protects the interests of the company's members by clearly defining the objectives and limiting their liability.
External Communication: It provides clarity to external parties, such as investors, creditors, and regulatory authorities, regarding the company's objectives and powers.
https://seribangash.com/difference-public-and-private-company-law/
Binding Authority: The company and its members are bound by the provisions of the MOA. Any action taken beyond its scope may be considered ultra vires (beyond the powers) of the company and therefore void.
Amendment of MOA:
While the MOA lays down the company's fundamental principles, it is not entirely immutable. It can be amended, but only under specific circumstances and in compliance with legal procedures. Amendments typically require shareholder
"𝑩𝑬𝑮𝑼𝑵 𝑾𝑰𝑻𝑯 𝑻𝑱 𝑰𝑺 𝑯𝑨𝑳𝑭 𝑫𝑶𝑵𝑬"
𝐓𝐉 𝐂𝐨𝐦𝐬 (𝐓𝐉 𝐂𝐨𝐦𝐦𝐮𝐧𝐢𝐜𝐚𝐭𝐢𝐨𝐧𝐬) is a professional event agency that includes experts in the event-organizing market in Vietnam, Korea, and ASEAN countries. We provide unlimited types of events from Music concerts, Fan meetings, and Culture festivals to Corporate events, Internal company events, Golf tournaments, MICE events, and Exhibitions.
𝐓𝐉 𝐂𝐨𝐦𝐬 provides unlimited package services including such as Event organizing, Event planning, Event production, Manpower, PR marketing, Design 2D/3D, VIP protocols, Interpreter agency, etc.
Sports events - Golf competitions/billiards competitions/company sports events: dynamic and challenging
⭐ 𝐅𝐞𝐚𝐭𝐮𝐫𝐞𝐝 𝐩𝐫𝐨𝐣𝐞𝐜𝐭𝐬:
➢ 2024 BAEKHYUN [Lonsdaleite] IN HO CHI MINH
➢ SUPER JUNIOR-L.S.S. THE SHOW : Th3ee Guys in HO CHI MINH
➢FreenBecky 1st Fan Meeting in Vietnam
➢CHILDREN ART EXHIBITION 2024: BEYOND BARRIERS
➢ WOW K-Music Festival 2023
➢ Winner [CROSS] Tour in HCM
➢ Super Show 9 in HCM with Super Junior
➢ HCMC - Gyeongsangbuk-do Culture and Tourism Festival
➢ Korean Vietnam Partnership - Fair with LG
➢ Korean President visits Samsung Electronics R&D Center
➢ Vietnam Food Expo with Lotte Wellfood
"𝐄𝐯𝐞𝐫𝐲 𝐞𝐯𝐞𝐧𝐭 𝐢𝐬 𝐚 𝐬𝐭𝐨𝐫𝐲, 𝐚 𝐬𝐩𝐞𝐜𝐢𝐚𝐥 𝐣𝐨𝐮𝐫𝐧𝐞𝐲. 𝐖𝐞 𝐚𝐥𝐰𝐚𝐲𝐬 𝐛𝐞𝐥𝐢𝐞𝐯𝐞 𝐭𝐡𝐚𝐭 𝐬𝐡𝐨𝐫𝐭𝐥𝐲 𝐲𝐨𝐮 𝐰𝐢𝐥𝐥 𝐛𝐞 𝐚 𝐩𝐚𝐫𝐭 𝐨𝐟 𝐨𝐮𝐫 𝐬𝐭𝐨𝐫𝐢𝐞𝐬."
Enterprise Excellence is Inclusive Excellence.pdfKaiNexus
Enterprise excellence and inclusive excellence are closely linked, and real-world challenges have shown that both are essential to the success of any organization. To achieve enterprise excellence, organizations must focus on improving their operations and processes while creating an inclusive environment that engages everyone. In this interactive session, the facilitator will highlight commonly established business practices and how they limit our ability to engage everyone every day. More importantly, though, participants will likely gain increased awareness of what we can do differently to maximize enterprise excellence through deliberate inclusion.
What is Enterprise Excellence?
Enterprise Excellence is a holistic approach that's aimed at achieving world-class performance across all aspects of the organization.
What might I learn?
A way to engage all in creating Inclusive Excellence. Lessons from the US military and their parallels to the story of Harry Potter. How belt systems and CI teams can destroy inclusive practices. How leadership language invites people to the party. There are three things leaders can do to engage everyone every day: maximizing psychological safety to create environments where folks learn, contribute, and challenge the status quo.
Who might benefit? Anyone and everyone leading folks from the shop floor to top floor.
Dr. William Harvey is a seasoned Operations Leader with extensive experience in chemical processing, manufacturing, and operations management. At Michelman, he currently oversees multiple sites, leading teams in strategic planning and coaching/practicing continuous improvement. William is set to start his eighth year of teaching at the University of Cincinnati where he teaches marketing, finance, and management. William holds various certifications in change management, quality, leadership, operational excellence, team building, and DiSC, among others.
Skye Residences | Extended Stay Residences Near Toronto Airportmarketingjdass
Experience unparalleled EXTENDED STAY and comfort at Skye Residences located just minutes from Toronto Airport. Discover sophisticated accommodations tailored for discerning travelers.
Website Link :
https://skyeresidences.com/
https://skyeresidences.com/about-us/
https://skyeresidences.com/gallery/
https://skyeresidences.com/rooms/
https://skyeresidences.com/near-by-attractions/
https://skyeresidences.com/commute/
https://skyeresidences.com/contact/
https://skyeresidences.com/queen-suite-with-sofa-bed/
https://skyeresidences.com/queen-suite-with-sofa-bed-and-balcony/
https://skyeresidences.com/queen-suite-with-sofa-bed-accessible/
https://skyeresidences.com/2-bedroom-deluxe-queen-suite-with-sofa-bed/
https://skyeresidences.com/2-bedroom-deluxe-king-queen-suite-with-sofa-bed/
https://skyeresidences.com/2-bedroom-deluxe-queen-suite-with-sofa-bed-accessible/
#Skye Residences Etobicoke, #Skye Residences Near Toronto Airport, #Skye Residences Toronto, #Skye Hotel Toronto, #Skye Hotel Near Toronto Airport, #Hotel Near Toronto Airport, #Near Toronto Airport Accommodation, #Suites Near Toronto Airport, #Etobicoke Suites Near Airport, #Hotel Near Toronto Pearson International Airport, #Toronto Airport Suite Rentals, #Pearson Airport Hotel Suites
What is the TDS Return Filing Due Date for FY 2024-25.pdfseoforlegalpillers
It is crucial for the taxpayers to understand about the TDS Return Filing Due Date, so that they can fulfill your TDS obligations efficiently. Taxpayers can avoid penalties by sticking to the deadlines and by accurate filing of TDS. Timely filing of TDS will make sure about the availability of tax credits. You can also seek the professional guidance of experts like Legal Pillers for timely filing of the TDS Return.
Attending a job Interview for B1 and B2 Englsih learnersErika906060
It is a sample of an interview for a business english class for pre-intermediate and intermediate english students with emphasis on the speking ability.
Cracking the Workplace Discipline Code Main.pptxWorkforce Group
Cultivating and maintaining discipline within teams is a critical differentiator for successful organisations.
Forward-thinking leaders and business managers understand the impact that discipline has on organisational success. A disciplined workforce operates with clarity, focus, and a shared understanding of expectations, ultimately driving better results, optimising productivity, and facilitating seamless collaboration.
Although discipline is not a one-size-fits-all approach, it can help create a work environment that encourages personal growth and accountability rather than solely relying on punitive measures.
In this deck, you will learn the significance of workplace discipline for organisational success. You’ll also learn
• Four (4) workplace discipline methods you should consider
• The best and most practical approach to implementing workplace discipline.
• Three (3) key tips to maintain a disciplined workplace.
23. 371377193.xlsx
Valuation: Residual Income 1 2 3 4
2013 2014 2015 2016
Net Earnings 1446.3 1480.6 1701.2 2002.1
Lagged Book Value Equity 4214.0 5295.3 5389.9 5520.3
Normal Earnings (Re * BVt-1) 207.8 261.1 265.7 272.2
Abnormal Earnings 1238.5 1219.5 1435.5 1730.0
Present Value Factors 0.953 0.908 0.866 0.825
PV Abnormal Earnings 1180.3 1107.6 1242.5 1427.1
Sum PV Abnormal Earnings thru Year +10 12,030.6 Sensitivity to growth
PV of Continuing Abnormal Earnings 35,532.1 98.80
Add: Beginning Book Value of Equity 4,214.0 0%
PV of Equity 51,776.7 1%
2%
Adjust to midyear 1.02 3%
Total PV Abnormal Earnings 53,053.01 4%
Shares Outstanding 537.00
Estimated Value per Share 99
Valuation: Dividends 1 2 3 4
2013 2014 2015 2016
Dividends 277.0 1268.3 1451.1 1746.0
(1+Re) 1.049 1.101 1.155 1.212
V0 264.0 1151.9 1256.0 1440.3
Sum of V0 11398.8
D t+1 1390.9 1404.3 1627.5 1931.8
Earnings 1446 1481 1701 2002
(1+g) 1.020 1.020 1.020 1.020
Earnings*(1+g) 1475.2 1510.2 1735.3 2042.2
24. 371377193.xlsx
BV t 4214.0 5295.3 5389.9 5520.3
BV t * (1+g) 4298.3 5401.2 5497.7 5630.7
(Re-g) 2.93% 2.93% 2.93% 2.93%
Vt
PV of Vt 40,278.69
V 51677.5 Sensitivity to growth
Midterm year 1.02 98
V 52711.06 0%
1% #REF!
Shares outstanding 537.00 2% #REF!
Value Per Share 98 3% #REF!
25. 371377193.xlsx
4% #REF!
Valuation:
Free Cash Flow for Common Equity
Ending Invested capital 14237.48
ROIC beyond horizon 15.80%
cost of equity 4.93%
growth 2.0%
Horizon value 67057.07
Present value of horizon 41442.68
PV of FCF 17580.63
Total PV 59023.31
Midterm Year 1.02
Value of operation 60203.78
Add non operating assets
Cash and temporary cash investments 238.00
Deposits in-transit 955.00
Value of enterprise 61396.78
Deduct debt
2734
6145
Noncontrolling interests 7
Total deduction 8886
Value of Common equity 52510.78
Shares outstanding 537.00
Current portion of long-term debt including obligations under
capital leases and financing obligations
Long-term debt including obligations under capital leases and
financing