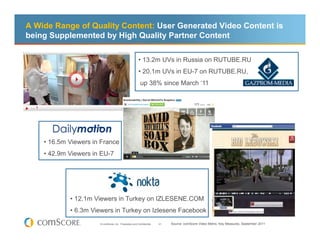
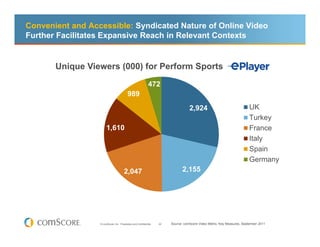
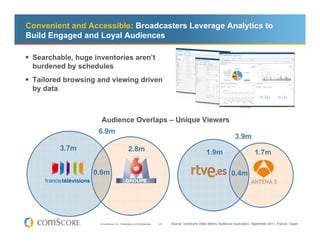
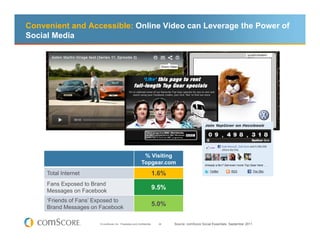
Download as PDF, PPTX
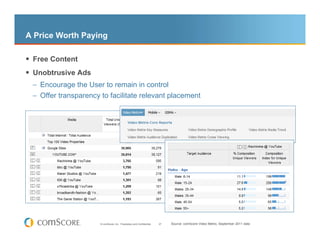
![A Price Worth Paying: Online Only and Cross Platform Audiences are
Growing Into TV Space
Cross-
Platform
Viewers 26%
TV Only
Viewers 67%
Online Only
Viewers 7%
Base sizes:
Total=2833
TV Only=1921
Online Only=189
Both TV/Online=723
‘How do you typically watch [original series TV]?’
Base: Persons who watched original series TV
© comScore, Inc. Proprietary and Confidential. 29 Research study conducted by comScore in US, May 2011](https://image.slidesharecdn.com/whensupplymetdemand-111121072932-phpapp01/85/When-supply-met_demand-29-320.jpg)
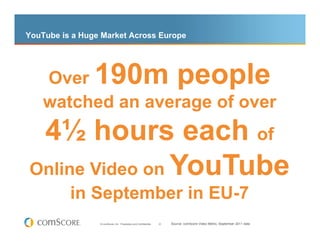
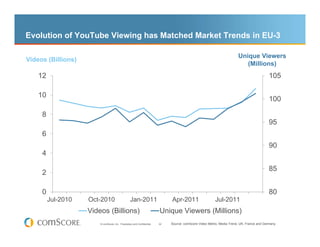
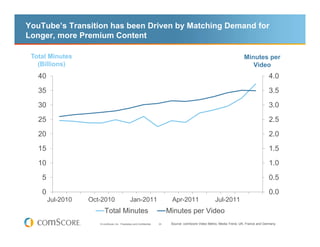


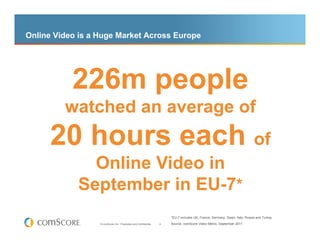
This document summarizes online video trends in Europe. It finds that while growth of unique viewers and video views slowed in 2010, consumption has since shifted to higher quality, longer videos. There is demand for a quality viewing experience, wide range of engaging content, convenient accessibility, and pricing worth paying. As supply meets this demand, online video is being driven by improved broadband, more content from broadcasters and local specialists, and user generated content supplemented by partners. Syndication and social media make video more accessible, while advanced advertising allows optimized campaigns and understanding of impact. Overall online video is becoming more integrated with television.


