Download to read offline
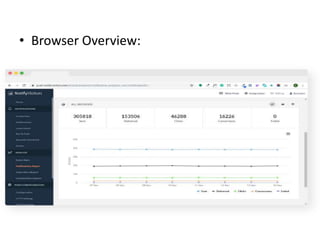

The document explains how to analyze push notification reports using the NV dashboard, focusing on the visualization of sent, delivered, and failed notifications over a specific time period. It outlines features such as date selection, graph types, campaign-specific insights, and key metrics like delivery, click-through, and conversion rates. Additionally, it highlights the importance of understanding subscriber engagement to optimize marketing strategies.


