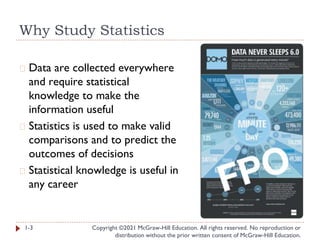
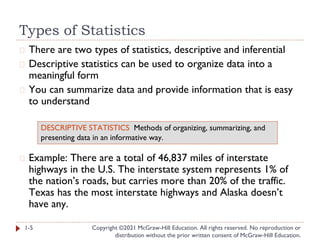
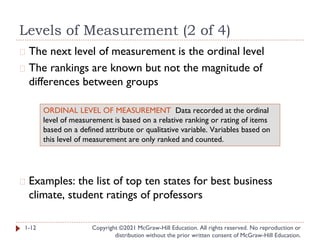
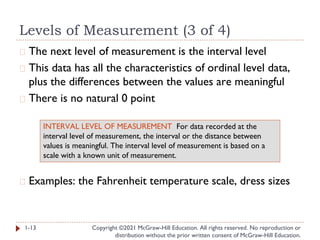
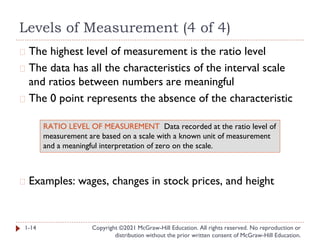
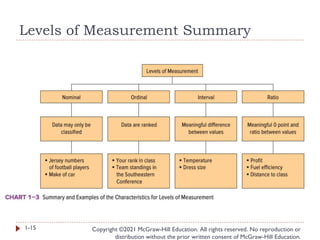
SlideShare a Scribd company logo
1 of 20
What is Statistics?
Chapter 1
Copyright ©2021 McGraw-Hill Education. All rights reserved. No reproduction or
distribution without the prior written consent of McGraw-Hill Education.
1-1
Learning Objectives
Copyright ©2021 McGraw-Hill Education. All rights reserved. No reproduction or distribution
without the prior written consent of McGraw-Hill Education.
LO1-1Explain why knowledge of statistics is important
LO1-2Define statistics and provide an example of how
statistics is applied
LO1-3Differentiate between descriptive and inferential
statistics
LO1-4Classify variables as qualitative or quantitative, and
discrete or continuous
LO1-5Distinguish between nominal, ordinal, interval, and
ratio levels of measurement
LO1-6List the values associated with the practice of
statistics
1-2
Why Study Statistics
Copyright ©2021 McGraw-Hill Education. All rights reserved. No reproduction or
distribution without the prior written consent of McGraw-Hill Education.
� Data are collected everywhere
and require statistical
knowledge to make the
information useful
� Statistics is used to make valid
comparisons and to predict the
outcomes of decisions
� Statistical knowledge is useful in
any career
1-3
What is Meant by Statistics
Copyright ©2021 McGraw-Hill Education. All rights reserved. No reproduction or
distribution without the prior written consent of McGraw-Hill Education.
� What is statistics?
� It’s more than presenting numerical facts
Example: The inflation rate for the calendar year was 0.7%. By
applying statistics we could compare this year’s inflation rate to
past observations of inflation. Is it higher, lower, or about the
same? Is there a trend of increasing or decreasing inflation? Is
there a relationship between interest rates and government
bonds?
1-4
STATISTICS The science of collecting, organizing, presenting, analyzing,
and interpreting data to assist in making more effective decisions.
Types of Statistics
Copyright ©2021 McGraw-Hill Education. All rights reserved. No reproduction or
distribution without the prior written consent of McGraw-Hill Education.
� There are two types of statistics, descriptive and inferential
� Descriptive statistics can be used to organize data into a
meaningful form
� You can summarize data and provide information that is easy
to understand
� Example: There are a total of 46,837 miles of interstate
highways in the U.S. The interstate system represents 1% of
the nation’s roads, but carries more than 20% of the traffic.
Texas has the most interstate highways and Alaska doesn’t
have any.
1-5
DESCRIPTIVE STATISTICS Methods of organizing, summarizing, and
presenting data in an informative way.
Types of Statistics (2 of 3)
Copyright ©2021 McGraw-Hill Education. All rights reserved. No reproduction or
distribution without the prior written consent of McGraw-Hill Education.
� Inferential statistics can be used to estimate properties of a
population
� You can make decisions based on a limited set of data
� Example: In 2015, a sample of U.S. Internal Revenue Service
tax preparation volunteers were tested with three standard
tax returns. The sample indicated that tax returns were
completed with a 49% accuracy rate. In other words, there
were errors on about half of the returns.
1-6
INFERENTIAL STATISTICS The methods used to estimate a property
of a population on the basis of a sample.
Types of Statistics (3 of 3)
Copyright ©2021 McGraw-Hill Education. All rights reserved. No reproduction or
distribution without the prior written consent of McGraw-Hill Education.
1-7
POPULATION The entire set of individuals or objects of interest or
the measurements obtained from all individuals or objects of interest.
SAMPLE A portion or part of the population of interest.
Types of Variables
Copyright ©2021 McGraw-Hill Education. All rights reserved. No reproduction or
distribution without the prior written consent of McGraw-Hill Education.
� There are two basic types of variables
1-8
QUALITATIVE VARIABLE An object or individual is observed and
recorded as a non-numeric characteristic or attribute.
Examples: gender, state of birth, eye color
QUANTITATIVE VARIABLE A variable that is reported numerically.
Examples: balance in your checking account, the life of a car battery,
the number of people employed by a company
Types of Variables (2 of 2)
Copyright ©2021 McGraw-Hill Education. All rights reserved. No reproduction or
distribution without the prior written consent of McGraw-Hill Education.
� Quantitative variables can be discrete or continuous
� Discrete variables are typically the result of counting
� Values have “gaps” between the values
� Examples: the number of bedrooms in a house (1, 2, 3,
4, etc.), the number of students in a statistics course
(326, 421, etc.)
� Continuous variables are usually the result of measuring
something
� Can assume any value within a specific range
� Examples: Duration of flights from Orlando to San
Diego (5.25 hours), grade point average (3.258)
1-9
Types of Variables Summary
Copyright ©2021 McGraw-Hill Education. All rights reserved. No reproduction or
distribution without the prior written consent of McGraw-Hill Education.
1-10
Levels of Measurement
Copyright ©2021 McGraw-Hill Education. All rights reserved. No reproduction or
distribution without the prior written consent of McGraw-Hill Education.
� There are four levels of measurement
� Nominal, ordinal, interval, and ratio
� The level of measurement determines the type of
statistical analysis that can be performed
� Nominal is the lowest level of measurement
� Examples: classifying M&M candies by color, identifying
students at a football game by gender
1-11
NOMINAL LEVEL OF MEASUREMENT Data recorded at the nominal
level of measurement is represented as labels or names. They have no
order. They can only be classified and counted.
Levels of Measurement (2 of 4)
Copyright ©2021 McGraw-Hill Education. All rights reserved. No reproduction or
distribution without the prior written consent of McGraw-Hill Education.
� The next level of measurement is the ordinal level
� The rankings are known but not the magnitude of
differences between groups
� Examples: the list of top ten states for best business
climate, student ratings of professors
1-12
ORDINAL LEVEL OF MEASUREMENT Data recorded at the ordinal
level of measurement is based on a relative ranking or rating of items
based on a defined attribute or qualitative variable. Variables based on
this level of measurement are only ranked and counted.
Levels of Measurement (3 of 4)
Copyright ©2021 McGraw-Hill Education. All rights reserved. No reproduction or
distribution without the prior written consent of McGraw-Hill Education.
� The next level of measurement is the interval level
� This data has all the characteristics of ordinal level data,
plus the differences between the values are meaningful
� There is no natural 0 point
� Examples: the Fahrenheit temperature scale, dress sizes
1-13
INTERVAL LEVEL OF MEASUREMENT For data recorded at the
interval level of measurement, the interval or the distance between
values is meaningful. The interval level of measurement is based on a
scale with a known unit of measurement.
Levels of Measurement (4 of 4)
Copyright ©2021 McGraw-Hill Education. All rights reserved. No reproduction or
distribution without the prior written consent of McGraw-Hill Education.
� The highest level of measurement is the ratio level
� The data has all the characteristics of the interval scale
and ratios between numbers are meaningful
� The 0 point represents the absence of the characteristic
� Examples: wages, changes in stock prices, and height
1-14
RATIO LEVEL OF MEASUREMENT Data recorded at the ratio level of
measurement are based on a scale with a known unit of measurement
and a meaningful interpretation of zero on the scale.
Levels of Measurement Summary
Copyright ©2021 McGraw-Hill Education. All rights reserved. No reproduction or
distribution without the prior written consent of McGraw-Hill Education.
1-15
Ethics and Statistics
Copyright ©2021 McGraw-Hill Education. All rights reserved. No reproduction or
distribution without the prior written consent of McGraw-Hill Education.
� Practice statistics with integrity and honesty when
collecting, organizing, summarizing, analyzing, and
interpreting numerical information
� Maintain an independent and principled point of view
when analyzing and reporting findings and results
� Question reports that are based on data that
� does not fairly represent the population
� does not include all relevant statistics
� introduces bias in an attempt to mislead or
misrepresent
1-16
Basic Business Analytics
Copyright ©2021 McGraw-Hill Education. All rights reserved. No reproduction or
distribution without the prior written consent of McGraw-Hill Education.
� Business Analytics is used to process and analyze data
and information to support a story or narrative of a
company
� Using computer software to summarize, organize,
analyze, and present the findings of statistical analysis is
essential
1-17
Chapter 1 Practice Problems
Copyright ©2021 McGraw-Hill Education. All rights reserved. No reproduction
or distribution without the prior written consent of McGraw-Hill Education.
1-18
Question 1
Copyright ©2021 McGraw-Hill Education. All rights reserved. No reproduction or
distribution without the prior written consent of McGraw-Hill Education.
1-19
What is the level of measurement for each of the following
variables?
a. Student IQ ratings
b. Distance students travel to class
c. The jersey numbers of a sorority soccer team
d. A student’s state of birth
e. A student’s academic class – that is, freshman,
sophomore, junior, or senior
f. Number of hours students study per week
LO1-5
Question 13
1-20
For each of the following, determine whether the variable is
continuous or discrete, quantitative or qualitative, and level of
measurement
a. Salary
b. Gender
c. Sales volume of MP3 players
d. Soft drink preference
e. Temperature
f. SAT scores
g. Student rank in class
h. Rating of a finance professor
i. Number of home video screens
LO1-4,5
Copyright ©2021 McGraw-Hill Education. All rights reserved. No reproduction or
distribution without the prior written consent of McGraw-Hill Education.

More Related Content

Similar to What is statistics (chapter - 1) PPT.pptx

lecture 1 applied econometrics and economic modeling
lecture 1 applied econometrics and economic modelinglecture 1 applied econometrics and economic modeling
lecture 1 applied econometrics and economic modelingstone55
 
Presentation1
Presentation1Presentation1
Presentation1girlie22
 
Salient eduhttp://www.gov.ph/k-12/
Salient eduhttp://www.gov.ph/k-12/Salient eduhttp://www.gov.ph/k-12/
Salient eduhttp://www.gov.ph/k-12/CHARMY22
 
Top Ten Best Practices In Federal Performance Reporting
Top Ten Best Practices In Federal Performance ReportingTop Ten Best Practices In Federal Performance Reporting
Top Ten Best Practices In Federal Performance ReportingMercatus Center
 
Stat11t Chapter1
Stat11t Chapter1Stat11t Chapter1
Stat11t Chapter1gueste87a4f
 
7jjjjjjjjjjjjjvcxzffghjknbvfhjknbvcduukkk
7jjjjjjjjjjjjjvcxzffghjknbvfhjknbvcduukkk7jjjjjjjjjjjjjvcxzffghjknbvfhjknbvcduukkk
7jjjjjjjjjjjjjvcxzffghjknbvfhjknbvcduukkkyeasmin75648
 
8 M&E: Data Sources
8 M&E: Data Sources8 M&E: Data Sources
8 M&E: Data SourcesTony
 
Unit 3 Qualitative Data
Unit 3 Qualitative DataUnit 3 Qualitative Data
Unit 3 Qualitative DataSherry Bailey
 
Salient Point of k 12
Salient Point of k 12 Salient Point of k 12
Salient Point of k 12 Naome Brao
 
STA003_WK1_L.pptx
STA003_WK1_L.pptxSTA003_WK1_L.pptx
STA003_WK1_L.pptxMAmir23
 
Business Statistics Chapter 1
Business Statistics Chapter 1Business Statistics Chapter 1
Business Statistics Chapter 1Lux PP
 

Similar to What is statistics (chapter - 1) PPT.pptx (20)

lecture 1 applied econometrics and economic modeling
lecture 1 applied econometrics and economic modelinglecture 1 applied econometrics and economic modeling
lecture 1 applied econometrics and economic modeling
 
Presentation1
Presentation1Presentation1
Presentation1
 
Salient eduhttp://www.gov.ph/k-12/
Salient eduhttp://www.gov.ph/k-12/Salient eduhttp://www.gov.ph/k-12/
Salient eduhttp://www.gov.ph/k-12/
 
Top Ten Best Practices In Federal Performance Reporting
Top Ten Best Practices In Federal Performance ReportingTop Ten Best Practices In Federal Performance Reporting
Top Ten Best Practices In Federal Performance Reporting
 
Stat11t chapter1
Stat11t chapter1Stat11t chapter1
Stat11t chapter1
 
Stat11t Chapter1
Stat11t Chapter1Stat11t Chapter1
Stat11t Chapter1
 
7jjjjjjjjjjjjjvcxzffghjknbvfhjknbvcduukkk
7jjjjjjjjjjjjjvcxzffghjknbvfhjknbvcduukkk7jjjjjjjjjjjjjvcxzffghjknbvfhjknbvcduukkk
7jjjjjjjjjjjjjvcxzffghjknbvfhjknbvcduukkk
 
Data Analytics .pptx
Data Analytics .pptxData Analytics .pptx
Data Analytics .pptx
 
Data Analytics Day 1.pptx
Data Analytics Day 1.pptxData Analytics Day 1.pptx
Data Analytics Day 1.pptx
 
bbs14e_ppt_ch02.pptx
bbs14e_ppt_ch02.pptxbbs14e_ppt_ch02.pptx
bbs14e_ppt_ch02.pptx
 
chapter_01_12.ppt
chapter_01_12.pptchapter_01_12.ppt
chapter_01_12.ppt
 
chapter_01_12 Accounting principles 1.ppt
chapter_01_12 Accounting principles 1.pptchapter_01_12 Accounting principles 1.ppt
chapter_01_12 Accounting principles 1.ppt
 
8 M&E: Data Sources
8 M&E: Data Sources8 M&E: Data Sources
8 M&E: Data Sources
 
Unit 3 Qualitative Data
Unit 3 Qualitative DataUnit 3 Qualitative Data
Unit 3 Qualitative Data
 
Chap001.ppt
Chap001.pptChap001.ppt
Chap001.ppt
 
bigDay1data
bigDay1databigDay1data
bigDay1data
 
1. Introduction to Data.pdf
1. Introduction to Data.pdf1. Introduction to Data.pdf
1. Introduction to Data.pdf
 
Salient Point of k 12
Salient Point of k 12 Salient Point of k 12
Salient Point of k 12
 
STA003_WK1_L.pptx
STA003_WK1_L.pptxSTA003_WK1_L.pptx
STA003_WK1_L.pptx
 
Business Statistics Chapter 1
Business Statistics Chapter 1Business Statistics Chapter 1
Business Statistics Chapter 1
 

Recently uploaded

24 ĐỀ THAM KHẢO KÌ THI TUYỂN SINH VÀO LỚP 10 MÔN TIẾNG ANH SỞ GIÁO DỤC HẢI DƯ...
24 ĐỀ THAM KHẢO KÌ THI TUYỂN SINH VÀO LỚP 10 MÔN TIẾNG ANH SỞ GIÁO DỤC HẢI DƯ...24 ĐỀ THAM KHẢO KÌ THI TUYỂN SINH VÀO LỚP 10 MÔN TIẾNG ANH SỞ GIÁO DỤC HẢI DƯ...
24 ĐỀ THAM KHẢO KÌ THI TUYỂN SINH VÀO LỚP 10 MÔN TIẾNG ANH SỞ GIÁO DỤC HẢI DƯ...Nguyen Thanh Tu Collection
 
How to Manage Website in Odoo 17 Studio App.pptx
How to Manage Website in Odoo 17 Studio App.pptxHow to Manage Website in Odoo 17 Studio App.pptx
How to Manage Website in Odoo 17 Studio App.pptxCeline George
 
An Overview of the Odoo 17 Knowledge App
An Overview of the Odoo 17 Knowledge AppAn Overview of the Odoo 17 Knowledge App
An Overview of the Odoo 17 Knowledge AppCeline George
 
diagnosting testing bsc 2nd sem.pptx....
diagnosting testing bsc 2nd sem.pptx....diagnosting testing bsc 2nd sem.pptx....
diagnosting testing bsc 2nd sem.pptx....Ritu480198
 
8 Tips for Effective Working Capital Management
8 Tips for Effective Working Capital Management8 Tips for Effective Working Capital Management
8 Tips for Effective Working Capital ManagementMBA Assignment Experts
 
Basic Civil Engineering notes on Transportation Engineering & Modes of Transport
Basic Civil Engineering notes on Transportation Engineering & Modes of TransportBasic Civil Engineering notes on Transportation Engineering & Modes of Transport
Basic Civil Engineering notes on Transportation Engineering & Modes of TransportDenish Jangid
 
Andreas Schleicher presents at the launch of What does child empowerment mean...
Andreas Schleicher presents at the launch of What does child empowerment mean...Andreas Schleicher presents at the launch of What does child empowerment mean...
Andreas Schleicher presents at the launch of What does child empowerment mean...EduSkills OECD
 
Book Review of Run For Your Life Powerpoint
Book Review of Run For Your Life PowerpointBook Review of Run For Your Life Powerpoint
Book Review of Run For Your Life Powerpoint23600690
 
AIM of Education-Teachers Training-2024.ppt
AIM of Education-Teachers Training-2024.pptAIM of Education-Teachers Training-2024.ppt
AIM of Education-Teachers Training-2024.pptNishitharanjan Rout
 
PSYPACT- Practicing Over State Lines May 2024.pptx
PSYPACT- Practicing Over State Lines May 2024.pptxPSYPACT- Practicing Over State Lines May 2024.pptx
PSYPACT- Practicing Over State Lines May 2024.pptxMarlene Maheu
 
Trauma-Informed Leadership - Five Practical Principles
Trauma-Informed Leadership - Five Practical PrinciplesTrauma-Informed Leadership - Five Practical Principles
Trauma-Informed Leadership - Five Practical PrinciplesPooky Knightsmith
 
UChicago CMSC 23320 - The Best Commit Messages of 2024
UChicago CMSC 23320 - The Best Commit Messages of 2024UChicago CMSC 23320 - The Best Commit Messages of 2024
UChicago CMSC 23320 - The Best Commit Messages of 2024Borja Sotomayor
 
SPLICE Working Group: Reusable Code Examples
SPLICE Working Group:Reusable Code ExamplesSPLICE Working Group:Reusable Code Examples
SPLICE Working Group: Reusable Code ExamplesPeter Brusilovsky
 
e-Sealing at EADTU by Kamakshi Rajagopal
e-Sealing at EADTU by Kamakshi Rajagopale-Sealing at EADTU by Kamakshi Rajagopal
e-Sealing at EADTU by Kamakshi RajagopalEADTU
 
Observing-Correct-Grammar-in-Making-Definitions.pptx
Observing-Correct-Grammar-in-Making-Definitions.pptxObserving-Correct-Grammar-in-Making-Definitions.pptx
Observing-Correct-Grammar-in-Making-Definitions.pptxAdelaideRefugio
 
會考英文會考英文會考英文會考英文會考英文會考英文會考英文會考英文會考英文會考英文會考英文
會考英文會考英文會考英文會考英文會考英文會考英文會考英文會考英文會考英文會考英文會考英文會考英文會考英文會考英文會考英文會考英文會考英文會考英文會考英文會考英文會考英文會考英文
會考英文會考英文會考英文會考英文會考英文會考英文會考英文會考英文會考英文會考英文會考英文中 央社
 
DEMONSTRATION LESSON IN ENGLISH 4 MATATAG CURRICULUM
DEMONSTRATION LESSON IN ENGLISH 4 MATATAG CURRICULUMDEMONSTRATION LESSON IN ENGLISH 4 MATATAG CURRICULUM
DEMONSTRATION LESSON IN ENGLISH 4 MATATAG CURRICULUMELOISARIVERA8
 
Đề tieng anh thpt 2024 danh cho cac ban hoc sinh
Đề tieng anh thpt 2024 danh cho cac ban hoc sinhĐề tieng anh thpt 2024 danh cho cac ban hoc sinh
Đề tieng anh thpt 2024 danh cho cac ban hoc sinhleson0603
 

Recently uploaded (20)

24 ĐỀ THAM KHẢO KÌ THI TUYỂN SINH VÀO LỚP 10 MÔN TIẾNG ANH SỞ GIÁO DỤC HẢI DƯ...
24 ĐỀ THAM KHẢO KÌ THI TUYỂN SINH VÀO LỚP 10 MÔN TIẾNG ANH SỞ GIÁO DỤC HẢI DƯ...24 ĐỀ THAM KHẢO KÌ THI TUYỂN SINH VÀO LỚP 10 MÔN TIẾNG ANH SỞ GIÁO DỤC HẢI DƯ...
24 ĐỀ THAM KHẢO KÌ THI TUYỂN SINH VÀO LỚP 10 MÔN TIẾNG ANH SỞ GIÁO DỤC HẢI DƯ...
 
How to Manage Website in Odoo 17 Studio App.pptx
How to Manage Website in Odoo 17 Studio App.pptxHow to Manage Website in Odoo 17 Studio App.pptx
How to Manage Website in Odoo 17 Studio App.pptx
 
An Overview of the Odoo 17 Knowledge App
An Overview of the Odoo 17 Knowledge AppAn Overview of the Odoo 17 Knowledge App
An Overview of the Odoo 17 Knowledge App
 
diagnosting testing bsc 2nd sem.pptx....
diagnosting testing bsc 2nd sem.pptx....diagnosting testing bsc 2nd sem.pptx....
diagnosting testing bsc 2nd sem.pptx....
 
8 Tips for Effective Working Capital Management
8 Tips for Effective Working Capital Management8 Tips for Effective Working Capital Management
8 Tips for Effective Working Capital Management
 
Mattingly "AI & Prompt Design: Named Entity Recognition"
Mattingly "AI & Prompt Design: Named Entity Recognition"Mattingly "AI & Prompt Design: Named Entity Recognition"
Mattingly "AI & Prompt Design: Named Entity Recognition"
 
Basic Civil Engineering notes on Transportation Engineering & Modes of Transport
Basic Civil Engineering notes on Transportation Engineering & Modes of TransportBasic Civil Engineering notes on Transportation Engineering & Modes of Transport
Basic Civil Engineering notes on Transportation Engineering & Modes of Transport
 
Andreas Schleicher presents at the launch of What does child empowerment mean...
Andreas Schleicher presents at the launch of What does child empowerment mean...Andreas Schleicher presents at the launch of What does child empowerment mean...
Andreas Schleicher presents at the launch of What does child empowerment mean...
 
Book Review of Run For Your Life Powerpoint
Book Review of Run For Your Life PowerpointBook Review of Run For Your Life Powerpoint
Book Review of Run For Your Life Powerpoint
 
AIM of Education-Teachers Training-2024.ppt
AIM of Education-Teachers Training-2024.pptAIM of Education-Teachers Training-2024.ppt
AIM of Education-Teachers Training-2024.ppt
 
PSYPACT- Practicing Over State Lines May 2024.pptx
PSYPACT- Practicing Over State Lines May 2024.pptxPSYPACT- Practicing Over State Lines May 2024.pptx
PSYPACT- Practicing Over State Lines May 2024.pptx
 
Trauma-Informed Leadership - Five Practical Principles
Trauma-Informed Leadership - Five Practical PrinciplesTrauma-Informed Leadership - Five Practical Principles
Trauma-Informed Leadership - Five Practical Principles
 
UChicago CMSC 23320 - The Best Commit Messages of 2024
UChicago CMSC 23320 - The Best Commit Messages of 2024UChicago CMSC 23320 - The Best Commit Messages of 2024
UChicago CMSC 23320 - The Best Commit Messages of 2024
 
SPLICE Working Group: Reusable Code Examples
SPLICE Working Group:Reusable Code ExamplesSPLICE Working Group:Reusable Code Examples
SPLICE Working Group: Reusable Code Examples
 
e-Sealing at EADTU by Kamakshi Rajagopal
e-Sealing at EADTU by Kamakshi Rajagopale-Sealing at EADTU by Kamakshi Rajagopal
e-Sealing at EADTU by Kamakshi Rajagopal
 
Observing-Correct-Grammar-in-Making-Definitions.pptx
Observing-Correct-Grammar-in-Making-Definitions.pptxObserving-Correct-Grammar-in-Making-Definitions.pptx
Observing-Correct-Grammar-in-Making-Definitions.pptx
 
會考英文會考英文會考英文會考英文會考英文會考英文會考英文會考英文會考英文會考英文會考英文
會考英文會考英文會考英文會考英文會考英文會考英文會考英文會考英文會考英文會考英文會考英文會考英文會考英文會考英文會考英文會考英文會考英文會考英文會考英文會考英文會考英文會考英文
會考英文會考英文會考英文會考英文會考英文會考英文會考英文會考英文會考英文會考英文會考英文
 
DEMONSTRATION LESSON IN ENGLISH 4 MATATAG CURRICULUM
DEMONSTRATION LESSON IN ENGLISH 4 MATATAG CURRICULUMDEMONSTRATION LESSON IN ENGLISH 4 MATATAG CURRICULUM
DEMONSTRATION LESSON IN ENGLISH 4 MATATAG CURRICULUM
 
Mattingly "AI and Prompt Design: LLMs with NER"
Mattingly "AI and Prompt Design: LLMs with NER"Mattingly "AI and Prompt Design: LLMs with NER"
Mattingly "AI and Prompt Design: LLMs with NER"
 
Đề tieng anh thpt 2024 danh cho cac ban hoc sinh
Đề tieng anh thpt 2024 danh cho cac ban hoc sinhĐề tieng anh thpt 2024 danh cho cac ban hoc sinh
Đề tieng anh thpt 2024 danh cho cac ban hoc sinh
 

What is statistics (chapter - 1) PPT.pptx

  • 1. What is Statistics? Chapter 1 Copyright ©2021 McGraw-Hill Education. All rights reserved. No reproduction or distribution without the prior written consent of McGraw-Hill Education. 1-1
  • 2. Learning Objectives Copyright ©2021 McGraw-Hill Education. All rights reserved. No reproduction or distribution without the prior written consent of McGraw-Hill Education. LO1-1Explain why knowledge of statistics is important LO1-2Define statistics and provide an example of how statistics is applied LO1-3Differentiate between descriptive and inferential statistics LO1-4Classify variables as qualitative or quantitative, and discrete or continuous LO1-5Distinguish between nominal, ordinal, interval, and ratio levels of measurement LO1-6List the values associated with the practice of statistics 1-2
  • 3. Why Study Statistics Copyright ©2021 McGraw-Hill Education. All rights reserved. No reproduction or distribution without the prior written consent of McGraw-Hill Education. � Data are collected everywhere and require statistical knowledge to make the information useful � Statistics is used to make valid comparisons and to predict the outcomes of decisions � Statistical knowledge is useful in any career 1-3
  • 4. What is Meant by Statistics Copyright ©2021 McGraw-Hill Education. All rights reserved. No reproduction or distribution without the prior written consent of McGraw-Hill Education. � What is statistics? � It’s more than presenting numerical facts Example: The inflation rate for the calendar year was 0.7%. By applying statistics we could compare this year’s inflation rate to past observations of inflation. Is it higher, lower, or about the same? Is there a trend of increasing or decreasing inflation? Is there a relationship between interest rates and government bonds? 1-4 STATISTICS The science of collecting, organizing, presenting, analyzing, and interpreting data to assist in making more effective decisions.
  • 5. Types of Statistics Copyright ©2021 McGraw-Hill Education. All rights reserved. No reproduction or distribution without the prior written consent of McGraw-Hill Education. � There are two types of statistics, descriptive and inferential � Descriptive statistics can be used to organize data into a meaningful form � You can summarize data and provide information that is easy to understand � Example: There are a total of 46,837 miles of interstate highways in the U.S. The interstate system represents 1% of the nation’s roads, but carries more than 20% of the traffic. Texas has the most interstate highways and Alaska doesn’t have any. 1-5 DESCRIPTIVE STATISTICS Methods of organizing, summarizing, and presenting data in an informative way.
  • 6. Types of Statistics (2 of 3) Copyright ©2021 McGraw-Hill Education. All rights reserved. No reproduction or distribution without the prior written consent of McGraw-Hill Education. � Inferential statistics can be used to estimate properties of a population � You can make decisions based on a limited set of data � Example: In 2015, a sample of U.S. Internal Revenue Service tax preparation volunteers were tested with three standard tax returns. The sample indicated that tax returns were completed with a 49% accuracy rate. In other words, there were errors on about half of the returns. 1-6 INFERENTIAL STATISTICS The methods used to estimate a property of a population on the basis of a sample.
  • 7. Types of Statistics (3 of 3) Copyright ©2021 McGraw-Hill Education. All rights reserved. No reproduction or distribution without the prior written consent of McGraw-Hill Education. 1-7 POPULATION The entire set of individuals or objects of interest or the measurements obtained from all individuals or objects of interest. SAMPLE A portion or part of the population of interest.
  • 8. Types of Variables Copyright ©2021 McGraw-Hill Education. All rights reserved. No reproduction or distribution without the prior written consent of McGraw-Hill Education. � There are two basic types of variables 1-8 QUALITATIVE VARIABLE An object or individual is observed and recorded as a non-numeric characteristic or attribute. Examples: gender, state of birth, eye color QUANTITATIVE VARIABLE A variable that is reported numerically. Examples: balance in your checking account, the life of a car battery, the number of people employed by a company
  • 9. Types of Variables (2 of 2) Copyright ©2021 McGraw-Hill Education. All rights reserved. No reproduction or distribution without the prior written consent of McGraw-Hill Education. � Quantitative variables can be discrete or continuous � Discrete variables are typically the result of counting � Values have “gaps” between the values � Examples: the number of bedrooms in a house (1, 2, 3, 4, etc.), the number of students in a statistics course (326, 421, etc.) � Continuous variables are usually the result of measuring something � Can assume any value within a specific range � Examples: Duration of flights from Orlando to San Diego (5.25 hours), grade point average (3.258) 1-9
  • 10. Types of Variables Summary Copyright ©2021 McGraw-Hill Education. All rights reserved. No reproduction or distribution without the prior written consent of McGraw-Hill Education. 1-10
  • 11. Levels of Measurement Copyright ©2021 McGraw-Hill Education. All rights reserved. No reproduction or distribution without the prior written consent of McGraw-Hill Education. � There are four levels of measurement � Nominal, ordinal, interval, and ratio � The level of measurement determines the type of statistical analysis that can be performed � Nominal is the lowest level of measurement � Examples: classifying M&M candies by color, identifying students at a football game by gender 1-11 NOMINAL LEVEL OF MEASUREMENT Data recorded at the nominal level of measurement is represented as labels or names. They have no order. They can only be classified and counted.
  • 12. Levels of Measurement (2 of 4) Copyright ©2021 McGraw-Hill Education. All rights reserved. No reproduction or distribution without the prior written consent of McGraw-Hill Education. � The next level of measurement is the ordinal level � The rankings are known but not the magnitude of differences between groups � Examples: the list of top ten states for best business climate, student ratings of professors 1-12 ORDINAL LEVEL OF MEASUREMENT Data recorded at the ordinal level of measurement is based on a relative ranking or rating of items based on a defined attribute or qualitative variable. Variables based on this level of measurement are only ranked and counted.
  • 13. Levels of Measurement (3 of 4) Copyright ©2021 McGraw-Hill Education. All rights reserved. No reproduction or distribution without the prior written consent of McGraw-Hill Education. � The next level of measurement is the interval level � This data has all the characteristics of ordinal level data, plus the differences between the values are meaningful � There is no natural 0 point � Examples: the Fahrenheit temperature scale, dress sizes 1-13 INTERVAL LEVEL OF MEASUREMENT For data recorded at the interval level of measurement, the interval or the distance between values is meaningful. The interval level of measurement is based on a scale with a known unit of measurement.
  • 14. Levels of Measurement (4 of 4) Copyright ©2021 McGraw-Hill Education. All rights reserved. No reproduction or distribution without the prior written consent of McGraw-Hill Education. � The highest level of measurement is the ratio level � The data has all the characteristics of the interval scale and ratios between numbers are meaningful � The 0 point represents the absence of the characteristic � Examples: wages, changes in stock prices, and height 1-14 RATIO LEVEL OF MEASUREMENT Data recorded at the ratio level of measurement are based on a scale with a known unit of measurement and a meaningful interpretation of zero on the scale.
  • 15. Levels of Measurement Summary Copyright ©2021 McGraw-Hill Education. All rights reserved. No reproduction or distribution without the prior written consent of McGraw-Hill Education. 1-15
  • 16. Ethics and Statistics Copyright ©2021 McGraw-Hill Education. All rights reserved. No reproduction or distribution without the prior written consent of McGraw-Hill Education. � Practice statistics with integrity and honesty when collecting, organizing, summarizing, analyzing, and interpreting numerical information � Maintain an independent and principled point of view when analyzing and reporting findings and results � Question reports that are based on data that � does not fairly represent the population � does not include all relevant statistics � introduces bias in an attempt to mislead or misrepresent 1-16
  • 17. Basic Business Analytics Copyright ©2021 McGraw-Hill Education. All rights reserved. No reproduction or distribution without the prior written consent of McGraw-Hill Education. � Business Analytics is used to process and analyze data and information to support a story or narrative of a company � Using computer software to summarize, organize, analyze, and present the findings of statistical analysis is essential 1-17
  • 18. Chapter 1 Practice Problems Copyright ©2021 McGraw-Hill Education. All rights reserved. No reproduction or distribution without the prior written consent of McGraw-Hill Education. 1-18
  • 19. Question 1 Copyright ©2021 McGraw-Hill Education. All rights reserved. No reproduction or distribution without the prior written consent of McGraw-Hill Education. 1-19 What is the level of measurement for each of the following variables? a. Student IQ ratings b. Distance students travel to class c. The jersey numbers of a sorority soccer team d. A student’s state of birth e. A student’s academic class – that is, freshman, sophomore, junior, or senior f. Number of hours students study per week LO1-5
  • 20. Question 13 1-20 For each of the following, determine whether the variable is continuous or discrete, quantitative or qualitative, and level of measurement a. Salary b. Gender c. Sales volume of MP3 players d. Soft drink preference e. Temperature f. SAT scores g. Student rank in class h. Rating of a finance professor i. Number of home video screens LO1-4,5 Copyright ©2021 McGraw-Hill Education. All rights reserved. No reproduction or distribution without the prior written consent of McGraw-Hill Education.