Metals: Steel prices ski jumping off steepened Chinese slope - Motilal Oswal
•
1 like•402 views

Iron ore prices after gaining mid-week – touching USD85/t – closed the week slightly lower than USD82/t. Coking coal recovered USD2/t closing at USD110/t. Chinese steel prices were down 4 to 6% WoW. This doesn’t augur well for Indian import prices.

Recommended
More Related Content
Similar to Metals: Steel prices ski jumping off steepened Chinese slope - Motilal Oswal
Similar to Metals: Steel prices ski jumping off steepened Chinese slope - Motilal Oswal (20)
More from IndiaNotes.com
More from IndiaNotes.com (20)
Recently uploaded
Recently uploaded (20)
Metals: Steel prices ski jumping off steepened Chinese slope - Motilal Oswal
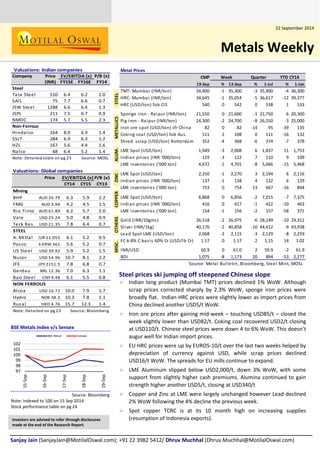
- 1. Valuations: Global companiesPriceP/B (x) CY14CY15CY13MiningBHPAUD 35.796.35.92.2FMGAUD 3.944.24.51.5Rio TintoAUD 61.896.25.72.0ValeUSD 25.245.04.80.9Teck Res.USD 21.357.86.40.7STEEL A. MittalEUR 11.0556.15.20.5Poscok KRW 3615.65.20.7US SteelUSD 39.925.95.21.5NucorUSD 54.9610.78.12.2JFEJPY 2151.57.86.80.7GerdauBRL 12.367.06.31.1Bao SteelCNY 4.486.15.50.8NON FERROUSAlcoaUSD 16.7210.07.91.7HydroNOK 38.310.37.81.1RusalHKD 4.7615.712.31.4Note: Detailed on pg 23Source: BloombergEV/EBITDA (x) BSE Metals Index v/s Sensex 979899100101102 15-Sep16-Sep17-Sep18-Sep19-Sep BSE MetalSensex Source: Bloomberg Note: Indexed to 100 on 15 Sep 2014 Stock performance table on pg 24 Investors are advised to refer through disclosures made at the end of the Research Report. Steel prices ski jumping off steepened Chinese slope Indian long product (Mumbai TMT) prices declined 1% WoW. Although scrap prices corrected sharply by 2.3% WoW, sponge iron prices were broadly flat. Indian HRC prices were slightly lower as import prices from China declined another USD5/t WoW. Iron ore prices after gaining mid-week – touching USD85/t – closed the week slightly lower than USD82/t. Coking coal recovered USD2/t closing at USD110/t. Chinese steel prices were down 4 to 6% WoW. This doesn’t augur well for Indian import prices. EU HRC prices were up by EURO5-10/t over the last two weeks helped by depreciation of currency against USD, while scrap prices declined USD16/t WoW. The spreads for EU mills continue to expand. LME Aluminum slipped below USD2,000/t, down 3% WoW, with some support from slightly higher cash premiums. Alumina continued to gain strength higher another USD5/t, closing at USD340/t Copper and Zinc at LME were largely unchanged however Lead declined 2% WoW following the 4% decline the previous week. Spot copper TCRC is at its 10 month high on increasing supplies (resumption of Indonesia exports). Sanjay Jain (SanjayJain@MotilalOswal.com); +91 22 3982 5412/ Dhruv Muchhal (Dhruv.Muchhal@MotilalOswal.com) STEEL METALLICS ALUM. ZINC COPPER OTHERS MISC. Valuations: Indian companiesCompanyPriceP/B (x) (INR)FY15EFY16EFY14SteelTata Steel5106.46.22.0SAIL757.76.60.7JSW Steel12886.66.41.3JSPL2117.56.70.9NMDC1745.75.52.3Non-FerrousHindalco 1648.06.91.4SSLT2846.96.31.2HZL1675.64.41.6Nalco686.45.21.4Note: Detailed table on pg 23Source: MOSLEV/EBITDA (x) Metals Weekly 22 September 2014 Metal PricesCMP19-Sep%12-Sep%1-Jul%1-JanTMT- Mumbai (INR/ton)34,900-135,300-335,900-436,300HRC- Mumbai (INR/ton)34,645-135,054-536,617-1239,377HRC (USD/ton) fob CIS540054205381533Sponge iron - Raipur (INR/ton)21,550021,600-121,750620,300Pig iron - Raipur (INR/ton)24,300-224,700-826,550-325,000Iron ore spot (USD/ton) cfr China82082-1495-39135Coking coal (USD/ton) fob Aus.11121080111-16132Shred. scrap (USD/ton) Rotterdam352-4368-6374-7378LME Spot (USD/ton)1,949-32,00861,837111,753Indian prices (INR ‘000/ton)119-312271109109LME inventories (‘000 ton)4,672-14,701-85,066-155,468LME Spot (USD/ton)2,250-12,27032,19462,116Indian prices (INR ‘000/ton)137-113841326129LME inventories (‘000 ton)753075413667-16894LME Spot (USD/ton)6,86806,856-27,015-77,375Indian prices (INR ‘000/ton)4160417-1422-10463LME inventories (‘000 ton)154-1156-2157-58371Gold (INR/10gms)26,518-226,975-628,149-1029,312Sliver (INR/1kg)40,176-240,858-1044,412-943,938Lead Spot LME (USD/ton)2,068-22,115-32,129-82,259FC 6-8% C basis 60% Cr (USD/lb Cr)1.1701.1721.15141.02INR/USD60.9061.0259.9-261.9BDI1,075-81,17320894-532,277Source: Metal Bulletin, Bloomberg, Steel Mint, MOSLWeekQuarterYTD CY14
- 2. 22 September 2014 2 Metals Weekly Contents Page No. Ferrous 3-10 India 3 & 4 European Union 5 China 6 Other regions 7 & 8 Steel raw material 9 & 10 Ferro alloys 11 Non-ferrous 12-18 Aluminum 12 Copper 14 Zinc 15 Lead 16 Commodity curve analysis 17 China non-ferrous trade data 18 Key indicators 19-20 Industrial production growth across the globe 21 BSE announcements 22 Metals valuation matrix 23 Metals stock performance 24
- 3. 22 September 2014 3 Metals Weekly Ferrous INDIA Indian flat steel prices import parity (INR/T, exl. ED & VAT) 33,00035,00037,00039,00041,00043,000 Sep-13Oct-13Nov-13Dec-13Jan-14Feb-14Mar-14Apr-14May-14Jun-14Jul-14Aug-14Sep-14 HRC Mumbai (INR/t) Indian long steel price (INR/T, exl. ED & VAT) 32,00034,00036,00038,000 Sep-13Oct-13Nov-13Dec-13Jan-14Jan-14Feb-14Mar-14Apr-14May-14Jun-14Jun-14Jul-14Aug-14Sep-14TMT Mumbai (INR/t) Steel intermediates prices (INR/T, exl. ED & VAT) 19,00020,00021,00022,00023,00024,000 Sep-13Oct-13Nov-13Dec-13Jan-14Feb-14Mar-14Apr-14May-14Jun-14Jul-14Aug-14Sep-14 Sponge (Raipur) India: Monthly crude steel production -5.00.05.010.015.06.256.506.757.007.25 Sep-12Nov-12Jan-13Mar-13May-13Jul-13Sep-13Nov-13Jan-14Mar-14May-14Jul-14YoY (%) (m tons)IndiaYoY (%) Source: SteelMint, WSA, MOSL India HRC import prices declined further, down USD5/t WoW to now USD515/t. TMT (Mumbai) prices remain under pressure on lower China import prices and were down for the second consecutive week now. WoW prices contracted by 1.1%. Sponge iron continues to look sluggish on both lack of demand and China long product pricing pressure. Ferrous Steel demand remains sluggish having grown by just 0.7% YTD July. Aug flash print indicates YTD growth at 0.3% (Apr- Aug).
- 4. 22 September 2014 4 Metals Weekly Ferrous INDIA Scrap Mandi (INR/t) 22,00023,00024,00025,00026,00027,00028,000 Sep-13Oct-13Nov-13Dec-13Jan-14Feb-14Mar-14Apr-14May-14Jun-14Jul-14Aug-14 Scrap (Mandi) Iron ore lumps (INR/t) 4,000 5,000 6,000 7,000 8,000 9,000 Sep-12Nov-12Jan-13Mar-13May-13Jul-13Sep-13Nov-13Jan-14Mar-14May-14Jul-14Sep-14NMDC 6-40mm (CG)Lumps 5-18 (Odisha) Iron ore fines (INR/t) ex mine 1,400 1,800 2,200 2,600 3,000 3,400 Sep-12Nov-12Feb-13May-13Jul-13Oct-13Jan-14Mar-14Jun-14Sep-14 Fines 63% (Odisha)NMDC Fines Pellet (Barbil) INR/t 6,0006,5007,0007,5008,0008,5009,000 Dec-13Jan-14Jan-14Feb-14Mar-14Apr-14May-14Jun-14Jul-14Aug-14Sep-14 Pellet (Barbil) Source: SteelMint, WSA, MOSL Ferrous Pellet prices were flat WoW. Scrap prices saw sharp correction, down 2.3% WoW. Since July, scrap is down by about INR3,000/t as against TMT by INR1,000/t and Sponge iron largely unchanged. Iron ore prices were unchanged as lower international prices have made domestic iron ore uneconomical for some of the steel plants. Prices of iron ore fines by NMDC are unchanged.
- 5. 22 September 2014 5 Metals Weekly European Union European HRC prices (EUR/ton) 375 425 475 525 Sep-12Nov-12Jan-13Mar-13May-13Jun-13Aug-13Oct-13Dec-13Feb-14Apr-14May-14Jul-14Sep-14 North Europe HRCSouth Europe HRC Rotterdam: shredded scrap prices (USD/t) 320350380410 Sep-12Nov-12Jan-13Mar-13May-13Jun-13Aug-13Oct-13Dec-13Feb-14Apr-14May-14Jul-14Sep-14 European wire rods southern region (Euro/t) 450470490510530550 Sep-12Nov-12Jan-13Mar-13May-13Jul-13Sep-13Nov-13Jan-14Mar-14May-14Jul-14Sep-14 Spreads ( HRC-1.6xiron ore-0.7xcoking coal) – (USD/t) 180235290345400 Oct-10Dec-10Feb-11Apr-11Jun-11Aug-11Oct-11Dec-11Feb-12Apr-12Jun-12Aug-12Oct-12Dec-12Feb-13Apr-13Jun-13Aug-13Oct-13Dec-13Feb-14Apr-14Jun-14Aug-14 EUChina Source: Metal Bulletin, Bloomberg, WSA, MOSL HRC prices continued to strengthen with prices up by EURO5-10/t over last two weeks. Dollar strength is providing support. Rotterdam scrap saw a sharp decline, down 4.4%, losing USD16/t WoW. Low iron ore and dollar strength are the factors, in our view. South Europe wire rod prices were unchanged Europe spreads are close to one year high on weak across the board raw material prices and strength in HRC on Euro depreciation.
- 6. 22 September 2014 6 Metals Weekly China China domestic prices (USD/ton) 400500600700800900 Sep-08Jan-09May-09Sep-09Jan-10May-10Sep-10Jan-11May-11Sep-11Jan-12May-12Sep-12Jan-13May-13Sep-13Jan-14May-14Sep-14 HRCRebar Steel spreads (Steel price – 1.6x iron ore – 0.55x coke) for Chinese producers 140185230275320 Jun-10Sep-10Dec-10Mar-11Jun-11Sep-11Dec-11Mar-12Jun-12Sep-12Dec-12Mar-13Jun-13Sep-13Dec-13Mar-14Jun-14Sep-14 HRCRebar Steel trade (m ton) 02468 Sep-12Nov-12Jan-13Mar-13May-13Jul-13Sep-13Nov-13Jan-14Mar-14May-14Jul-14 ExportsImports Steel inventories in main China cities (m tons) 456789 Dec-12Mar-13May-13Jul-13Sep-13Dec-13Feb-14Apr-14Jul-14Sep-14 China long/flat prices were down by 4-6% WoW. Since July China prices are down by 10-12% However spreads remain healthy on weakening iron ore/coking coal prices Given weak domestic market, China continues to look to exports. Exports in July at 7.5mt, were highest in history, up 14% MoM Steel inventories are declining on tighter credit
- 7. 22 September 2014 7 Metals Weekly Other regions CIS HRC export prices (USD/ton) fob basis 510520530540550 Oct-13Nov-13Dec-13Jan-14Mar-14Apr-14May-14Jun-14Jul-14Sep-14 CIS Exports (HRC) Turkish export billets (USD/ton) 500520540560 Oct-13Nov-13Dec-13Jan-14Feb-14Mar-14Apr-14May-14Jun-14Jul-14Aug-14Sep-14 Turkish Exp Billets North America HRC prices (USD/ton) 600625650675700 Oct-13Nov-13Dec-13Jan-14Feb-14Mar-14Apr-14May-14Jun-14Jul-14Aug-14Sep-14 CIS: Monthly crude steel production -10-505108.0 8.5 9.0 9.5 10.0 Jun-12Sep-12Nov-12Jan-13Mar-13May-13Jul-13Sep-13Nov-13Jan-14Mar-14May-14Jul-14YoY (%) (m tons) CISYoY (%) Source: Metal Bulletin, WSA, Bloomberg, MOSL CIS export prices were lower by USD2/t WoW US HRC was down USD5/t and about USD10/t lower since beginning Sep. Lower international prices is weighting on US HRC. CIS countries crude steel production growth was positive for 3rd consecutive month, rising by 2.1% in July 2014 Turkey billet exports were lower by USD5/t.
- 8. 22 September 2014 8 Metals Weekly Other regions North America: Monthly crude steel production -15.0-7.50.07.515.09.0 9.5 10.0 10.5 11.0 Jun-12Sep-12Nov-12Jan-13Mar-13May-13Jul-13Sep-13Nov-13Jan-14Mar-14May-14Jul-14YoY (%) (m tons) North AmericaYoY (%) Global: Monthly crude steel production -202468120 125 130 135 140 145 Jul-12Sep-12Nov-12Jan-13Mar-13May-13Jul-13Sep-13Nov-13Jan-14Mar-14May-14Jul-14YoY (%) (m tons) GlobalYoY (%) Global: Monthly crude steel capacity utilization 69 72 75 78 81 84 Jul-12Sep-12Nov-12Jan-13Mar-13May-13Jul-13Sep-13Nov-13Jan-14Mar-14May-14Jul-14 Capacity Utilization Source: Bloomberg, WSA, MOSL After 6 consecutive months of positive production growth momentum, July was slower at 2.2% Global crude steel production increased 3% YoY to 137m tons in July Global capacity utilization declined 300bp MoM / 100bp YoY to 75.4% in July
- 9. 22 September 2014 9 Metals Weekly Steel raw materials Import price of 62% grade iron-ore fines in China (USD/ton) 658095110125140 Sep-13Oct-13Nov-13Dec-13Dec-13Jan-14Feb-14Mar-14Apr-14May-14May-14Jun-14Jul-14Aug-14Sep-14 CIFFOB OTC iron-ore swaps (USD/ton) 80859095100105110115 15-Mar-1422-Mar-1429-Mar-145-Apr-1412-Apr-1419-Apr-1426-Apr-143-May-1410-May-1417-May-1424-May-1431-May-147-Jun-1414-Jun-1421-Jun-1428-Jun-145-Jul-1412-Jul-1419-Jul-1426-Jul-142-Aug-149-Aug-1416-Aug-1423-Aug-1430-Aug-146-Sep-1413-Sep-1420-Sep-14 20151Q154Q14 China iron-ore production and imports (m tons) 445056626830 60 90 120 150 Sep-12Nov-12Jan-13Mar-13May-13Jul-13Sep-13Nov-13Jan-14Mar-14May-14Jul-14 Ore ImportsOre ProdPig iron prod (RHS) China iron-ore inventories (mt) 60708090100110Oct-12Dec-12Feb-13Apr-13May-13Jul-13Sep-13Nov-13Dec-13Feb-14Apr-14Jun-14Jul-14 Source: Metal Bulletin, Bloomberg, MOSL After gaining strength mid- week, touching USD85/t, iron ore is down back to USD82/t. China iron ore inventories are inching higher. Steel mills inventories too are high, according to media China iron ore imports increased 11% MoM Iron ore forward prices too fell along with spot prices
- 10. 22 September 2014 10 Metals Weekly Steel raw materials Freight rates to China (USD/ton) 08162432 Sep-12Oct-12Nov-12Dec-12Jan-13Feb-13Mar-13Apr-13May-13Jun-13Jul-13Aug-13Sep-13Oct-13Nov-13Dec-13Jan-14Feb-14Mar-14Apr-14May-14Jun-14Jul-14Aug-14 BrazilAustraliaIndia Coal price index 65 75 85 95 Sep-12Nov-12Jan-13Apr-13Jun-13Aug-13Oct-13Dec-13Feb-14Apr-14Jul-14Sep-14 Richards Bay Steam Coal Coke price index (fob China) 180 230 280 330 380 Aug-12Oct-12Dec-12Feb-13Apr-13Jun-13Aug-13Oct-13Dec-13Feb-14Apr-14Jun-14Aug-14USD/t China coke export spot (LHS) Coking coal (USD/t) 100120140160180 Nov-12Jan-13Mar-13May-13Jul-13Sep-13Nov-13Jan-14Mar-14May-14Jul-14Sep-14 Spot coking coal (fob Australia) Coking coal recovered slightly to USD110/t vs. previous week close of USD108/t Thermal coal declined further USD1/t now trading at USD67.9/t. Since July thermal coal is down by about USD5/t Bulk sea freights were slightly lower WoW.
- 11. 22 September 2014 11 Metals Weekly Ferro alloys China’s imports of manganese ore and concentrate 130160190220250280500 800 1,100 1,400 1,700 2,000 Oct-12Dec-12Feb-13Apr-13Jun-13Aug-13Oct-13Dec-13Feb-14Apr-14Jun-14Aug-14USD/t'000 tons ImportsPrices (RHS) Chrome ore FOB spot prices 140160180200 Oct-12Nov-12Dec-12Jan-13Feb-13Mar-13May-13Jun-13Jul-13Aug-13Sep-13Oct-13Nov-13Jan-14Feb-14Mar-14Apr-14May-14Jun-14Aug-14Sep-14USD/ton 40% Chrome Africa Ferro chrome CIF prices (CNY/t) 5,500 7,000 8,500 10,000 11,500 Oct-12Dec-12Feb-13Apr-13Jun-13Aug-13Oct-13Dec-13Feb-14Apr-14Jun-14Aug-14 Fe Chrome 50% Cr ChinaFe Chrome 63% Cr Pittursburgh Silico Manganese prices 0.4 0.5 0.6 0.7 Feb-13Apr-13Jun-13Aug-13Oct-13Dec-13Feb-14Apr-14Jun-14Aug-14USD/lbSilico Manganese in warehouses in Pittsburg USA Source: Metal Bulletin, Bloomberg, MOSL
- 12. 22 September 2014 12 Metals Weekly Non-ferrous Aluminum LME inventories and spot prices 4.64.95.25.51,600 1,800 2,000 2,200 Sep-13Oct-13Nov-13Dec-13Jan-14Feb-14Mar-14Apr-14May-14Jun-14Jul-14Aug-14Sep-14m tonsUSD/t Inventories (RHS)Spot Global primary aluminum monthly production and YoY growth -2.00.53.05.58.03,600 3,800 4,000 4,200 4,400 Jul-12Sep-12Nov-12Jan-13Mar-13May-13Jul-13Sep-13Nov-13Jan-14Mar-14May-14Jul-14YoY growth (%) '000 tons ProductionYoY Aluminum: SHFE Vs LME arbitrage (USD/T) -1000100200300 Nov-12Jan-13Mar-13May-13Jul-13Sep-13Nov-13Jan-14Mar-14May-14Jul-14Sep-14 India: Company-wise primary aluminum monthly production 43 44 41 45 46 49 49 44 50 34 35 33 34 33 32 33 33 35 35 32 36 34 35 33 35 21 21 21 21 20 21 21 19 21 20 21 21 21 21 21 21 21 22 22 20 22 23 26 25 28 35 35 32 33 33 34 33 31 34 32 28 24 25 25 24 26 26 27 27 24 27 26 27 26 28 45 45 44 45 44 46 46 40 46 44 45 45 45 45 45 46 45 46 46 42 46 45 46 45 46 Jul-12Sep-12Nov-12Jan-13Mar-13May-13Jul-13Sep-13Nov-13Jan-14Mar-14May-14Jul-14'000 tons HindalcoBalcoNalcoSSLT Non-ferrous LME slipped below USD2,000/t, down 3% WoW, to now USD1,950/t. Global metal production growth has been moderating with July growth at 1.2% YoY vs June 2.2%
- 13. 22 September 2014 13 Metals Weekly Non-ferrous Aluminum Aluminum raw material and power cost for marginal producer in USA (USD/t) 08001,6002,4003,200 Oct-09Dec-09Mar-10May-10Aug-10Oct-10Jan-11Mar-11Jun-11Aug-11Nov-11Jan-12Apr-12Jun-12Aug-12Nov-12Jan-13Apr-13Jun-13Sep-13Nov-13Feb-14Apr-14Jul-14Sep-14 CPCAluminaPowerLME+Spot CPC US (USD/t) 200 300 400 500 600 Jun-09Sep-09Dec-09Mar-10Jun-10Sep-10Dec-10Mar-11Jun-11Sep-11Dec-11Mar-12Jun-12Sep-12Dec-12Mar-13Jun-13Sep-13Dec-13Mar-14Jun-14Sep-14 Alumina (USD/t) 160 240 320 400 480 Jun-09Oct-09Jan-10May-10Sep-10Jan-11Apr-11Aug-11Dec-11Apr-12Jul-12Nov-12Mar-13Jun-13Oct-13Feb-14Jun-14Sep-14 Industrial power US (Lousiana) (USc/kwh) 4.05.06.07.08.09.0 Jun-09Oct-09Jan-10May-10Sep-10Jan-11Apr-11Aug-11Dec-11Apr-12Jul-12Nov-12Mar-13Jun-13Oct-13Feb-14Jun-14Sep-14 Source: Metal Bulletin, Bloomberg, Industry, MOSL Aluminum product spreads remain attractive Alumina was higher another USD5/t WoW trading at USD340/t
- 14. 22 September 2014 14 Metals Weekly Non-ferrous Copper LME inventories and prices 0.10.20.30.40.50.60.76,000 6,250 6,500 6,750 7,000 7,250 7,500 Sep-13Oct-13Nov-13Dec-13Jan-14Feb-14Mar-14Apr-14May-14Jun-14Jul-14Aug-14Sep-14m tonsUSD/t Inventories (RHS)Spot Global refined copper monthly production and YoY growth -2.50.02.55.07.510.01.41.51.61.71.81.92.0 Aug-12Oct-12Dec-12Feb-13Apr-13Jun-13Aug-13Oct-13Dec-13Feb-14Apr-14Jun-14YoY growth (%) m tons ProductionYoY -RHS China: Refined copper monthly production and YoY growth -831425360.30 0.37 0.44 0.51 0.58 0.65 0.72 Sep-12Nov-12Jan-13Mar-13May-13Jul-13Sep-13Nov-13Jan-14Mar-14May-14Jul-14YoY growth (%) m tons ProductionYoY -RHS Copper: Spot TCRC (USc/lb) 22.024.026.028.030.032.034.0 Sep-13Oct-13Nov-13Dec-13Dec-13Jan-14Feb-14Feb-14Mar-14Apr-14Apr-14May-14Jun-14Jun-14Jul-14Aug-14Sep-14 LME was largely unchanged. Inventories were also flat WoW. July production growth picked pace higher by 7.4% YoY vs. 5.7% increase in June Spot TCRC rose to 10 month high on increasing supplies following the resumption of exports from Indonesia while demand remains largely unchanged.
- 15. 22 September 2014 15 Metals Weekly Non-ferrous Zinc LME inventories and prices 0.60.80.91.11.21,800 2,000 2,200 2,400 2,600 Sep-13Oct-13Nov-13Dec-13Jan-14Feb-14Mar-14Apr-14May-14Jun-14Jul-14Aug-14Sep-14m tonsUSD/t Inventories (RHS)Spot Global refined zinc monthly production and YoY growth -10.0-4.02.08.014.00.91.01.11.11.2 Aug-12Sep-12Oct-12Nov-12Dec-12Jan-13Feb-13Mar-13Apr-13May-13Jun-13Jul-13Aug-13Sep-13Oct-13Nov-13Dec-13Jan-14Feb-14Mar-14Apr-14May-14Jun-14Jul-14YoY growth (%) m tons ProductionYoY growth (RHS) China: Refined zinc monthly production and YoY growth -22-219400.30.40.40.5 Sep-12Nov-12Jan-13Mar-13May-13Jul-13Sep-13Nov-13Jan-14Mar-14May-14Jul-14YoY growth (%) m tons ProductionYoY growth (RHS) Zinc: Global metal surplus/(deficit) - kt -150-100-50050100150 Aug-12Sep-12Oct-12Nov-12Dec-12Jan-13Feb-13Mar-13Apr-13May-13Jun-13Jul-13Aug-13Sep-13Oct-13Nov-13Dec-13Jan-14Feb-14Mar-14Apr-14May-14Jun-14<--deficit (kt) surplus --> After sharp decline last week, LME was broadly flat. July Zinc production growth came at 3.1% YoY, slightly slower than 3.8% growth recorded in June. Zinc market remains a deficit since March 14. Deficit in May increased to 93kt declining to 29kt in June.
- 16. 22 September 2014 16 Metals Weekly Non-ferrous Lead LME inventories and prices 0.15 0.18 0.20 0.23 0.25 1,900 2,000 2,100 2,200 2,300 Sep-13Oct-13Nov-13Dec-13Jan-14Feb-14Mar-14Apr-14May-14Jun-14Jul-14Aug-14Sep-14m tonsUSD/t Inventories (RHS)Spot Global refined lead monthly production and YoY growth -15-5515250.60.70.80.91.0 Aug-12Nov-12Jan-13Mar-13May-13Jul-13Sep-13Nov-13Jan-14Mar-14May-14Jul-14YoY growth (%) m tons ProductionYoY -RHS China: Refined lead monthly production and YoY growth -40-20020400.20.30.40.5 Aug-12Sep-12Oct-12Nov-12Dec-12Jan-13Feb-13Mar-13Apr-13May-13Jun-13Jul-13Aug-13Sep-13Oct-13Nov-13Dec-13Jan-14Feb-14Mar-14Apr-14May-14Jun-14Jul-14YoY growth (%) m tons ProductionYoY -RHS : India: Company-wise refined lead monthly production 6 9 11 11 10 9 9 12 12 10 12 12 11 9 9 6 7 12 11 11 14 10 10 11 11 Jul-12Aug-12Sep-12Oct-12Nov-12Dec-12Jan-13Feb-13Mar-13Apr-13May-13Jun-13Jul-13Aug-13Sep-13Oct-13Nov-13Dec-13Jan-14Feb-14Mar-14Apr-14May-14Jun-14Jul-14 HZL Source: Metal Bulletin, Bloomberg, MOSL Following the 4% decline previous week, Lead continued to slide down further 2% during the week. In July production declined by 2.4% YoY. This follows 2.1% YoY growth posted in June.
- 17. 22 September 2014 17 Metals Weekly Commodity forward curves LME aluminum (USD/ton) 1,800 2,000 2,200 2,400 11/20143/20157/201511/20153/20167/201611/20163/20177/201711/20173/20187/201811/20183/20197/201911/2019 Current1-week ago3-month ago LME copper (USD/ton) 6,600 6,700 6,800 6,900 7,000 7,100 7,200 11/20143/20157/201511/20153/20167/201611/20163/20177/201711/20173/20187/201811/20183/20197/201911/2019 Current1-week ago3-month ago LME zinc futures (USD/ton) 2,000 2,050 2,100 2,150 2,200 2,250 2,300 2,350 11/20143/20157/201511/20153/20167/201611/20163/20177/201711/20173/20187/201811/20183/20197/201911/2019 Current1-week ago3-month ago Base metals US spot premium (USD/ton) 40 115 190 265 340 415 490 Dec-07Apr-08Aug-08Dec-08Apr-09Aug-09Dec-09Apr-10Aug-10Dec-10Apr-11Aug-11Dec-11Apr-12Aug-12Dec-12Apr-13Aug-13Dec-13Apr-14Aug-14 AluminiumZincCopper Source: Metal Bulletin, Bloomberg, MOSL
- 18. 22 September 2014 18 Metals Weekly China non-ferrous trade data China’s aluminum trade ('000 tons) 0100200300400 Jul-12Oct-12Dec-12Feb-13Apr-13Jun-13Aug-13Oct-13Dec-13Feb-14Apr-14Jun-14Aug-14 ImportsExports China’s refined copper trade ('000 tons) 0100200300400500 Jul-12Sep-12Nov-12Jan-13Mar-13May-13Jul-13Sep-13Nov-13Jan-14Mar-14May-14Jul-14 ImportsExports China’s refined zinc trade ('000 tons) 0255075100 Sep-12Dec-12Feb-13Apr-13Jun-13Aug-13Oct-13Dec-13Feb-14Apr-14Jun-14Aug-14 Export Import China’s alumina imports ('000 tons) and prices (USD/ton) 0200400600800 Sep-12Dec-12Feb-13Apr-13Jun-13Aug-13Oct-13Dec-13Feb-14Apr-14Jun-14Aug-14 Source: Metal Bulletin, Bloomberg, MOSL Unwrought aluminum exports were higher by 10kt MoM to 390kt China alumina imports were flat WoW
- 19. 22 September 2014 19 Metals Weekly Key indicators China new loan growth (Yuan b) 300 600 900 1,200 1,500 Jun-12Aug-12Oct-12Dec-12Feb-13Apr-13Jun-13Aug-13Oct-13Dec-13Feb-14Apr-14Jun-14 China: PMI 384450566246 48 50 52 54 Sep-12Nov-12Jan-13Mar-13May-13Jul-13Sep-13Nov-13Jan-14Mar-14May-14Jul-14Steel PMIMfg PMI Mfg PMISteel PMI China: Fixed asset investment growth (%) 16 18 20 22 Aug-12Oct-12Dec-12Feb-13Apr-13Jun-13Aug-13Oct-13Dec-13Feb-14Apr-14Jun-14Aug-14 Currency movement with respect to the rupee 6574839210111051 55 59 63 67 71 Sep-13Oct-13Nov-13Dec-13Jan-14Mar-14Apr-14May-14Jun-14Jul-14Aug-14Sep-14INRINR USD (LHS)GBPEURO Source: Bloomberg, MOSL Fixed asset investment growth has slowed to 17% over the last few months China steel PMI remained in contracted mode for the 4th consecutive month. Aug print came at 48.4
- 20. 22 September 2014 20 Metals Weekly Key indicators (Contd...) China Energy Production Electricity (b kwh) -1001020304050200 250 300 350 400 450 500 550 May-11Jul-11Sep-11Nov-11Jan-12Mar-12May-12Jul-12Sep-12Nov-12Jan-13Mar-13May-13Jul-13Sep-13Nov-13Jan-14Mar-14May-14Jul-14 ElectricityYoY (%, RHS) China Monthly Trade YoY (%) -2002040 Sep-12Dec-12Mar-13May-13Jul-13Oct-13Dec-13Mar-14May-14Aug-14 ImportExport China Price Index YoY (%) -6-3036 Sep-12Nov-12Dec-12Feb-13Mar-13May-13Jun-13Aug-13Sep-13Nov-13Dec-13Feb-14Mar-14May-14Jun-14Aug-14 PPICPI China GDP YoY (%) 7.27.68.08.48.89.29.6 Sep-11Dec-11Mar-12Jun-12Sep-12Dec-12Mar-13Jun-13Sep-13Dec-13Mar-14Jun-14 Source: Bloomberg, MOSL China’s GDP growth was 7.5% in 2QCY14 China electricity production growth decelerated to 3.4% YoY in Aug from 18.7% growth recorded in July.
- 21. 22 September 2014 21 Metals Weekly Industrial production growth The UK and the USA (%) -6-3036 Sep-12Nov-12Jan-13Mar-13May-13Jul-13Sep-13Nov-13Jan-14Mar-14May-14Jul-14 UKUSA Japan (%) -20-1001020 Sep-12Dec-12Feb-13Apr-13Jun-13Aug-13Oct-13Dec-13Feb-14Apr-14Jun-14Aug-14 European Union (%) -16-10-428 Aug-12Oct-12Dec-12Feb-13Apr-13Jun-13Aug-13Oct-13Dec-13Feb-14Apr-14Jun-14Aug-14 FranceGermanyItaly BRIC (%) -70714 Aug-12Oct-12Dec-12Feb-13Apr-13Jun-13Aug-13Oct-13Dec-13Feb-14Apr-14Jun-14Aug-14 RussiaBrazilIndiaChina Source: Bloomberg, MOSL China’s industrial production decelerated sharply by 210bps MoM to 6.9%
- 22. 22 September 2014 22 Metals Weekly Stock exchange announcements JSW Steel: JSW Steel clarified that it has submitted a binding bid for the take- over of the rolling mills of Piombini Plant of Lucchini in Italy. The acquisition is in line with its long term strategy to acquire finishing mills near to the market, the company mentioned. Hindalco: The company said 6 of its bauxite mines in Jharkhand were ordered to stop operating by the state government, in compliance with the amendment to the MMDR Act which does away with the second deemed extension provision. The company further mentioned that it had applied for the license renewals as per the requirement of the law and the application is under consideration of the state government. It expects renewals to be granted within six months and has sufficient inventory to maintain production for the period. The mines closed supplied to its refineries in Muri and Renukoot. The company also mentioned that the other operating mines in the area could also supply bauxite to the two refineries.
- 23. 22 September 2014 23 Metals Weekly Price(INR)FY14EFY15EFY16EFY15EFY16EFY15EFY16EFY14EFY15ESteelTata SteelBuy5108,13335.539.549.012.910.46.46.22.01.5SAILNeutral754,1304.67.58.19.99.27.76.60.70.7JSW SteelBuy12885,11134.4139.7137.89.29.36.66.41.31.1JSPLBuy2113,16920.923.630.68.96.97.56.70.90.8NMDCBuy17411,32516.118.218.69.69.45.75.52.32.1Non-FerrousHindalco Buy1645,55912.513.315.012.410.98.06.91.41.3SSLTBuy28413,82217.223.524.112.011.86.96.31.21.1Hindustan ZincBuy16711,58316.317.918.19.39.25.64.41.61.4NalcoBuy682,8772.65.15.613.512.16.45.21.41.3Valuations: Indian CompaniesCMP=current market priceSource: MOSLP/B(x) RatingMCAP (USD M) EPSP/E (x)EV/EBITDA (x) Valuations: Global CompaniesCompanyBBGP/BV (x) CODECUR YRNXT YRCUR YRNXT YRCY13MiningBHP-BillitonBHP AUAUD36167,403 12.713.26.35.92.2FMGFMG AUAUD411,207 4.16.44.24.51.5Rio TintoRIO AUAUD6297,883 10.610.16.25.72.0ValeVale USUSD2561,345 6.76.65.04.80.9Teck ResourcesTCK USUSD2112,321 27.215.77.86.40.7STEEL Arcelor MittalMT NAEUR1123,870 19.512.96.15.20.5Posco005490 KSk KRW36129,892 18.214.25.65.20.7US SteelX USUSD405,793 19.514.55.95.21.5NucorNUE USUSD5517,524 26.816.610.78.12.2JFE5411 JTJPY2,15212,331 11.910.37.86.80.7GerdauGGBR4 BZBRL128,592 16.213.17.06.31.1Bao Steel600019 CHCNY412,004 10.39.06.15.50.8NON FERROUSAlcoaAA USUSD1719,668 26.819.310.07.91.7Norsk HydroNHY NONOK3812,450 35.618.610.37.81.1Rusal486 HKHKD59,193 17.310.315.712.31.4Source: BloombergEV/EBITDA(x) CurrencyPRICEMCAP (US$ M) PE (x) Metals Valuation Matrix
- 24. 22 September 2014 24 Metals Weekly Metals stock performance on absolute and relative basis (%) Months1361213612SteelTata Steel-6.2-1.743.364.4-8.7-9.219.233.2SAIL-14.4-21.332.046.6-16.9-28.88.015.4JSW Steel0.24.532.578.2-2.3-3.08.446.9JSPL-28.7-33.6-20.3-18.9-31.2-41.1-44.3-50.1NMDC-1.5-1.532.742.1-4.1-9.08.610.9Non-FerrousSSLT-4.4-3.961.252.8-7.0-11.437.121.6Hindustan Zinc-1.34.237.928.4-3.9-3.313.8-2.8Nalco16.521.695.8106.514.014.171.775.3Hindalco -9.2-1.837.038.7-11.7-9.312.97.5Mid CapsMonnet Ispat-22.8-23.963.3-21.7-25.4-31.439.2-52.9Godawari -1.016.7120.5104.9-3.59.296.473.7Sarda Energy-31.66.2146.4182.8-34.1-1.3122.3151.6Tata Sponge16.257.1108.8263.113.749.684.7231.9Adhunik Metaliks-10.0-16.36.851.1-12.6-23.8-17.219.9Bhushan Steel-13.8-69.1-72.5-74.5-16.4-76.6-96.6-105.8Jai Balaji-28.1-25.068.34.4-30.6-32.444.2-26.8Rain Industries29.228.963.044.626.621.439.013.4Prakash Industries-15.6-31.580.5104.9-18.1-39.056.473.7SENSEX2.57.524.131.2- - - - Absolute Perf (%)Relative Perf to Sensex (%) Global Metals stock performance on absolute basis (%) 1week1month3 months 6 months 7 months 12 months MiningRio Tinto-0.8-6.93.21.11.21.2BHP Billiton-0.9-10.6-2.6-1.1-3.3-3.3Vale-2.4-13.5-6.7-5.1-27.4-27.4FMG-4.6-18.6-10.9-24.6-17.9-17.9Anglo American-0.7-6.71.46.0-10.0-10.0Vedanta-5.5-1.2-10.222.5-13.9-13.9SteelUS Steel13.220.077.876.3113.5113.5Nucor4.96.711.516.314.814.8Arcelor Mittal4.98.94.35.36.86.8Bao Steel-1.6-2.212.522.21.61.6Posco-0.86.222.425.08.88.8JFE Holdings5.56.010.319.5-17.2-17.2Nippon2.4-3.4-9.08.4-14.2-14.2Thyssen Krupp 1.32.31.921.226.326.3Voest Alpine 0.16.7-5.15.2-4.1-4.1Gerdau0.6-5.3-13.6-12.2-29.2-29.2AluminiumAlcoa-3.1-1.312.136.992.192.1Rusal-0.417.025.482.3108.8108.8Chalco-5.4-3.519.626.420.520.5Source: MOSL, BloombergAbsolute Perf (%) Metals Stock Performance Among large-cap companies, Nalco had the strongest performance over the last one month, while JSPL was the weakest amid concerns over coal block de-allocation Among mid-cap companies, Rain Industries has outperformed and Sarda Energy has underperformed over one month Among global mining companies, Anglo was the best performer, while Vedanta was the worst performing stock over one month Among global steel majors, US Steel was the best performer, while Bao Steel was the worst performing stock over the last one month Among the global aluminum, Chalco has been the worst performer over one month
- 25. 22 September 2014 25 Metals Weekly N O T E S
- 26. 22 September 2014 26 Metals Weekly Disclosures This research report has been prepared by MOSt to provide information about the company(ies) and sector(s), if any, covered in the report and may be distributed by it and/or its affiliated company(ies). This report is for personal information of the select recipient and does not construe to be any investment, legal or taxation advice to you. This research report does not constitute an offer, invitation or inducement to invest in securities or other investments and Motilal Oswal Securities Limited (hereinafter referred as MOSt) is not soliciting any action based upon it. This report is not for public distribution and has been furnished to you solely for your general information and should not be reproduced or redistributed to any other person in any form. This report does not constitute a personal recommendation or take into account the particular investment objectives, financial situations, or needs of individual clients. Before acting on any advice or recommendation in this material, investors should consider whether it is suitable for their particular circumstances and, if necessary, seek professional advice. The price and value of the investments referred to in this material and the income from them may go down as well as up, and investors may realize losses on any investments. Past performance is not a guide for future performance, future returns are not guaranteed and a loss of original capital may occur. MOSt and its affiliates are a full-service, integrated investment banking, investment management, brokerage and financing group. We and our affiliates have investment banking and other business relationships with a significant percentage of the companies covered by our Research Department Our research professionals provide important input into our investment banking and other business selection processes. Investors should assume that MOSt and/or its affiliates are seeking or will seek investment banking or other business from the company or companies that are the subject of this material and that the research professionals who were involved in preparing this material may participate in the solicitation of such business. The research professionals responsible for the preparation of this document may interact with trading desk personnel, sales personnel and other parties for the purpose of gathering, applying and interpreting market information. Our research professionals are paid in part based on the profitability of MOSt which include earnings from investment banking and other business. MOSt generally prohibits its analysts, persons reporting to analysts, and members of their households from maintaining a financial interest in the securities or derivatives of any companies that the analysts cover. Additionally, MOSt generally prohibits its analysts and persons reporting to analysts from serving as an officer, director, or advisory board member of any companies that the analysts cover. Our salespeople, traders, and other professionals or affiliates may provide oral or written market commentary or trading strategies to our clients that reflect opinions that are contrary to the opinions expressed herein, and our proprietary trading and investing businesses may make investment decisions that are inconsistent with the recommendations expressed herein. In reviewing these materials, you should be aware that any or all o the foregoing, among other things, may give rise to real or potential conflicts of interest . MOSt and its affiliated company(ies), their directors and employees may; (a) from time to time, have a long or short position in, and buy or sell the securities of the company(ies) mentioned herein or (b) be engaged in any other transaction involving such securities and earn brokerage or other compensation or act as a market maker in the financial instruments of the company(ies) discussed herein or act as an advisor or lender/borrower to such company(ies) or may have any other potential conflict of interests with respect to any recommendation and other related information and opinions. Unauthorized disclosure, use, dissemination or copying (either whole or partial) of this information, is prohibited. The person accessing this information specifically agrees to exempt MOSt or any of its affiliates or employees from, any and all responsibility/liability arising from such misuse and agrees not to hold MOSt or any of its affiliates or employees responsible for any such misuse and further agrees to hold MOSt or any of its affiliates or employees free and harmless from all losses, costs, damages, expenses that may be suffered by the person accessing this information due to any errors and delays. The information contained herein is based on publicly available data or other sources believed to be reliable. Any statements contained in this report attributed to a third party represent MOSt’s interpretation of the data, information and/or opinions provided by that third party either publicly or through a subscription service, and such use and interpretation have not been reviewed by the third party. This Report is not intended to be a complete statement or summary of the securities, markets or developments referred to in the document. While we would endeavor to update the information herein on reasonable basis, MOSt and/or its affiliates are under no obligation to update the information. Also there may be regulatory, compliance, or other reasons that may prevent MOSt and/or its affiliates from doing so. MOSt or any of its affiliates or employees shall not be in any way responsible and liable for any loss or damage that may arise to any person from any inadvertent error in the information contained in this report. MOSt or any of its affiliates or employees do not provide, at any time, any express or implied warranty of any kind, regarding any matter pertaining to this report, including without limitation the implied warranties of merchantability, fitness for a particular purpose, and non-infringement. The recipients of this report should rely on their own investigations. Recipients who are not institutional investors should seek advice of their independent financial advisor prior to taking any investment decision based on this report or for any necessary explanation of its contents. MOSt and/or its affiliates and/or employees may have interests/positions, financial or otherwise in the securities mentioned in this report. To enhance transparency, MOSt has incorporated a Disclosure of Interest Statement in this document. This should, however, not be treated as endorsement of the views expressed in the report. Disclosure of Interest Statement Companies where there is interest Analyst ownership of the stock Sesa Sterlite Analyst Certification The views expressed in this research report accurately reflect the personal views of the analyst(s) about the subject securities or issues, and no part of the compensation of the research analyst(s) was, is, or will be directly or indirectly related to the specific recommendations and views expressed by research analyst(s) in this report. The research analysts, strategists, or research associates principally responsible for preparation of MOSt research receive compensation based upon various factors, including quality of research, investor client feedback, stock picking, competitive factors and firm revenues. Regional Disclosures (outside India) This report is not directed or intended for distribution to or use by any person or entity resident in a state, country or any jurisdiction, where such distribution, publication, availability or use would be contrary to law, regulation or which would subject MOSt & its group companies to registration or licensing requirements within such jurisdictions. For U.K. This report is intended for distribution only to persons having professional experience in matters relating to investments as described in Article 19 of the Financial Services and Markets Act 2000 (Financial Promotion) Order 2005 (referred to as "investment professionals"). This document must not be acted on or relied on by persons who are not investment professionals. Any investment or investment activity to which this document relates is only available to investment professionals and will be engaged in only with such persons. For U.S. Motilal Oswal Securities Limited (MOSL) is not a registered broker - dealer under the U.S. Securities Exchange Act of 1934, as amended (the"1934 act") and under applicable state laws in the United States. In addition MOSL is not a registered investment adviser under the U.S. Investment Advisers Act of 1940, as amended (the "Advisers Act" and together with the 1934 Act, the "Acts), and under applicable state laws in the United States. Accordingly, in the absence of specific exemption under the Acts, any brokerage and investment services provided by MOSL, including the products and services described herein are not available to or intended for U.S. persons. This report is intended for distribution only to "Major Institutional Investors" as defined by Rule 15a-6(b)(4) of the Exchange Act and interpretations thereof by SEC (henceforth referred to as "major institutional investors"). This document must not be acted on or relied on by persons who are not major institutional investors. Any investment or investment activity to which this document relates is only available to major institutional investors and will be engaged in only with major institutional investors. In reliance on the exemption from registration provided by Rule 15a-6 of the U.S. Securities Exchange Act of 1934, as amended (the "Exchange Act") and interpretations thereof by the U.S. Securities and Exchange Commission ("SEC") in order to conduct business with Institutional Investors based in the U.S., MOSL has entered into a chaperoning agreement with a U.S. registered broker-dealer, Motilal Oswal Securities International Private Limited. ("MOSIPL"). Any business interaction pursuant to this report will have to be executed within the provisions of this chaperoning agreement. The Research Analysts contributing to the report may not be registered /qualified as research analyst with FINRA. Such research analyst may not be associated persons of the U.S. registered broker-dealer, MOSIPL, and therefore, may not be subject to NASD rule 2711 and NYSE Rule 472 restrictions on communication with a subject company, public appearances and trading securities held by a research analyst account. For Singapore Motilal Oswal Capital Markets Singapore Pte Limited is acting as an exempt financial advisor under section 23(1)(f) of the Financial Advisers Act(FAA) read with regulation 17(1)(d) of the Financial Advisors Regulations and is a subsidiary of Motilal Oswal Securities Limited in India. This research is distributed in Singapore by Motilal Oswal Capital Markets Singapore Pte Limited and it is only directed in Singapore to accredited investors, as defined in the Financial Advisers Regulations and the Securities and Futures Act (Chapter 289), as amended from time to time. In respect of any matter arising from or in connection with the research you could contact the following representatives of Motilal Oswal Capital Markets Singapore Pte Limited: Anosh Koppikar Kadambari Balachandran Email:anosh.Koppikar@motilaloswal.com Email : kadambari.balachandran@motilaloswal.com Contact(+65)68189232 Contact: (+65) 68189233 / 65249115 Office Address:21 (Suite 31),16 Collyer Quay,Singapore 04931 Motilal Oswal Securities Ltd Motilal Oswal Tower, Level 9, Sayani Road, Prabhadevi, Mumbai 400 025 Phone: +91 22 3982 5500 E-mail: reports@motilaloswal.com