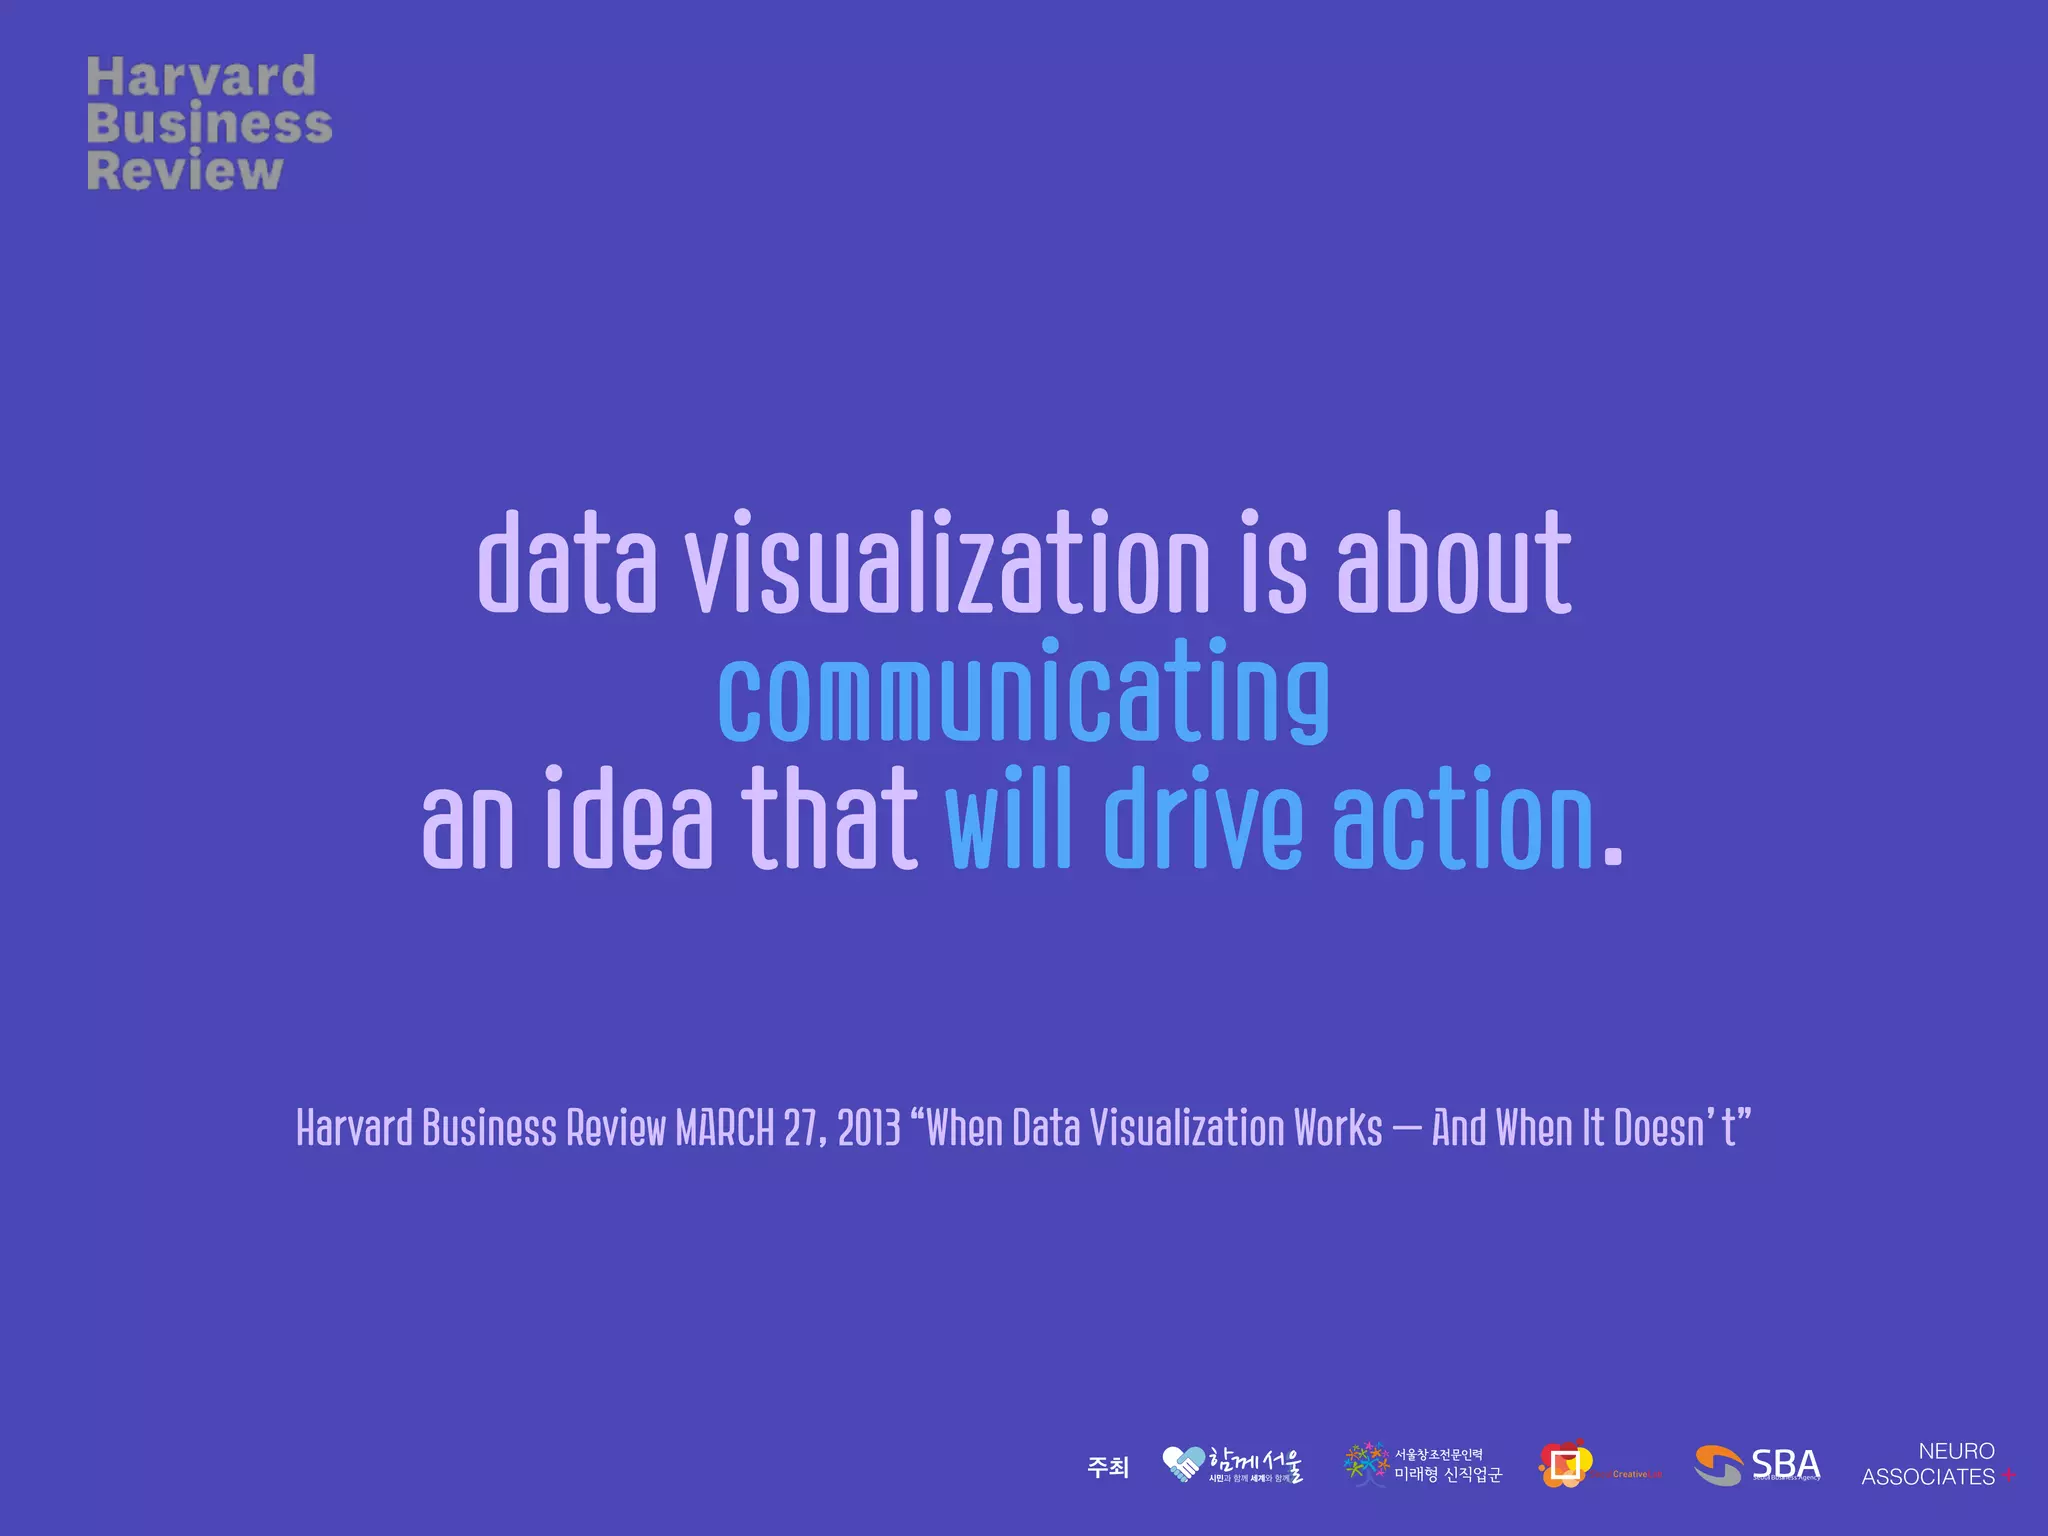
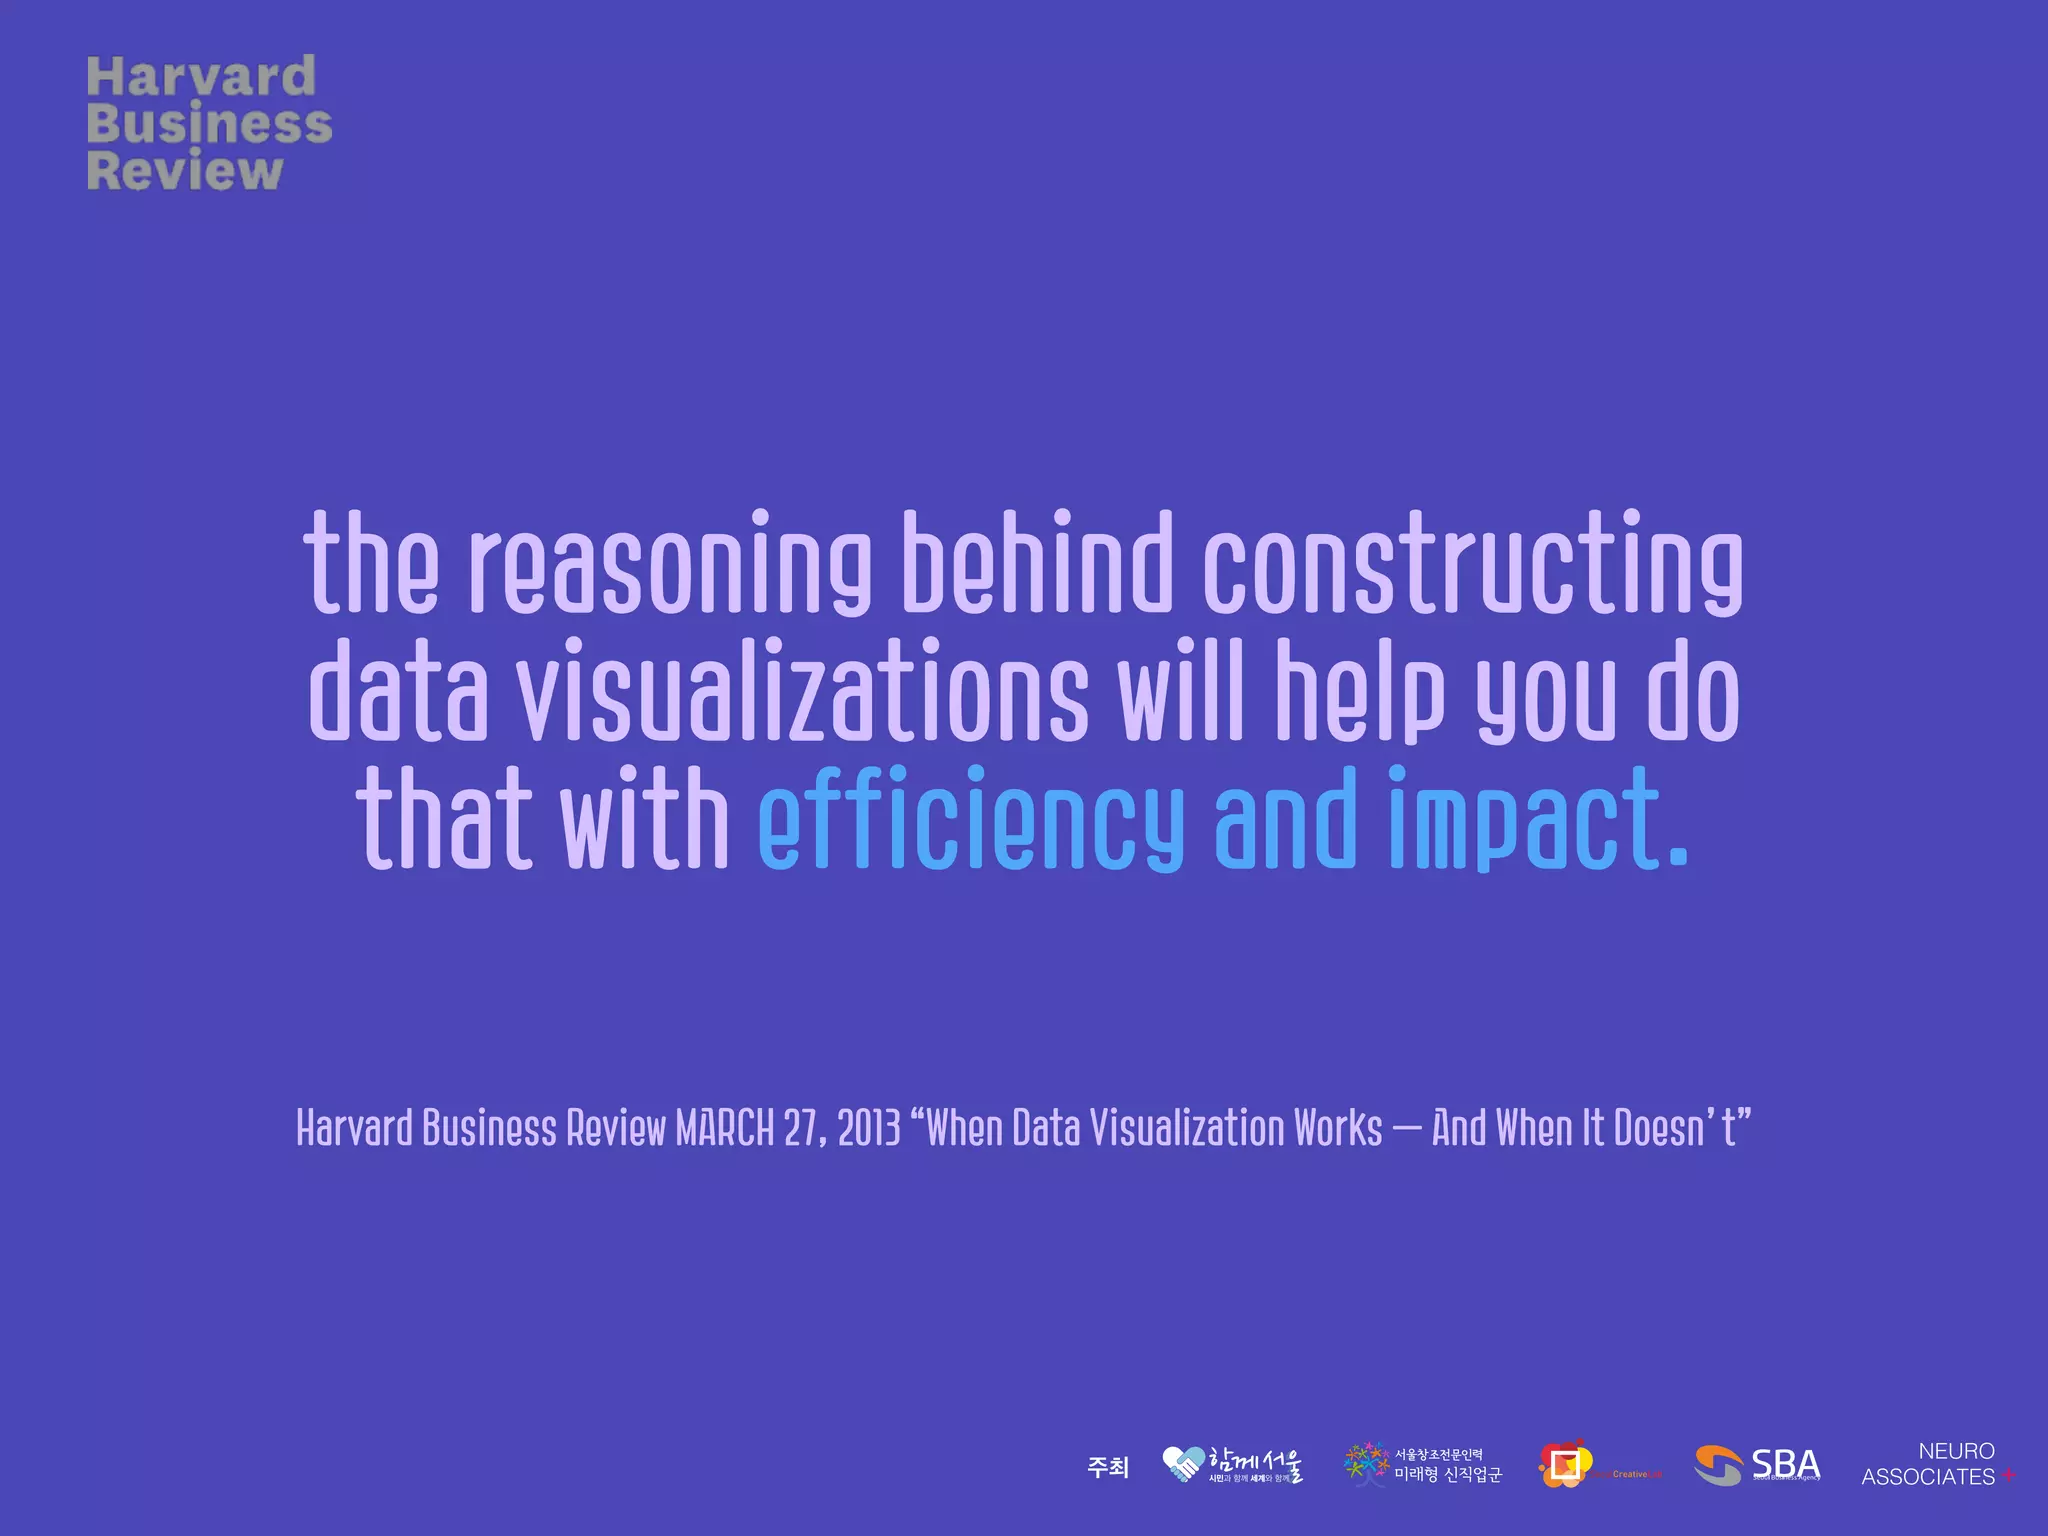
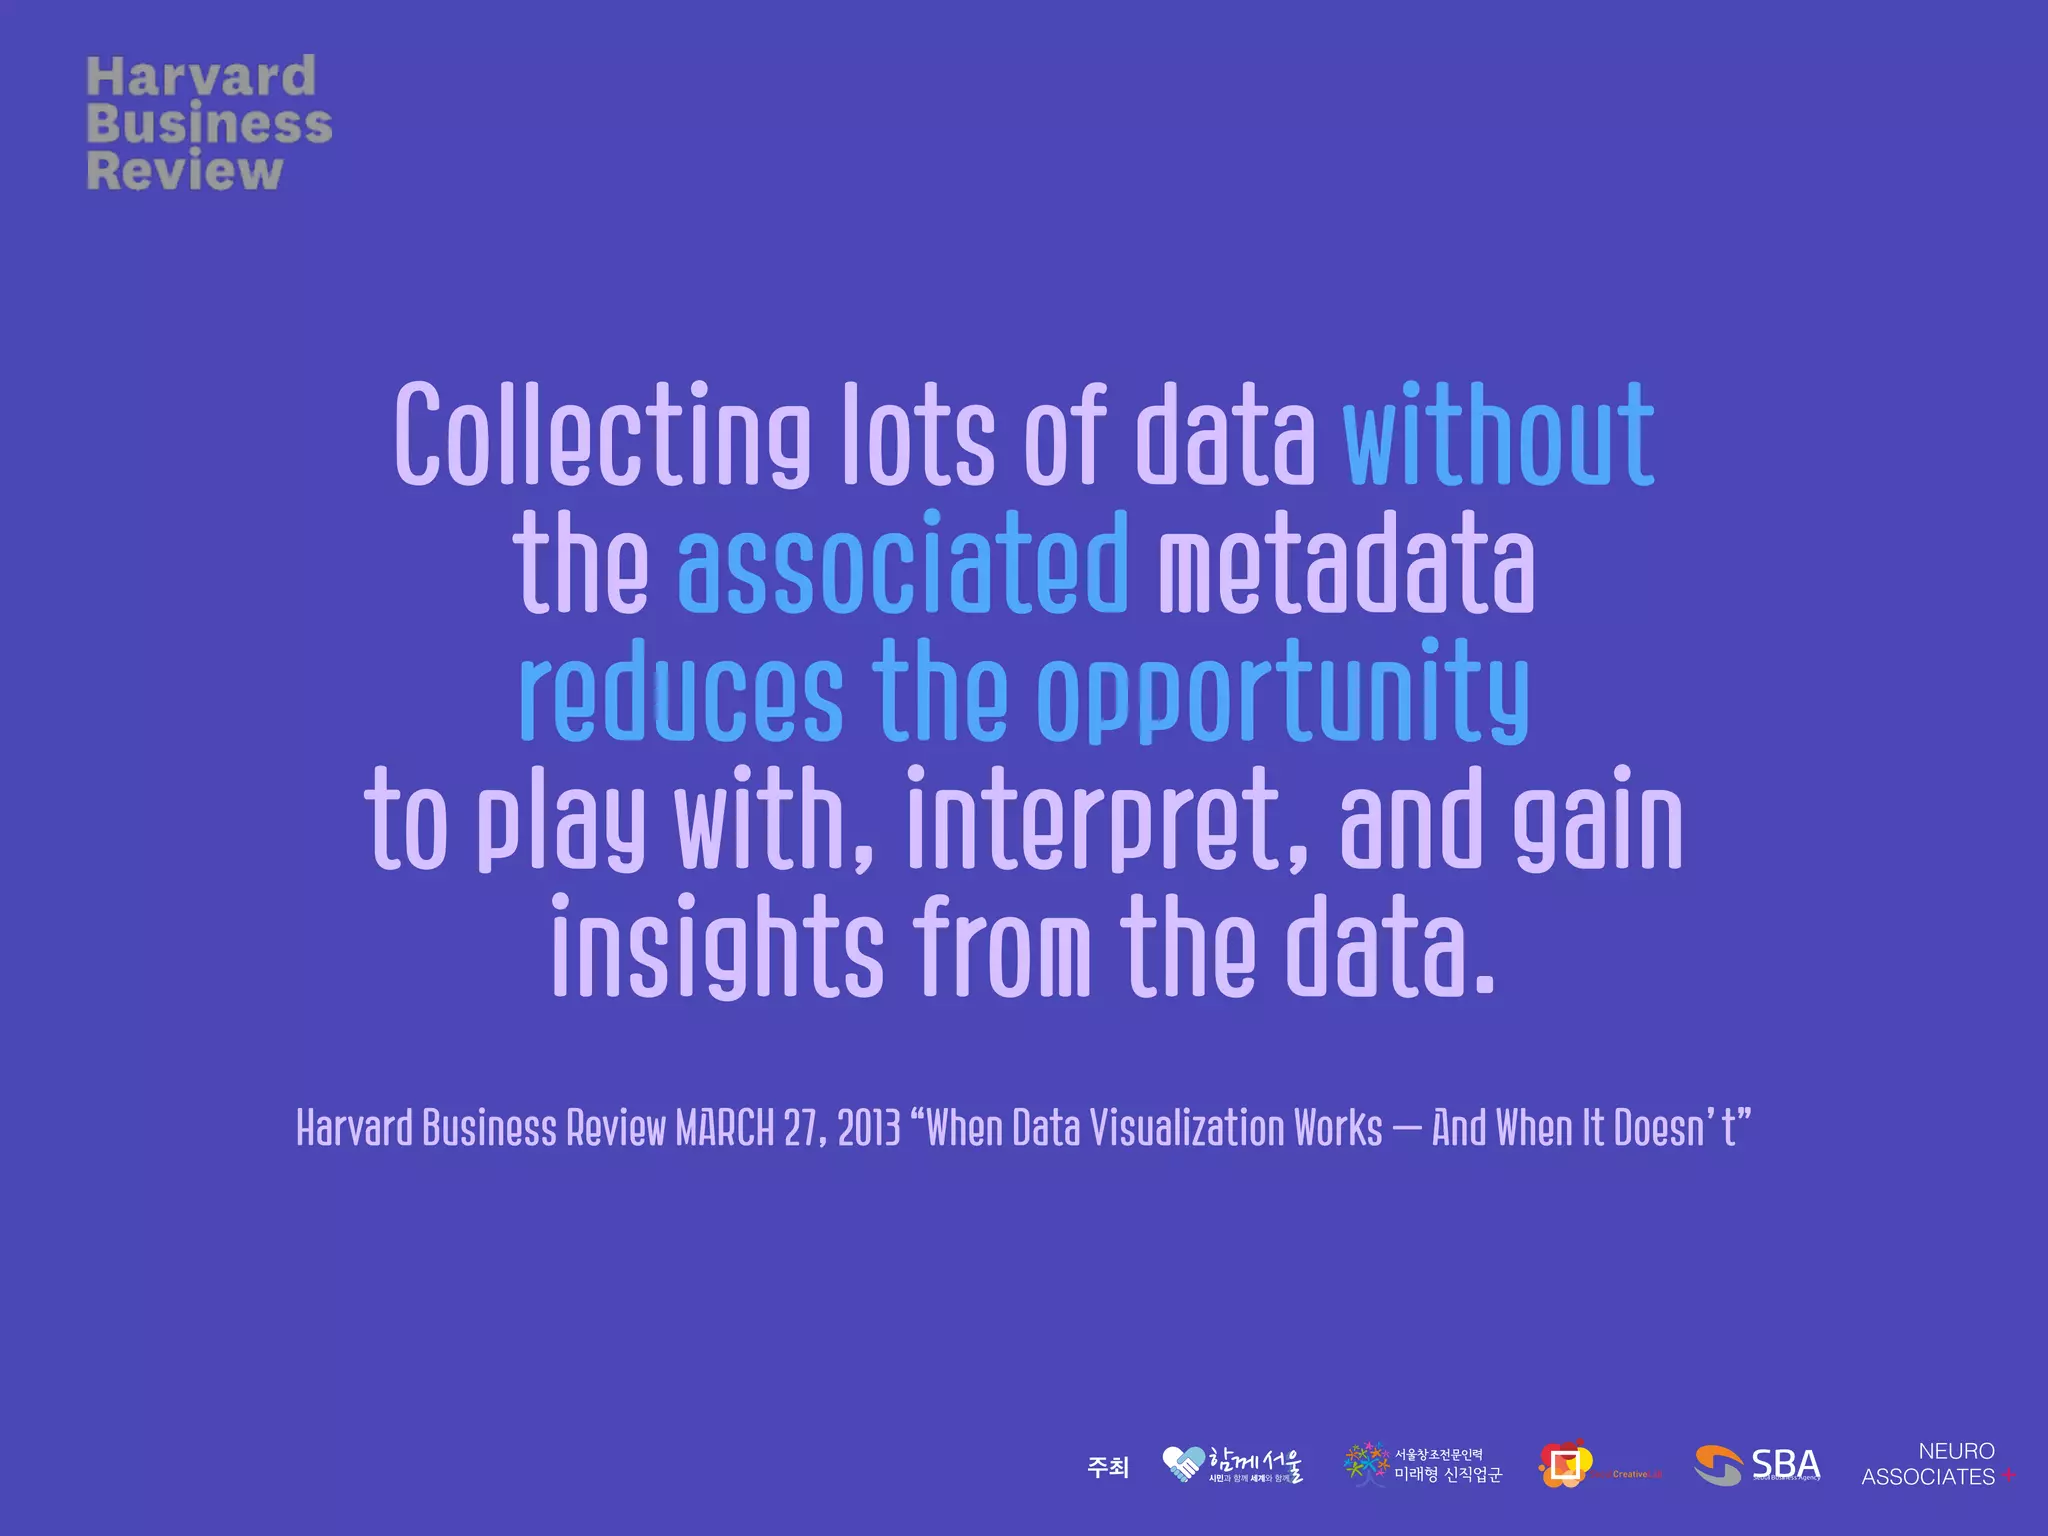
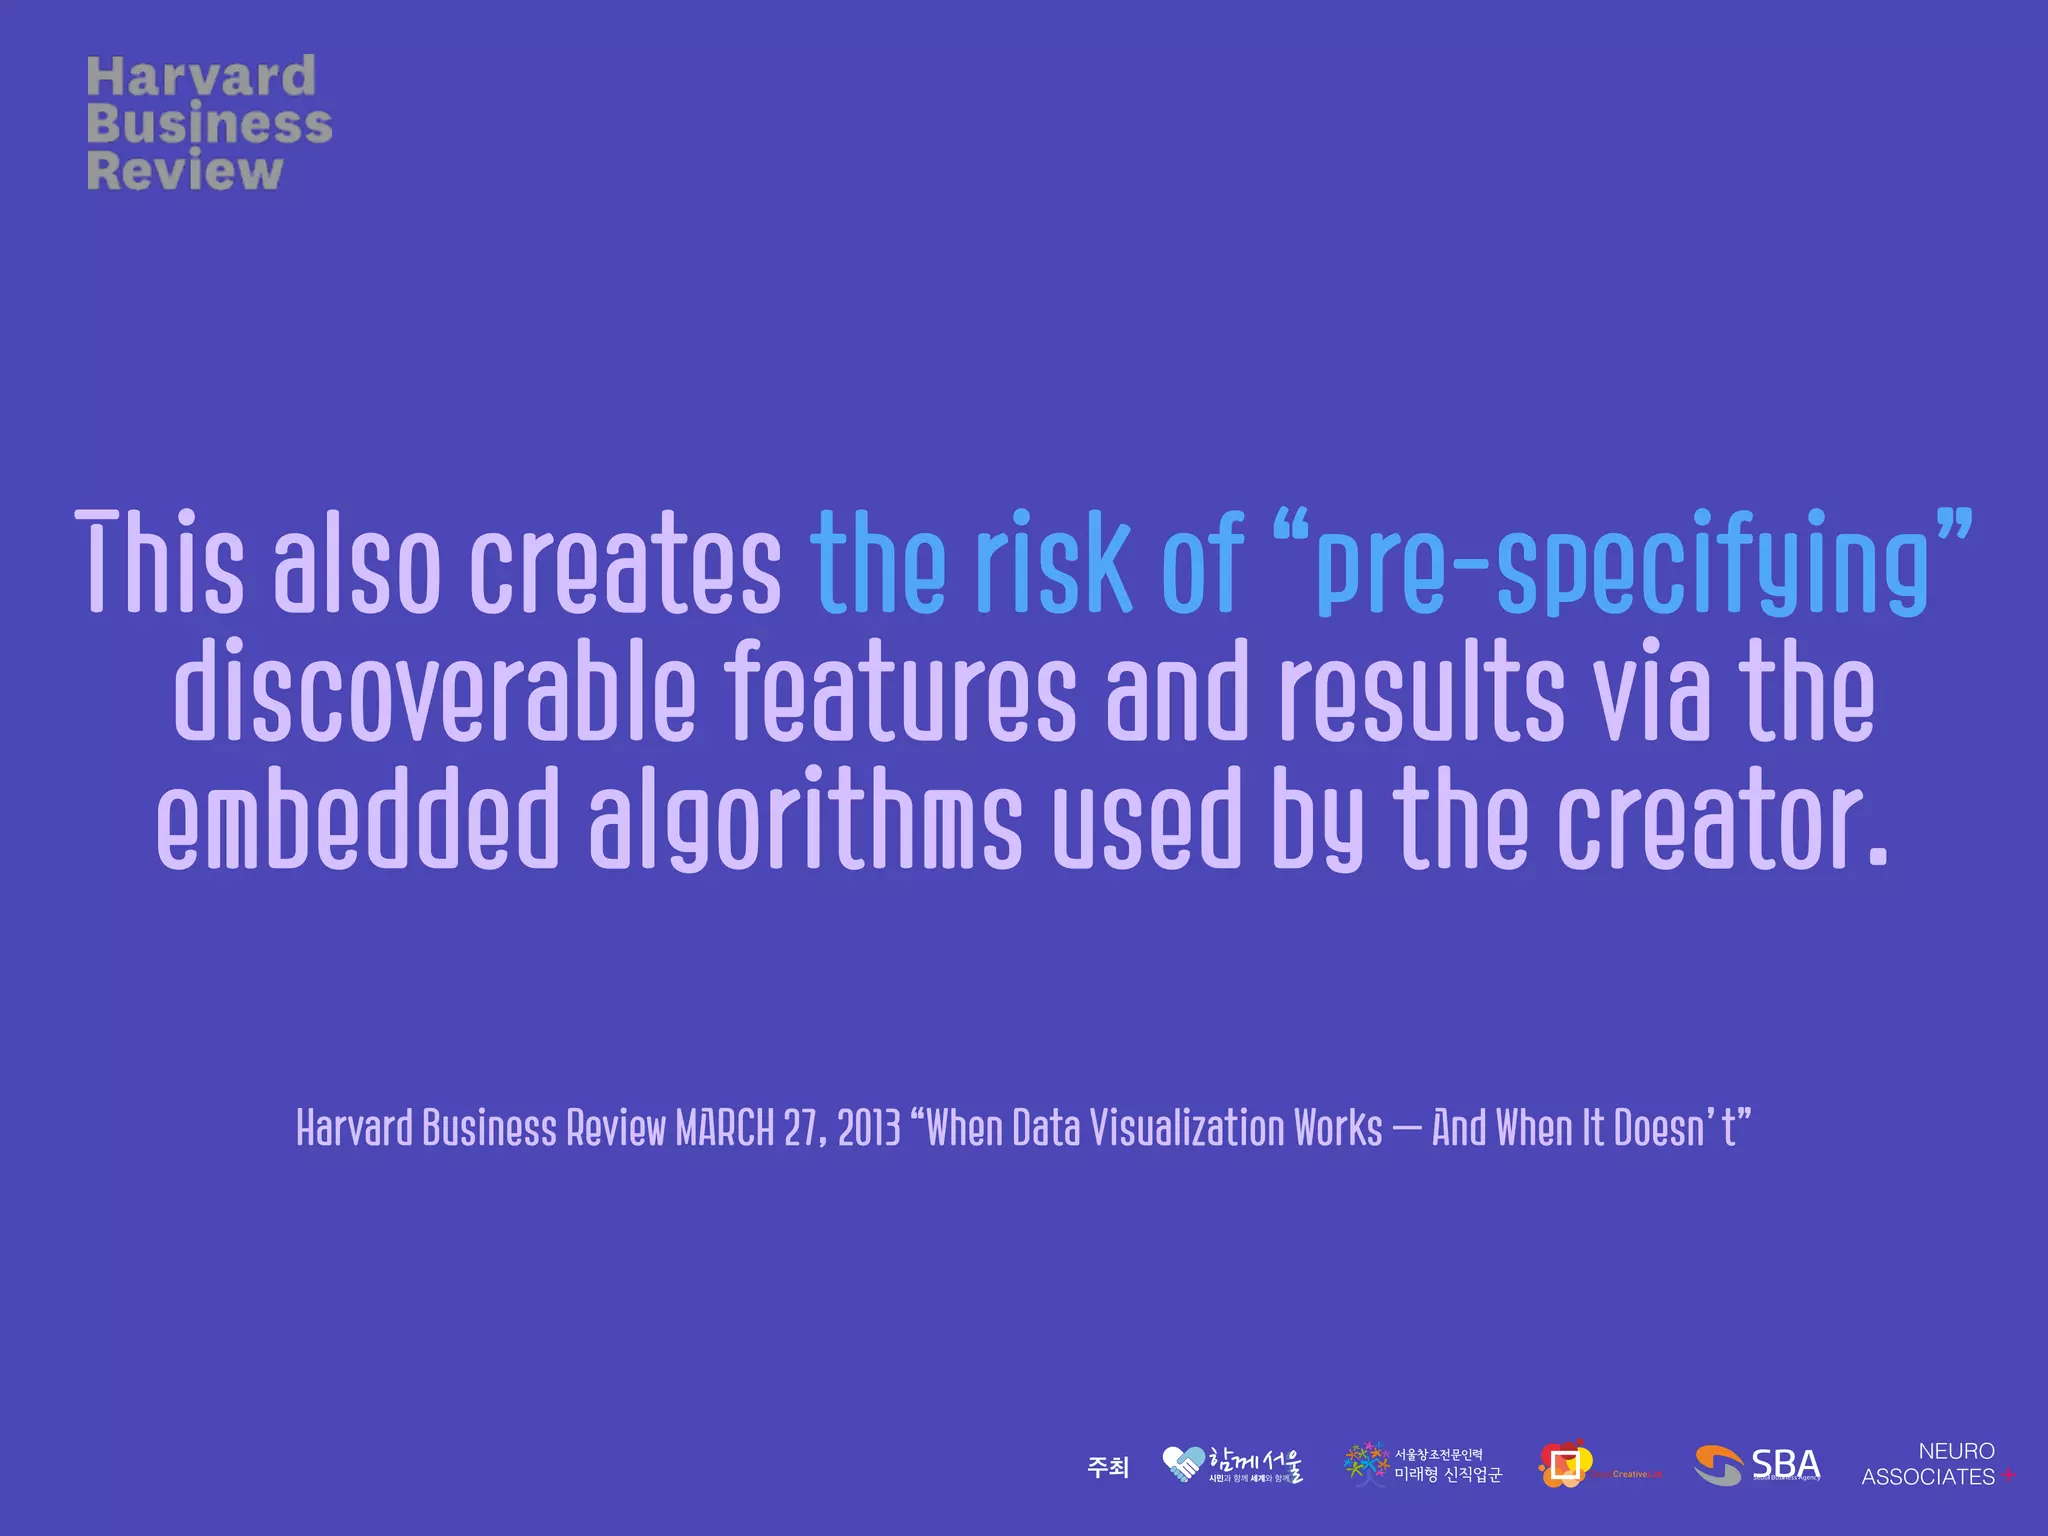
SlideShare a Scribd company logo
주간 데이터.읽어주는.남자
2번째 순서
김영웅
주간 데이터 읽어주는 남자
꿈꾸는 데이터 디자이너 매니저
경영정보시스템 전공 박사과정
경영전문대학원 MBA
컴퓨터공학 전공
Ryan Kim | Convergence Business Designer
Facebook. https://www.facebook.com/keyassist
E-mail. youngwung.kim@gmail.com
Web. http://keyassist.tistory.com
When Data Visualization Works
— And When It Doesn’t
data visualization is about
communicating
an idea that will drive action.
Harvard Business Review MARCH 27, 2013 “When Data Visualization Works — And When It Doesn’t”
the reasoning behind constructing
data visualizations will help you do
that with efficiency and impact.
Harvard Business Review MARCH 27, 2013 “When Data Visualization Works — And When It Doesn’t”
For information to provide
valuable insights,
it must be
interpretable, relevant, and novel.
Harvard Business Review MARCH 27, 2013 “When Data Visualization Works — And When It Doesn’t”
Collecting lots of data without
the associated metadata
reduces the opportunity
to play with, interpret, and gain
insights from the data.
Harvard Business Review MARCH 27, 2013 “When Data Visualization Works — And When It Doesn’t”
It must also be relevant to the persons
who are looking to gain insights,
and to the purpose for which
the information is being examined.
Harvard Business Review MARCH 27, 2013 “When Data Visualization Works — And When It Doesn’t”
it must be original, or shed new light
on an area. If the information fails
any one of these criteria, then no
visualization can make it valuable.
Harvard Business Review MARCH 27, 2013 “When Data Visualization Works — And When It Doesn’t”
There are three broad reasons
for visualizing data
Harvard Business Review MARCH 27, 2013 “When Data Visualization Works — And When It Doesn’t”
Confirmation:
If we already have a set of assumptions
about how the system we are interested in.
visualizations can help us
check those assumptions.
Harvard Business Review MARCH 27, 2013 “When Data Visualization Works — And When It Doesn’t”
Education:
One is simply reporting.
The other is to develop
intuition and new insight.
Harvard Business Review MARCH 27, 2013 “When Data Visualization Works — And When It Doesn’t”
Exploration:
We can use visualization to help
build a model to allow us to predict
and better manage the system.
Harvard Business Review MARCH 27, 2013 “When Data Visualization Works — And When It Doesn’t”
what gives us confidence
that these insights are
now worthy of action?
Harvard Business Review MARCH 27, 2013 “When Data Visualization Works — And When It Doesn’t”
Data quality: The quality of the underlying
data is crucial to the value of visualization.
How complete and reliable is it?
Harvard Business Review MARCH 27, 2013 “When Data Visualization Works — And When It Doesn’t”
Context: The point of visualization is to
make large amounts of data approachable
so we can apply our evolutionarily honed
pattern detection computer
to draw insights from it.
Harvard Business Review MARCH 27, 2013 “When Data Visualization Works — And When It Doesn’t”
To leave out any contextual information
or metadata (or more appropriately,
“metacontent”) is to risk hampering
our understanding.
Harvard Business Review MARCH 27, 2013 “When Data Visualization Works — And When It Doesn’t”
Biases: The creator of the visualization
may influence the semantics of the
visualization. any of which can challenge
the interpretation of the data.
Harvard Business Review MARCH 27, 2013 “When Data Visualization Works — And When It Doesn’t”
This also creates the risk of “pre-specifying”
discoverable features and results via the
embedded algorithms used by the creator.
Harvard Business Review MARCH 27, 2013 “When Data Visualization Works — And When It Doesn’t”
When Data Visualization Works
— And When It Doesn’t
The Best Data Visualization
Projects of 2014
<source=http://flowingdata.com/>
The Upshot
Where We Came From and Where We Went
The Most Detailed Maps You’ll See
From the Midterm Elections
How the Recession Reshaped
the Economy, in 255 Charts
Visualizing Algorithms
Mike Bostock
Bostock demonstrated processes and patterns in a wide array
of algorithms for sorting, sampling, and maze generation.
The result was a useful learning resource and an appreciation for
something that's otherwise a challenge to imagine for most people.
Visualizing MBTA Data
An interactive exploration of Boston's subway system
Boston’s Massachusetts Bay Transit Authority (MBTA)
operates the 4th busiest subway system in the U.S.
after New York, Washington, and Chicago.
SELFIECITY
Investigating the style of self-portraits (selfies)
in five cities across the world
주간 데이터.읽어주는.남자
2번째 순서
NeuroAssociates
・ Portfolio : neuroassociates.co.kr/portfolio
・ Address : 서울특별시 마포구 상수동 145-1 6F
・ Site : neuroassociates.co.kr
・ Mail : neuro.associates.consulting@gmail.com or info@neuroassociates.co.kr
・ SNS : www.facebook.com/neuroassociatessns
・ Phone : 02-334-2013

More Related Content

What's hot

Data fluency for the 21st century
Data fluency for the 21st centuryData fluency for the 21st century
Data fluency for the 21st century
MartinFrigaard
 
The Importance of Data Visualization
The Importance of Data VisualizationThe Importance of Data Visualization
The Importance of Data Visualization
Centerline Digital
 
Data Visualization
Data Visualization Data Visualization
Data Visualization
UIResearchPark
 
It's All About Me by Penny Herscher at Defrag Conference 2014
It's All About Me by Penny Herscher at Defrag Conference 2014It's All About Me by Penny Herscher at Defrag Conference 2014
It's All About Me by Penny Herscher at Defrag Conference 2014
FirstRain, Inc.
 
Visual analytics
Visual analyticsVisual analytics
Visual analytics
Kalyan Allam
 
Developing Dashboards with User-Centered Design
Developing Dashboards with User-Centered DesignDeveloping Dashboards with User-Centered Design
Developing Dashboards with User-Centered Design
Amanda Makulec
 
The REAL face of Big Data
The REAL face of Big DataThe REAL face of Big Data
The REAL face of Big Data
Douglas Bernardini
 
The Future Of Data Visualization
The Future Of Data VisualizationThe Future Of Data Visualization
The Future Of Data Visualization
FITC
 
Who is a data scientist
Who is a data scientist  Who is a data scientist
Who is a data scientist
prateek kumar
 
The Future of Business Intelligence: Data Visualization
The Future of Business Intelligence: Data VisualizationThe Future of Business Intelligence: Data Visualization
The Future of Business Intelligence: Data Visualization
Kristen Sosulski
 
Data Analaytics.04. Data visualization
Data Analaytics.04. Data visualizationData Analaytics.04. Data visualization
Data Analaytics.04. Data visualization
Alex Rayón Jerez
 
How to start thinking like a data scientist
How to start thinking like a data scientistHow to start thinking like a data scientist
How to start thinking like a data scientist
Nishant Kumar
 
Analytics of our Work
Analytics of our WorkAnalytics of our Work
Analytics of our Work
Terri Griffith
 
Data Visualization Resource Guide (September 2014)
Data Visualization Resource Guide (September 2014)Data Visualization Resource Guide (September 2014)
Data Visualization Resource Guide (September 2014)
Amanda Makulec
 
Ds article ppt
Ds article pptDs article ppt
Ds article ppt
TanayKarnik1
 
SMAC
SMACSMAC
Data Visualization for the Public Sector
Data Visualization for the Public SectorData Visualization for the Public Sector
Data Visualization for the Public Sector
JESS3
 
Design-driven vs. Data-driven
Design-driven vs. Data-driven Design-driven vs. Data-driven
Design-driven vs. Data-driven
Mikko Eerola
 
Data Visualization Design Best Practices Workshop
Data Visualization Design Best Practices WorkshopData Visualization Design Best Practices Workshop
Data Visualization Design Best Practices Workshop
JSI
 
Leading Without Formal Authority -- By Using Data
Leading Without Formal Authority -- By Using DataLeading Without Formal Authority -- By Using Data
Leading Without Formal Authority -- By Using Data
Terri Griffith
 

What's hot (20)

Data fluency for the 21st century
Data fluency for the 21st centuryData fluency for the 21st century
Data fluency for the 21st century
 
The Importance of Data Visualization
The Importance of Data VisualizationThe Importance of Data Visualization
The Importance of Data Visualization
 
Data Visualization
Data Visualization Data Visualization
Data Visualization
 
It's All About Me by Penny Herscher at Defrag Conference 2014
It's All About Me by Penny Herscher at Defrag Conference 2014It's All About Me by Penny Herscher at Defrag Conference 2014
It's All About Me by Penny Herscher at Defrag Conference 2014
 
Visual analytics
Visual analyticsVisual analytics
Visual analytics
 
Developing Dashboards with User-Centered Design
Developing Dashboards with User-Centered DesignDeveloping Dashboards with User-Centered Design
Developing Dashboards with User-Centered Design
 
The REAL face of Big Data
The REAL face of Big DataThe REAL face of Big Data
The REAL face of Big Data
 
The Future Of Data Visualization
The Future Of Data VisualizationThe Future Of Data Visualization
The Future Of Data Visualization
 
Who is a data scientist
Who is a data scientist  Who is a data scientist
Who is a data scientist
 
The Future of Business Intelligence: Data Visualization
The Future of Business Intelligence: Data VisualizationThe Future of Business Intelligence: Data Visualization
The Future of Business Intelligence: Data Visualization
 
Data Analaytics.04. Data visualization
Data Analaytics.04. Data visualizationData Analaytics.04. Data visualization
Data Analaytics.04. Data visualization
 
How to start thinking like a data scientist
How to start thinking like a data scientistHow to start thinking like a data scientist
How to start thinking like a data scientist
 
Analytics of our Work
Analytics of our WorkAnalytics of our Work
Analytics of our Work
 
Data Visualization Resource Guide (September 2014)
Data Visualization Resource Guide (September 2014)Data Visualization Resource Guide (September 2014)
Data Visualization Resource Guide (September 2014)
 
Ds article ppt
Ds article pptDs article ppt
Ds article ppt
 
SMAC
SMACSMAC
SMAC
 
Data Visualization for the Public Sector
Data Visualization for the Public SectorData Visualization for the Public Sector
Data Visualization for the Public Sector
 
Design-driven vs. Data-driven
Design-driven vs. Data-driven Design-driven vs. Data-driven
Design-driven vs. Data-driven
 
Data Visualization Design Best Practices Workshop
Data Visualization Design Best Practices WorkshopData Visualization Design Best Practices Workshop
Data Visualization Design Best Practices Workshop
 
Leading Without Formal Authority -- By Using Data
Leading Without Formal Authority -- By Using DataLeading Without Formal Authority -- By Using Data
Leading Without Formal Authority -- By Using Data
 

Similar to [Week3]데이터읽어주는남자

Data is not a business model moving knowledge to action presentation
Data is not a business model  moving knowledge to action presentationData is not a business model  moving knowledge to action presentation
Data is not a business model moving knowledge to action presentationJennifer van der Meer
 
Great Data Delivery: A model-based approach
Great Data Delivery: A model-based approachGreat Data Delivery: A model-based approach
Great Data Delivery: A model-based approach
Zach Taylor
 
Data Scientist: the Sexiest Job of the 21st Century
Data Scientist: the Sexiest Job of the 21st CenturyData Scientist: the Sexiest Job of the 21st Century
Data Scientist: the Sexiest Job of the 21st Century
Lyn Fenex
 
Data Scientist: The Sexiest Job in the 21st Century
Data Scientist: The Sexiest Job in the 21st CenturyData Scientist: The Sexiest Job in the 21st Century
Data Scientist: The Sexiest Job in the 21st Century
Lyn Fenex
 
When Big Data Meets Recruiting - HRM Asia March 2015 Presentation
When Big Data Meets Recruiting - HRM Asia March 2015 PresentationWhen Big Data Meets Recruiting - HRM Asia March 2015 Presentation
When Big Data Meets Recruiting - HRM Asia March 2015 PresentationDheeraj Shastri
 
Technical Paper Presentation on data analytics.pptx
Technical Paper Presentation on data analytics.pptxTechnical Paper Presentation on data analytics.pptx
Technical Paper Presentation on data analytics.pptx
A62AnushaGoyalCST
 
BIAM 410 Final Paper - Beyond the Buzzwords: Big Data, Machine Learning, What...
BIAM 410 Final Paper - Beyond the Buzzwords: Big Data, Machine Learning, What...BIAM 410 Final Paper - Beyond the Buzzwords: Big Data, Machine Learning, What...
BIAM 410 Final Paper - Beyond the Buzzwords: Big Data, Machine Learning, What...
Thomas Rones
 
Deck 92-146 (3)
Deck 92-146 (3)Deck 92-146 (3)
Deck 92-146 (3)
Thinkful
 
How to unlock new data-driven potential for your organization
How to unlock new data-driven potential for your organizationHow to unlock new data-driven potential for your organization
How to unlock new data-driven potential for your organization
Michal Hodinka
 
An overview of hr analytics
An overview of hr analyticsAn overview of hr analytics
An overview of hr analytics
jibyvarghese7
 
-- The Cognitive Engine - 10RULE WHITE PAPER
-- The Cognitive Engine - 10RULE WHITE PAPER-- The Cognitive Engine - 10RULE WHITE PAPER
-- The Cognitive Engine - 10RULE WHITE PAPERGary Morais
 
Digital analytics: Wrap-up (Lecture 12)
Digital analytics: Wrap-up (Lecture 12)Digital analytics: Wrap-up (Lecture 12)
Digital analytics: Wrap-up (Lecture 12)
Joni Salminen
 
Sweeny group think-ias2015
Sweeny group think-ias2015Sweeny group think-ias2015
Sweeny group think-ias2015
Marianne Sweeny
 
Business Intelligence Insights: How to Present Visual Data your Team Understands
Business Intelligence Insights: How to Present Visual Data your Team UnderstandsBusiness Intelligence Insights: How to Present Visual Data your Team Understands
Business Intelligence Insights: How to Present Visual Data your Team Understands
Sanderson Group
 
FROM DATA TO ACTIONA HARVARD BUSINESS REVIEW INSIGHT CE.docx
FROM DATA  TO ACTIONA HARVARD BUSINESS REVIEW INSIGHT CE.docxFROM DATA  TO ACTIONA HARVARD BUSINESS REVIEW INSIGHT CE.docx
FROM DATA TO ACTIONA HARVARD BUSINESS REVIEW INSIGHT CE.docx
hanneloremccaffery
 
Running title TRENDS IN COMPUTER INFORMATION SYSTEMS1TRENDS I.docx
Running title TRENDS IN COMPUTER INFORMATION SYSTEMS1TRENDS I.docxRunning title TRENDS IN COMPUTER INFORMATION SYSTEMS1TRENDS I.docx
Running title TRENDS IN COMPUTER INFORMATION SYSTEMS1TRENDS I.docx
anhlodge
 
Alex Porter's Smart Attribution presentation from SESNY 2013
Alex Porter's Smart Attribution presentation from SESNY 2013Alex Porter's Smart Attribution presentation from SESNY 2013
Alex Porter's Smart Attribution presentation from SESNY 2013
Location3 Media
 
What People Analytics Can’t Capture
What People Analytics Can’t Capture What People Analytics Can’t Capture
What People Analytics Can’t Capture
poojaKeserwani
 
Text Analysis for Social Media
Text Analysis for Social MediaText Analysis for Social Media
Text Analysis for Social Media
Bytesview
 
How Your Data Can Predict The Future
How Your Data Can Predict The FutureHow Your Data Can Predict The Future
How Your Data Can Predict The Future
Becky Wang
 

Similar to [Week3]데이터읽어주는남자 (20)

Data is not a business model moving knowledge to action presentation
Data is not a business model  moving knowledge to action presentationData is not a business model  moving knowledge to action presentation
Data is not a business model moving knowledge to action presentation
 
Great Data Delivery: A model-based approach
Great Data Delivery: A model-based approachGreat Data Delivery: A model-based approach
Great Data Delivery: A model-based approach
 
Data Scientist: the Sexiest Job of the 21st Century
Data Scientist: the Sexiest Job of the 21st CenturyData Scientist: the Sexiest Job of the 21st Century
Data Scientist: the Sexiest Job of the 21st Century
 
Data Scientist: The Sexiest Job in the 21st Century
Data Scientist: The Sexiest Job in the 21st CenturyData Scientist: The Sexiest Job in the 21st Century
Data Scientist: The Sexiest Job in the 21st Century
 
When Big Data Meets Recruiting - HRM Asia March 2015 Presentation
When Big Data Meets Recruiting - HRM Asia March 2015 PresentationWhen Big Data Meets Recruiting - HRM Asia March 2015 Presentation
When Big Data Meets Recruiting - HRM Asia March 2015 Presentation
 
Technical Paper Presentation on data analytics.pptx
Technical Paper Presentation on data analytics.pptxTechnical Paper Presentation on data analytics.pptx
Technical Paper Presentation on data analytics.pptx
 
BIAM 410 Final Paper - Beyond the Buzzwords: Big Data, Machine Learning, What...
BIAM 410 Final Paper - Beyond the Buzzwords: Big Data, Machine Learning, What...BIAM 410 Final Paper - Beyond the Buzzwords: Big Data, Machine Learning, What...
BIAM 410 Final Paper - Beyond the Buzzwords: Big Data, Machine Learning, What...
 
Deck 92-146 (3)
Deck 92-146 (3)Deck 92-146 (3)
Deck 92-146 (3)
 
How to unlock new data-driven potential for your organization
How to unlock new data-driven potential for your organizationHow to unlock new data-driven potential for your organization
How to unlock new data-driven potential for your organization
 
An overview of hr analytics
An overview of hr analyticsAn overview of hr analytics
An overview of hr analytics
 
-- The Cognitive Engine - 10RULE WHITE PAPER
-- The Cognitive Engine - 10RULE WHITE PAPER-- The Cognitive Engine - 10RULE WHITE PAPER
-- The Cognitive Engine - 10RULE WHITE PAPER
 
Digital analytics: Wrap-up (Lecture 12)
Digital analytics: Wrap-up (Lecture 12)Digital analytics: Wrap-up (Lecture 12)
Digital analytics: Wrap-up (Lecture 12)
 
Sweeny group think-ias2015
Sweeny group think-ias2015Sweeny group think-ias2015
Sweeny group think-ias2015
 
Business Intelligence Insights: How to Present Visual Data your Team Understands
Business Intelligence Insights: How to Present Visual Data your Team UnderstandsBusiness Intelligence Insights: How to Present Visual Data your Team Understands
Business Intelligence Insights: How to Present Visual Data your Team Understands
 
FROM DATA TO ACTIONA HARVARD BUSINESS REVIEW INSIGHT CE.docx
FROM DATA  TO ACTIONA HARVARD BUSINESS REVIEW INSIGHT CE.docxFROM DATA  TO ACTIONA HARVARD BUSINESS REVIEW INSIGHT CE.docx
FROM DATA TO ACTIONA HARVARD BUSINESS REVIEW INSIGHT CE.docx
 
Running title TRENDS IN COMPUTER INFORMATION SYSTEMS1TRENDS I.docx
Running title TRENDS IN COMPUTER INFORMATION SYSTEMS1TRENDS I.docxRunning title TRENDS IN COMPUTER INFORMATION SYSTEMS1TRENDS I.docx
Running title TRENDS IN COMPUTER INFORMATION SYSTEMS1TRENDS I.docx
 
Alex Porter's Smart Attribution presentation from SESNY 2013
Alex Porter's Smart Attribution presentation from SESNY 2013Alex Porter's Smart Attribution presentation from SESNY 2013
Alex Porter's Smart Attribution presentation from SESNY 2013
 
What People Analytics Can’t Capture
What People Analytics Can’t Capture What People Analytics Can’t Capture
What People Analytics Can’t Capture
 
Text Analysis for Social Media
Text Analysis for Social MediaText Analysis for Social Media
Text Analysis for Social Media
 
How Your Data Can Predict The Future
How Your Data Can Predict The FutureHow Your Data Can Predict The Future
How Your Data Can Predict The Future
 

More from neuroassociates

Bloter 넥스트 저널리즘 스쿨 강의자료
Bloter 넥스트 저널리즘 스쿨 강의자료Bloter 넥스트 저널리즘 스쿨 강의자료
Bloter 넥스트 저널리즘 스쿨 강의자료
neuroassociates
 
[Week20] D3.js_Mapping
[Week20] D3.js_Mapping[Week20] D3.js_Mapping
[Week20] D3.js_Mapping
neuroassociates
 
[week17] D3.js_Tooltip
[week17] D3.js_Tooltip[week17] D3.js_Tooltip
[week17] D3.js_Tooltip
neuroassociates
 
[week16] D3.js_Transition
[week16] D3.js_Transition[week16] D3.js_Transition
[week16] D3.js_Transition
neuroassociates
 
[Week15] D3.js_Scatter_Chart
[Week15] D3.js_Scatter_Chart[Week15] D3.js_Scatter_Chart
[Week15] D3.js_Scatter_Chart
neuroassociates
 
[Week14] D3.js_Scale and Axis (보충자료)
[Week14] D3.js_Scale and Axis (보충자료)[Week14] D3.js_Scale and Axis (보충자료)
[Week14] D3.js_Scale and Axis (보충자료)
neuroassociates
 
[Week14] D3.js_Scale and Axis
[Week14] D3.js_Scale and Axis[Week14] D3.js_Scale and Axis
[Week14] D3.js_Scale and Axis
neuroassociates
 
[Week13] D3.js_Bar Chart
[Week13] D3.js_Bar Chart[Week13] D3.js_Bar Chart
[Week13] D3.js_Bar Chart
neuroassociates
 
[Week12] D3.js_Basic2
[Week12] D3.js_Basic2[Week12] D3.js_Basic2
[Week12] D3.js_Basic2
neuroassociates
 
[week7] 데이터읽어주는남자
[week7] 데이터읽어주는남자[week7] 데이터읽어주는남자
[week7] 데이터읽어주는남자
neuroassociates
 
[week6] 데이터읽어주는남자
[week6] 데이터읽어주는남자[week6] 데이터읽어주는남자
[week6] 데이터읽어주는남자
neuroassociates
 
[week12] D3.js_Basic
[week12] D3.js_Basic[week12] D3.js_Basic
[week12] D3.js_Basic
neuroassociates
 
[week11] R_ggmap, leaflet
[week11] R_ggmap, leaflet[week11] R_ggmap, leaflet
[week11] R_ggmap, leaflet
neuroassociates
 
[week9]R_statics
[week9]R_statics[week9]R_statics
[week9]R_statics
neuroassociates
 
[Week8]R_ggplot2
[Week8]R_ggplot2[Week8]R_ggplot2
[Week8]R_ggplot2
neuroassociates
 
[week7]R_Wrangling(2)
[week7]R_Wrangling(2)[week7]R_Wrangling(2)
[week7]R_Wrangling(2)
neuroassociates
 
[week6]R_Wrangling
[week6]R_Wrangling[week6]R_Wrangling
[week6]R_Wrangling
neuroassociates
 
[Week5]데이터읽어주는남자
[Week5]데이터읽어주는남자[Week5]데이터읽어주는남자
[Week5]데이터읽어주는남자
neuroassociates
 
[Week5]R_scraping
[Week5]R_scraping[Week5]R_scraping
[Week5]R_scraping
neuroassociates
 
[Week4]데이터읽어주는남자
[Week4]데이터읽어주는남자[Week4]데이터읽어주는남자
[Week4]데이터읽어주는남자
neuroassociates
 

More from neuroassociates (20)

Bloter 넥스트 저널리즘 스쿨 강의자료
Bloter 넥스트 저널리즘 스쿨 강의자료Bloter 넥스트 저널리즘 스쿨 강의자료
Bloter 넥스트 저널리즘 스쿨 강의자료
 
[Week20] D3.js_Mapping
[Week20] D3.js_Mapping[Week20] D3.js_Mapping
[Week20] D3.js_Mapping
 
[week17] D3.js_Tooltip
[week17] D3.js_Tooltip[week17] D3.js_Tooltip
[week17] D3.js_Tooltip
 
[week16] D3.js_Transition
[week16] D3.js_Transition[week16] D3.js_Transition
[week16] D3.js_Transition
 
[Week15] D3.js_Scatter_Chart
[Week15] D3.js_Scatter_Chart[Week15] D3.js_Scatter_Chart
[Week15] D3.js_Scatter_Chart
 
[Week14] D3.js_Scale and Axis (보충자료)
[Week14] D3.js_Scale and Axis (보충자료)[Week14] D3.js_Scale and Axis (보충자료)
[Week14] D3.js_Scale and Axis (보충자료)
 
[Week14] D3.js_Scale and Axis
[Week14] D3.js_Scale and Axis[Week14] D3.js_Scale and Axis
[Week14] D3.js_Scale and Axis
 
[Week13] D3.js_Bar Chart
[Week13] D3.js_Bar Chart[Week13] D3.js_Bar Chart
[Week13] D3.js_Bar Chart
 
[Week12] D3.js_Basic2
[Week12] D3.js_Basic2[Week12] D3.js_Basic2
[Week12] D3.js_Basic2
 
[week7] 데이터읽어주는남자
[week7] 데이터읽어주는남자[week7] 데이터읽어주는남자
[week7] 데이터읽어주는남자
 
[week6] 데이터읽어주는남자
[week6] 데이터읽어주는남자[week6] 데이터읽어주는남자
[week6] 데이터읽어주는남자
 
[week12] D3.js_Basic
[week12] D3.js_Basic[week12] D3.js_Basic
[week12] D3.js_Basic
 
[week11] R_ggmap, leaflet
[week11] R_ggmap, leaflet[week11] R_ggmap, leaflet
[week11] R_ggmap, leaflet
 
[week9]R_statics
[week9]R_statics[week9]R_statics
[week9]R_statics
 
[Week8]R_ggplot2
[Week8]R_ggplot2[Week8]R_ggplot2
[Week8]R_ggplot2
 
[week7]R_Wrangling(2)
[week7]R_Wrangling(2)[week7]R_Wrangling(2)
[week7]R_Wrangling(2)
 
[week6]R_Wrangling
[week6]R_Wrangling[week6]R_Wrangling
[week6]R_Wrangling
 
[Week5]데이터읽어주는남자
[Week5]데이터읽어주는남자[Week5]데이터읽어주는남자
[Week5]데이터읽어주는남자
 
[Week5]R_scraping
[Week5]R_scraping[Week5]R_scraping
[Week5]R_scraping
 
[Week4]데이터읽어주는남자
[Week4]데이터읽어주는남자[Week4]데이터읽어주는남자
[Week4]데이터읽어주는남자
 

Recently uploaded

Influence of Marketing Strategy and Market Competition on Business Plan
Influence of Marketing Strategy and Market Competition on Business PlanInfluence of Marketing Strategy and Market Competition on Business Plan
Influence of Marketing Strategy and Market Competition on Business Plan
jerlynmaetalle
 
Algorithmic optimizations for Dynamic Levelwise PageRank (from STICD) : SHORT...
Algorithmic optimizations for Dynamic Levelwise PageRank (from STICD) : SHORT...Algorithmic optimizations for Dynamic Levelwise PageRank (from STICD) : SHORT...
Algorithmic optimizations for Dynamic Levelwise PageRank (from STICD) : SHORT...
Subhajit Sahu
 
The affect of service quality and online reviews on customer loyalty in the E...
The affect of service quality and online reviews on customer loyalty in the E...The affect of service quality and online reviews on customer loyalty in the E...
The affect of service quality and online reviews on customer loyalty in the E...
jerlynmaetalle
 
Criminal IP - Threat Hunting Webinar.pdf
Criminal IP - Threat Hunting Webinar.pdfCriminal IP - Threat Hunting Webinar.pdf
Criminal IP - Threat Hunting Webinar.pdf
Criminal IP
 
Adjusting primitives for graph : SHORT REPORT / NOTES
Adjusting primitives for graph : SHORT REPORT / NOTESAdjusting primitives for graph : SHORT REPORT / NOTES
Adjusting primitives for graph : SHORT REPORT / NOTES
Subhajit Sahu
 
The Building Blocks of QuestDB, a Time Series Database
The Building Blocks of QuestDB, a Time Series DatabaseThe Building Blocks of QuestDB, a Time Series Database
The Building Blocks of QuestDB, a Time Series Database
javier ramirez
 
一比一原版(Coventry毕业证书)考文垂大学毕业证如何办理
一比一原版(Coventry毕业证书)考文垂大学毕业证如何办理一比一原版(Coventry毕业证书)考文垂大学毕业证如何办理
一比一原版(Coventry毕业证书)考文垂大学毕业证如何办理
74nqk8xf
 
一比一原版(CBU毕业证)卡普顿大学毕业证如何办理
一比一原版(CBU毕业证)卡普顿大学毕业证如何办理一比一原版(CBU毕业证)卡普顿大学毕业证如何办理
一比一原版(CBU毕业证)卡普顿大学毕业证如何办理
ahzuo
 
Chatty Kathy - UNC Bootcamp Final Project Presentation - Final Version - 5.23...
Chatty Kathy - UNC Bootcamp Final Project Presentation - Final Version - 5.23...Chatty Kathy - UNC Bootcamp Final Project Presentation - Final Version - 5.23...
Chatty Kathy - UNC Bootcamp Final Project Presentation - Final Version - 5.23...
John Andrews
 
哪里卖(usq毕业证书)南昆士兰大学毕业证研究生文凭证书托福证书原版一模一样
哪里卖(usq毕业证书)南昆士兰大学毕业证研究生文凭证书托福证书原版一模一样哪里卖(usq毕业证书)南昆士兰大学毕业证研究生文凭证书托福证书原版一模一样
哪里卖(usq毕业证书)南昆士兰大学毕业证研究生文凭证书托福证书原版一模一样
axoqas
 
06-04-2024 - NYC Tech Week - Discussion on Vector Databases, Unstructured Dat...
06-04-2024 - NYC Tech Week - Discussion on Vector Databases, Unstructured Dat...06-04-2024 - NYC Tech Week - Discussion on Vector Databases, Unstructured Dat...
06-04-2024 - NYC Tech Week - Discussion on Vector Databases, Unstructured Dat...
Timothy Spann
 
一比一原版(BCU毕业证书)伯明翰城市大学毕业证如何办理
一比一原版(BCU毕业证书)伯明翰城市大学毕业证如何办理一比一原版(BCU毕业证书)伯明翰城市大学毕业证如何办理
一比一原版(BCU毕业证书)伯明翰城市大学毕业证如何办理
dwreak4tg
 
做(mqu毕业证书)麦考瑞大学毕业证硕士文凭证书学费发票原版一模一样
做(mqu毕业证书)麦考瑞大学毕业证硕士文凭证书学费发票原版一模一样做(mqu毕业证书)麦考瑞大学毕业证硕士文凭证书学费发票原版一模一样
做(mqu毕业证书)麦考瑞大学毕业证硕士文凭证书学费发票原版一模一样
axoqas
 
Everything you wanted to know about LIHTC
Everything you wanted to know about LIHTCEverything you wanted to know about LIHTC
Everything you wanted to know about LIHTC
Roger Valdez
 
【社内勉強会資料_Octo: An Open-Source Generalist Robot Policy】
【社内勉強会資料_Octo: An Open-Source Generalist Robot Policy】【社内勉強会資料_Octo: An Open-Source Generalist Robot Policy】
【社内勉強会資料_Octo: An Open-Source Generalist Robot Policy】
NABLAS株式会社
 
Quantitative Data AnalysisReliability Analysis (Cronbach Alpha) Common Method...
Quantitative Data AnalysisReliability Analysis (Cronbach Alpha) Common Method...Quantitative Data AnalysisReliability Analysis (Cronbach Alpha) Common Method...
Quantitative Data AnalysisReliability Analysis (Cronbach Alpha) Common Method...
2023240532
 
My burning issue is homelessness K.C.M.O.
My burning issue is homelessness K.C.M.O.My burning issue is homelessness K.C.M.O.
My burning issue is homelessness K.C.M.O.
rwarrenll
 
一比一原版(UniSA毕业证书)南澳大学毕业证如何办理
一比一原版(UniSA毕业证书)南澳大学毕业证如何办理一比一原版(UniSA毕业证书)南澳大学毕业证如何办理
一比一原版(UniSA毕业证书)南澳大学毕业证如何办理
slg6lamcq
 
06-04-2024 - NYC Tech Week - Discussion on Vector Databases, Unstructured Dat...
06-04-2024 - NYC Tech Week - Discussion on Vector Databases, Unstructured Dat...06-04-2024 - NYC Tech Week - Discussion on Vector Databases, Unstructured Dat...
06-04-2024 - NYC Tech Week - Discussion on Vector Databases, Unstructured Dat...
Timothy Spann
 
一比一原版(UofS毕业证书)萨省大学毕业证如何办理
一比一原版(UofS毕业证书)萨省大学毕业证如何办理一比一原版(UofS毕业证书)萨省大学毕业证如何办理
一比一原版(UofS毕业证书)萨省大学毕业证如何办理
v3tuleee
 

Recently uploaded (20)

Influence of Marketing Strategy and Market Competition on Business Plan
Influence of Marketing Strategy and Market Competition on Business PlanInfluence of Marketing Strategy and Market Competition on Business Plan
Influence of Marketing Strategy and Market Competition on Business Plan
 
Algorithmic optimizations for Dynamic Levelwise PageRank (from STICD) : SHORT...
Algorithmic optimizations for Dynamic Levelwise PageRank (from STICD) : SHORT...Algorithmic optimizations for Dynamic Levelwise PageRank (from STICD) : SHORT...
Algorithmic optimizations for Dynamic Levelwise PageRank (from STICD) : SHORT...
 
The affect of service quality and online reviews on customer loyalty in the E...
The affect of service quality and online reviews on customer loyalty in the E...The affect of service quality and online reviews on customer loyalty in the E...
The affect of service quality and online reviews on customer loyalty in the E...
 
Criminal IP - Threat Hunting Webinar.pdf
Criminal IP - Threat Hunting Webinar.pdfCriminal IP - Threat Hunting Webinar.pdf
Criminal IP - Threat Hunting Webinar.pdf
 
Adjusting primitives for graph : SHORT REPORT / NOTES
Adjusting primitives for graph : SHORT REPORT / NOTESAdjusting primitives for graph : SHORT REPORT / NOTES
Adjusting primitives for graph : SHORT REPORT / NOTES
 
The Building Blocks of QuestDB, a Time Series Database
The Building Blocks of QuestDB, a Time Series DatabaseThe Building Blocks of QuestDB, a Time Series Database
The Building Blocks of QuestDB, a Time Series Database
 
一比一原版(Coventry毕业证书)考文垂大学毕业证如何办理
一比一原版(Coventry毕业证书)考文垂大学毕业证如何办理一比一原版(Coventry毕业证书)考文垂大学毕业证如何办理
一比一原版(Coventry毕业证书)考文垂大学毕业证如何办理
 
一比一原版(CBU毕业证)卡普顿大学毕业证如何办理
一比一原版(CBU毕业证)卡普顿大学毕业证如何办理一比一原版(CBU毕业证)卡普顿大学毕业证如何办理
一比一原版(CBU毕业证)卡普顿大学毕业证如何办理
 
Chatty Kathy - UNC Bootcamp Final Project Presentation - Final Version - 5.23...
Chatty Kathy - UNC Bootcamp Final Project Presentation - Final Version - 5.23...Chatty Kathy - UNC Bootcamp Final Project Presentation - Final Version - 5.23...
Chatty Kathy - UNC Bootcamp Final Project Presentation - Final Version - 5.23...
 
哪里卖(usq毕业证书)南昆士兰大学毕业证研究生文凭证书托福证书原版一模一样
哪里卖(usq毕业证书)南昆士兰大学毕业证研究生文凭证书托福证书原版一模一样哪里卖(usq毕业证书)南昆士兰大学毕业证研究生文凭证书托福证书原版一模一样
哪里卖(usq毕业证书)南昆士兰大学毕业证研究生文凭证书托福证书原版一模一样
 
06-04-2024 - NYC Tech Week - Discussion on Vector Databases, Unstructured Dat...
06-04-2024 - NYC Tech Week - Discussion on Vector Databases, Unstructured Dat...06-04-2024 - NYC Tech Week - Discussion on Vector Databases, Unstructured Dat...
06-04-2024 - NYC Tech Week - Discussion on Vector Databases, Unstructured Dat...
 
一比一原版(BCU毕业证书)伯明翰城市大学毕业证如何办理
一比一原版(BCU毕业证书)伯明翰城市大学毕业证如何办理一比一原版(BCU毕业证书)伯明翰城市大学毕业证如何办理
一比一原版(BCU毕业证书)伯明翰城市大学毕业证如何办理
 
做(mqu毕业证书)麦考瑞大学毕业证硕士文凭证书学费发票原版一模一样
做(mqu毕业证书)麦考瑞大学毕业证硕士文凭证书学费发票原版一模一样做(mqu毕业证书)麦考瑞大学毕业证硕士文凭证书学费发票原版一模一样
做(mqu毕业证书)麦考瑞大学毕业证硕士文凭证书学费发票原版一模一样
 
Everything you wanted to know about LIHTC
Everything you wanted to know about LIHTCEverything you wanted to know about LIHTC
Everything you wanted to know about LIHTC
 
【社内勉強会資料_Octo: An Open-Source Generalist Robot Policy】
【社内勉強会資料_Octo: An Open-Source Generalist Robot Policy】【社内勉強会資料_Octo: An Open-Source Generalist Robot Policy】
【社内勉強会資料_Octo: An Open-Source Generalist Robot Policy】
 
Quantitative Data AnalysisReliability Analysis (Cronbach Alpha) Common Method...
Quantitative Data AnalysisReliability Analysis (Cronbach Alpha) Common Method...Quantitative Data AnalysisReliability Analysis (Cronbach Alpha) Common Method...
Quantitative Data AnalysisReliability Analysis (Cronbach Alpha) Common Method...
 
My burning issue is homelessness K.C.M.O.
My burning issue is homelessness K.C.M.O.My burning issue is homelessness K.C.M.O.
My burning issue is homelessness K.C.M.O.
 
一比一原版(UniSA毕业证书)南澳大学毕业证如何办理
一比一原版(UniSA毕业证书)南澳大学毕业证如何办理一比一原版(UniSA毕业证书)南澳大学毕业证如何办理
一比一原版(UniSA毕业证书)南澳大学毕业证如何办理
 
06-04-2024 - NYC Tech Week - Discussion on Vector Databases, Unstructured Dat...
06-04-2024 - NYC Tech Week - Discussion on Vector Databases, Unstructured Dat...06-04-2024 - NYC Tech Week - Discussion on Vector Databases, Unstructured Dat...
06-04-2024 - NYC Tech Week - Discussion on Vector Databases, Unstructured Dat...
 
一比一原版(UofS毕业证书)萨省大学毕业证如何办理
一比一原版(UofS毕业证书)萨省大学毕业证如何办理一比一原版(UofS毕业证书)萨省大学毕业证如何办理
一比一原版(UofS毕业证书)萨省大学毕业证如何办理
 

[Week3]데이터읽어주는남자

  • 2. 김영웅 주간 데이터 읽어주는 남자 꿈꾸는 데이터 디자이너 매니저 경영정보시스템 전공 박사과정 경영전문대학원 MBA 컴퓨터공학 전공 Ryan Kim | Convergence Business Designer Facebook. https://www.facebook.com/keyassist E-mail. youngwung.kim@gmail.com Web. http://keyassist.tistory.com
  • 3. When Data Visualization Works — And When It Doesn’t
  • 4. data visualization is about communicating an idea that will drive action. Harvard Business Review MARCH 27, 2013 “When Data Visualization Works — And When It Doesn’t”
  • 5. the reasoning behind constructing data visualizations will help you do that with efficiency and impact. Harvard Business Review MARCH 27, 2013 “When Data Visualization Works — And When It Doesn’t”
  • 6. For information to provide valuable insights, it must be interpretable, relevant, and novel. Harvard Business Review MARCH 27, 2013 “When Data Visualization Works — And When It Doesn’t”
  • 7. Collecting lots of data without the associated metadata reduces the opportunity to play with, interpret, and gain insights from the data. Harvard Business Review MARCH 27, 2013 “When Data Visualization Works — And When It Doesn’t”
  • 8. It must also be relevant to the persons who are looking to gain insights, and to the purpose for which the information is being examined. Harvard Business Review MARCH 27, 2013 “When Data Visualization Works — And When It Doesn’t”
  • 9. it must be original, or shed new light on an area. If the information fails any one of these criteria, then no visualization can make it valuable. Harvard Business Review MARCH 27, 2013 “When Data Visualization Works — And When It Doesn’t”
  • 10. There are three broad reasons for visualizing data Harvard Business Review MARCH 27, 2013 “When Data Visualization Works — And When It Doesn’t”
  • 11. Confirmation: If we already have a set of assumptions about how the system we are interested in. visualizations can help us check those assumptions. Harvard Business Review MARCH 27, 2013 “When Data Visualization Works — And When It Doesn’t”
  • 12. Education: One is simply reporting. The other is to develop intuition and new insight. Harvard Business Review MARCH 27, 2013 “When Data Visualization Works — And When It Doesn’t”
  • 13. Exploration: We can use visualization to help build a model to allow us to predict and better manage the system. Harvard Business Review MARCH 27, 2013 “When Data Visualization Works — And When It Doesn’t”
  • 14. what gives us confidence that these insights are now worthy of action? Harvard Business Review MARCH 27, 2013 “When Data Visualization Works — And When It Doesn’t”
  • 15. Data quality: The quality of the underlying data is crucial to the value of visualization. How complete and reliable is it? Harvard Business Review MARCH 27, 2013 “When Data Visualization Works — And When It Doesn’t”
  • 16. Context: The point of visualization is to make large amounts of data approachable so we can apply our evolutionarily honed pattern detection computer to draw insights from it. Harvard Business Review MARCH 27, 2013 “When Data Visualization Works — And When It Doesn’t”
  • 17. To leave out any contextual information or metadata (or more appropriately, “metacontent”) is to risk hampering our understanding. Harvard Business Review MARCH 27, 2013 “When Data Visualization Works — And When It Doesn’t”
  • 18. Biases: The creator of the visualization may influence the semantics of the visualization. any of which can challenge the interpretation of the data. Harvard Business Review MARCH 27, 2013 “When Data Visualization Works — And When It Doesn’t”
  • 19. This also creates the risk of “pre-specifying” discoverable features and results via the embedded algorithms used by the creator. Harvard Business Review MARCH 27, 2013 “When Data Visualization Works — And When It Doesn’t”
  • 20. When Data Visualization Works — And When It Doesn’t
  • 21. The Best Data Visualization Projects of 2014 <source=http://flowingdata.com/>
  • 23. Where We Came From and Where We Went
  • 24. The Most Detailed Maps You’ll See From the Midterm Elections
  • 25. How the Recession Reshaped the Economy, in 255 Charts
  • 27. Bostock demonstrated processes and patterns in a wide array of algorithms for sorting, sampling, and maze generation. The result was a useful learning resource and an appreciation for something that's otherwise a challenge to imagine for most people.
  • 28. Visualizing MBTA Data An interactive exploration of Boston's subway system
  • 29. Boston’s Massachusetts Bay Transit Authority (MBTA) operates the 4th busiest subway system in the U.S. after New York, Washington, and Chicago.
  • 30. SELFIECITY Investigating the style of self-portraits (selfies) in five cities across the world
  • 32. NeuroAssociates ・ Portfolio : neuroassociates.co.kr/portfolio ・ Address : 서울특별시 마포구 상수동 145-1 6F ・ Site : neuroassociates.co.kr ・ Mail : neuro.associates.consulting@gmail.com or info@neuroassociates.co.kr ・ SNS : www.facebook.com/neuroassociatessns ・ Phone : 02-334-2013