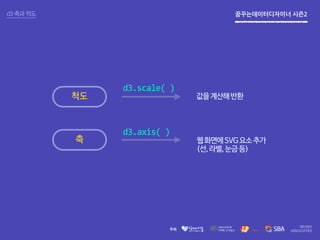
꿈꾸는데이터디자이너 시즌2d3.axis( )
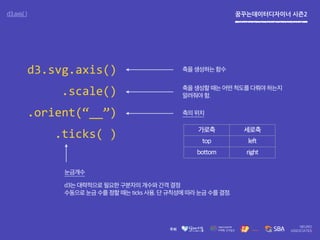
축을생성하는 함수
축을 생성할 때는 어떤 척도를 다뤄야 하는지
알려줘야 함.
축의 위치
가로축 세로축
top left
bottom right
d3.svg.axis()
.scale()
.orient(“__”)
.ticks( )
눈금개수
d3는 대략적으로 필요한 구분자의 개수와 간격 결정
수동으로 눈금 수를 정할 때는 ticks 사용. 단 규칙성에 따라 눈금 수를 결정.
꿈꾸는데이터디자이너 시즌2[실습] d3.jsscale & axis
Tip svg ‘g’ 개념
g
‘그룹’.다른문서요소를묶어서담는역할.위치를차지하지않고,보이지않는다.
svg.append(“g”)
.call(yAxis);
var yAxis =d3.svg.axis()
.scale(yScale)
.orient(“bottom”);
SVG 안에 g 생성
yAxis 호출
g 안에 축 요소 생성
축함수는SVG관련요소를추가한다.
때문에문서요소가어디에있어야하는지정해줘야한다.
이를위해미리그룹을생성한후축요소를추가한다.
15.
꿈꾸는데이터디자이너 시즌2[실습] d3.jsscale & axis
Tip HTML의 요소 영역 개념과 나열 방향
상
HTML의방향은상우하좌!
Border
Content
Padding
Margin
하
좌 우
꿈꾸는데이터디자이너 시즌2
rangeBand rangeBandrangeBand
전체 범위
padding paddingouterPadding outerPadding
나눠진 범위
[실습] d3.js scale & axis
.rangeBand
https://github.com/mbostock/d3/wiki/Ordinal-Scales[참고링크]
막대그래프의항목명을전체범위에맞게자동으로계산해항목을나열함
22.
꿈꾸는데이터디자이너 시즌2[실습] d3.jsscale & axis
Tip 숫자 1,000단위 구분 콤마(,) 추가
d3.format
d3내에서숫자형식을다루는메서드
d3.format(“,”)
d3.format(“,.2f”)
d3.format(“,%”)
10000
10,000
10,000.00
10,000%
https://github.com/mbostock/d3/wiki/Formatting[참고링크]
23.
꿈꾸는데이터디자이너 시즌2[실습] d3.jsscale & axis
Tip SVG Text요소 정렬하기
text-anchor
SVGText요소의정렬은text-anchor속성을이용한다.
https://developer.mozilla.org/en-US/docs/Web/SVG/Attribute/text-anchor[참고링크]
A
A
Astart
middle
end
왼쪽정렬
가운데정렬
오른쪽정렬
24.
Neuro Associates
・ Portfolio: neuroassociates.co.kr/portfolio
・ Address : 서울특별시 마포구 상수동 145-1 6F
・ Site : neuroassociates.co.kr
・ Mail : neuro.associates.consulting@gmail.com or info@neuroassociates.co.kr
・ SNS : www.facebook.com/neuroassociatessns
・ Phone : 02-334-2013


![꿈꾸는데이터디자이너 시즌2
01_scale_test_blank.html
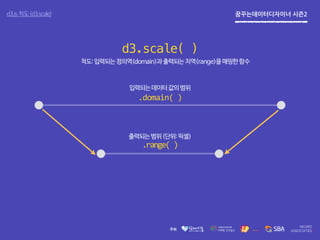
d3.scale.linear( )
.domain[시작점, 끝점]
.range[시작점, 끝점]
여기는척도의종류에따라바뀝니다
d3.js 척도 (d3.scale)
척도를설정하기위해서는 척도의종류,입력하는데이터값의범위,출력되는범위가모두필요하다
data
d3.scale
data](https://image.slidesharecdn.com/week4d3-151011033640-lva1-app6892/85/Week14-D3-js_Scale-and-Axis-6-320.jpg)


![꿈꾸는데이터디자이너 시즌2[실습 ] 오늘의 결과물
02_bar_blank.html](https://image.slidesharecdn.com/week4d3-151011033640-lva1-app6892/85/Week14-D3-js_Scale-and-Axis-13-320.jpg)
![꿈꾸는데이터디자이너 시즌2[실습] d3.js scale & axis
Tip svg ‘g’ 개념
g
‘그룹’.다른문서요소를묶어서담는역할.위치를차지하지않고,보이지않는다.
svg.append(“g”)
.call(yAxis);
var yAxis =d3.svg.axis()
.scale(yScale)
.orient(“bottom”);
SVG 안에 g 생성
yAxis 호출
g 안에 축 요소 생성
축함수는SVG관련요소를추가한다.
때문에문서요소가어디에있어야하는지정해줘야한다.
이를위해미리그룹을생성한후축요소를추가한다.](https://image.slidesharecdn.com/week4d3-151011033640-lva1-app6892/85/Week14-D3-js_Scale-and-Axis-14-320.jpg)
![꿈꾸는데이터디자이너 시즌2[실습] d3.js scale & axis
Tip HTML의 요소 영역 개념과 나열 방향
상
HTML의방향은상우하좌!
Border
Content
Padding
Margin
하
좌 우](https://image.slidesharecdn.com/week4d3-151011033640-lva1-app6892/85/Week14-D3-js_Scale-and-Axis-15-320.jpg)
![꿈꾸는데이터디자이너 시즌2
D3.js 그래프 요소 자리
y축
x축
전체 영역
여백
[실습] d3.js scale & axis
이동](https://image.slidesharecdn.com/week4d3-151011033640-lva1-app6892/85/Week14-D3-js_Scale-and-Axis-16-320.jpg)
![꿈꾸는데이터디자이너 시즌2[실습] d3.js scale & axis
top
이동
bottom
left right
translate(" + margin.left + "," + margin.top + ")")
x y](https://image.slidesharecdn.com/week4d3-151011033640-lva1-app6892/85/Week14-D3-js_Scale-and-Axis-17-320.jpg)
![꿈꾸는데이터디자이너 시즌2
x축
y축
[실습] d3.js scale & axis
x축은위치를지정하지않으면상단에생성된다](https://image.slidesharecdn.com/week4d3-151011033640-lva1-app6892/85/Week14-D3-js_Scale-and-Axis-18-320.jpg)
![꿈꾸는데이터디자이너 시즌2
.attr("transform", "translate(0," + height + ")")
x축
y축
[실습] d3.js scale & axis
translate기능을이용해x축을아래로이동한다](https://image.slidesharecdn.com/week4d3-151011033640-lva1-app6892/85/Week14-D3-js_Scale-and-Axis-19-320.jpg)
![꿈꾸는데이터디자이너 시즌2[실습] d3.js scale & axis
.domain(data.map)?
1. 막대그래프는서열척도이기때문에항목명을나열해야한다.
2. 원래형태는항목명을.domain에일일이나열해야한다.
var x = d3.scale.ordinal()
.domain([“중구”, "종로구", “서대문구" (…)])
.rangeBands([0, width], .1);
3.데이터항목이많아질수록일일이입력하는것은한계가있다.
4.(.map)메서드를이용해배열로만들어데이터를삽입한다.
Tip 자바스크립트 ‘배열(Array)’
[“A”, “B”, “C”, “D”, “E”, “F”, “G”, “H”]
자바스크립트의배열은데이터값을하나의목록으로만든것.배열의개별값은원소(element)라고부른다.
http://bost.ocks.org/mike/bar/3/[참고링크]](https://image.slidesharecdn.com/week4d3-151011033640-lva1-app6892/85/Week14-D3-js_Scale-and-Axis-20-320.jpg)
![꿈꾸는데이터디자이너 시즌2
rangeBand rangeBand rangeBand
전체 범위
padding paddingouterPadding outerPadding
나눠진 범위
[실습] d3.js scale & axis
.rangeBand
https://github.com/mbostock/d3/wiki/Ordinal-Scales[참고링크]
막대그래프의항목명을전체범위에맞게자동으로계산해항목을나열함](https://image.slidesharecdn.com/week4d3-151011033640-lva1-app6892/85/Week14-D3-js_Scale-and-Axis-21-320.jpg)
![꿈꾸는데이터디자이너 시즌2[실습] d3.js scale & axis
Tip 숫자 1,000단위 구분 콤마(,) 추가
d3.format
d3내에서숫자형식을다루는메서드
d3.format(“,”)
d3.format(“,.2f”)
d3.format(“,%”)
10000
10,000
10,000.00
10,000%
https://github.com/mbostock/d3/wiki/Formatting[참고링크]](https://image.slidesharecdn.com/week4d3-151011033640-lva1-app6892/85/Week14-D3-js_Scale-and-Axis-22-320.jpg)
![꿈꾸는데이터디자이너 시즌2[실습] d3.js scale & axis
Tip SVG Text요소 정렬하기
text-anchor
SVGText요소의정렬은text-anchor속성을이용한다.
https://developer.mozilla.org/en-US/docs/Web/SVG/Attribute/text-anchor[참고링크]
A
A
Astart
middle
end
왼쪽정렬
가운데정렬
오른쪽정렬](https://image.slidesharecdn.com/week4d3-151011033640-lva1-app6892/85/Week14-D3-js_Scale-and-Axis-23-320.jpg)


![[Week15] D3.js_Scatter_Chart](https://cdn.slidesharecdn.com/ss_thumbnails/2d3js5-151014035535-lva1-app6892-thumbnail.jpg?width=640&height=640&fit=bounds)
![[Week8]R_ggplot2](https://cdn.slidesharecdn.com/ss_thumbnails/week8rggplot2-150913001335-lva1-app6891-thumbnail.jpg?width=640&height=640&fit=bounds)
![[week16] D3.js_Transition](https://cdn.slidesharecdn.com/ss_thumbnails/2d3js6-151018032608-lva1-app6891-thumbnail.jpg?width=640&height=640&fit=bounds)
![[week17] D3.js_Tooltip](https://cdn.slidesharecdn.com/ss_thumbnails/2d3js7-151021033054-lva1-app6892-thumbnail.jpg?width=640&height=640&fit=bounds)
![[week6]R_Wrangling](https://cdn.slidesharecdn.com/ss_thumbnails/datadesigner-r-04-150906032721-lva1-app6892-thumbnail.jpg?width=640&height=640&fit=bounds)
![[Week14] D3.js_Scale and Axis (보충자료)](https://cdn.slidesharecdn.com/ss_thumbnails/2d3js42-151011111651-lva1-app6891-thumbnail.jpg?width=640&height=640&fit=bounds)
![[week11] R_ggmap, leaflet](https://cdn.slidesharecdn.com/ss_thumbnails/datadesigner-r-07-150923032312-lva1-app6891-thumbnail.jpg?width=640&height=640&fit=bounds)
![[시즌2, week3] R Basic](https://cdn.slidesharecdn.com/ss_thumbnails/datadesigner-r-02-150825143753-lva1-app6891-thumbnail.jpg?width=640&height=640&fit=bounds)
![[Week13] D3.js_Bar Chart](https://cdn.slidesharecdn.com/ss_thumbnails/week3d3-151007011322-lva1-app6892-thumbnail.jpg?width=640&height=640&fit=bounds)
![[week12] D3.js_Basic](https://cdn.slidesharecdn.com/ss_thumbnails/2d3js1-150930011102-lva1-app6892-thumbnail.jpg?width=640&height=640&fit=bounds)
![[week16] D3.js (Scale & axis)](https://cdn.slidesharecdn.com/ss_thumbnails/d3-150410223256-conversion-gate01-thumbnail.jpg?width=640&height=640&fit=bounds)
![[Week12] D3.js_Basic2](https://cdn.slidesharecdn.com/ss_thumbnails/week2d3-151004003519-lva1-app6891-thumbnail.jpg?width=640&height=640&fit=bounds)


![[week14] Getting started with D3.js](https://cdn.slidesharecdn.com/ss_thumbnails/d3-150331194754-conversion-gate01-thumbnail.jpg?width=640&height=640&fit=bounds)


![[0129 박민근] direct x2d](https://cdn.slidesharecdn.com/ss_thumbnails/0129directx2d-110207003154-phpapp02-thumbnail.jpg?width=640&height=640&fit=bounds)

![[0602 박민근] Direct2D](https://cdn.slidesharecdn.com/ss_thumbnails/0602direct2d-110602111737-phpapp01-thumbnail.jpg?width=640&height=640&fit=bounds)
![[Week5]R_scraping](https://cdn.slidesharecdn.com/ss_thumbnails/week5rscraping-150902002731-lva1-app6891-thumbnail.jpg?width=640&height=640&fit=bounds)


![[Week20] D3.js_Mapping](https://cdn.slidesharecdn.com/ss_thumbnails/week19mapping-151028033253-lva1-app6892-thumbnail.jpg?width=640&height=640&fit=bounds)
![[week8] 데이터읽어주는남자](https://cdn.slidesharecdn.com/ss_thumbnails/8final-151016015556-lva1-app6891-thumbnail.jpg?width=640&height=640&fit=bounds)
![[week7] 데이터읽어주는남자](https://cdn.slidesharecdn.com/ss_thumbnails/7-151001021639-lva1-app6892-thumbnail.jpg?width=640&height=640&fit=bounds)
![[week6] 데이터읽어주는남자](https://cdn.slidesharecdn.com/ss_thumbnails/6-2-151001021527-lva1-app6891-thumbnail.jpg?width=640&height=640&fit=bounds)
![[week9]R_statics](https://cdn.slidesharecdn.com/ss_thumbnails/r150916-150916024827-lva1-app6892-thumbnail.jpg?width=640&height=640&fit=bounds)
![[week7]R_Wrangling(2)](https://cdn.slidesharecdn.com/ss_thumbnails/datadesigner-r-05-150908144745-lva1-app6891-thumbnail.jpg?width=640&height=640&fit=bounds)
![[Week5]데이터읽어주는남자](https://cdn.slidesharecdn.com/ss_thumbnails/week5-150902003018-lva1-app6892-thumbnail.jpg?width=640&height=640&fit=bounds)
![[Week4]데이터읽어주는남자](https://cdn.slidesharecdn.com/ss_thumbnails/week4-150831083756-lva1-app6892-thumbnail.jpg?width=640&height=640&fit=bounds)
![[Week4] Google refine](https://cdn.slidesharecdn.com/ss_thumbnails/week4googlerefinelecture-150830004221-lva1-app6892-thumbnail.jpg?width=640&height=640&fit=bounds)
![[Week3]데이터읽어주는남자](https://cdn.slidesharecdn.com/ss_thumbnails/week3-150826083652-lva1-app6891-thumbnail.jpg?width=640&height=640&fit=bounds)
![[Week2]데이터읽어주는남자](https://cdn.slidesharecdn.com/ss_thumbnails/week2-150826002440-lva1-app6891-thumbnail.jpg?width=640&height=640&fit=bounds)


![[Week10] R graphics](https://cdn.slidesharecdn.com/ss_thumbnails/week10rgraphics-150224230109-conversion-gate02-thumbnail.jpg?width=640&height=640&fit=bounds)
![제 23회 보아즈(BOAZ) 빅데이터 컨퍼런스 - [백 투 더 엔지] : 분산환경 주문 이벤트 처리 플랫폼](https://cdn.slidesharecdn.com/ss_thumbnails/1-2boaz23rdconference-260203100241-73ce0aa8-thumbnail.jpg?width=640&height=640&fit=bounds)
![제 23회 보아즈(BOAZ) 빅데이터 컨퍼런스 - [If Lab] : 실시간 투표 커뮤니티 서비스 기반 데이터 파이프라인 구축 및 성능 검증](https://cdn.slidesharecdn.com/ss_thumbnails/2-1boaz23rdconferenceiflab-260203101556-e51663dd-thumbnail.jpg?width=640&height=640&fit=bounds)
![제 23회 보아즈(BOAZ) 빅데이터 컨퍼런스 - [북적북적] : 데이터 기반 독립출판사,서점 경영지원 대시보드](https://cdn.slidesharecdn.com/ss_thumbnails/1-1boaz23rdconference-260203093712-78abc1a0-thumbnail.jpg?width=640&height=640&fit=bounds)
![제 23회 보아즈(BOAZ) 빅데이터 컨퍼런스 - [SimAI] : Omni_모든 콘텐츠 운영을 하나로](https://cdn.slidesharecdn.com/ss_thumbnails/1-4boaz23rdconferencesimai-260203101225-d673a594-thumbnail.jpg?width=640&height=640&fit=bounds)
![제 23회 보아즈(BOAZ) 빅데이터 컨퍼런스 - [F4] : 시켜줘, 금잔디 명예 플로리스트](https://cdn.slidesharecdn.com/ss_thumbnails/3-3boaz23rdconferencef4-260204011323-1cb48ec9-thumbnail.jpg?width=640&height=640&fit=bounds)
![제 23회 보아즈(BOAZ) 빅데이터 컨퍼런스 - [OnLog]: Real-time Edge-to-Cloud Data Pipeline fo...](https://cdn.slidesharecdn.com/ss_thumbnails/3-4boaz23rdconferenceonlog-260204093729-11983ba7-thumbnail.jpg?width=640&height=640&fit=bounds)
![제 23회 보아즈(BOAZ) 빅데이터 컨퍼런스 - [픽미] : 디저트 큐레이팅 플랫폼, 딸기로픽을 위한 데이터 기반 의사결정 프로세스 구축](https://cdn.slidesharecdn.com/ss_thumbnails/3-2boaz23rdconference-260203102931-15458767-thumbnail.jpg?width=640&height=640&fit=bounds)
![제 23회 보아즈(BOAZ) 빅데이터 컨퍼런스 - [어벤정스] : ToonP](https://cdn.slidesharecdn.com/ss_thumbnails/2-2boaz23rdconference-260203102006-3a01358e-thumbnail.jpg?width=640&height=640&fit=bounds)
![제 23회 보아즈(BOAZ) 빅데이터 컨퍼런스 - [JJAI] : Re:Buy - 고객 행동 패턴 기반 재구매 시점 예측 개인화 CRM 시스템](https://cdn.slidesharecdn.com/ss_thumbnails/1-3boaz23rdconferencejjai-260203100705-ab1ce027-thumbnail.jpg?width=640&height=640&fit=bounds)
![제 23회 보아즈(BOAZ) 빅데이터 컨퍼런스 - [셋이어때] : 헬퍼잇](https://cdn.slidesharecdn.com/ss_thumbnails/2-3boaz23rdconference-260203102432-6c8c7ed6-thumbnail.jpg?width=640&height=640&fit=bounds)