김영웅
꿈꾸는 데이터 디자이너매니저
경영정보시스템 전공 박사과정
경영전문대학원 MBA
컴퓨터공학 전공
Ryan Kim | Convergence Business Designer
Facebook. https://www.facebook.com/keyassist
E-mail. youngwung.kim@gmail.com
Web. http://keyassist.tistory.com
데이터.읽어주는남자
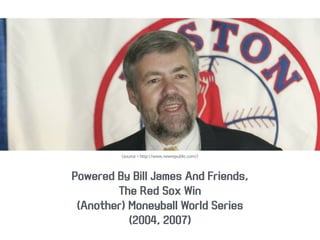
3.
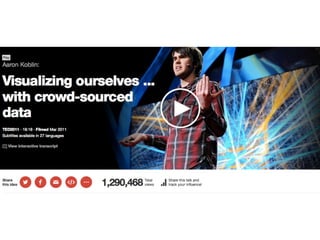
How data willtransform business
<source=www.ted.com>
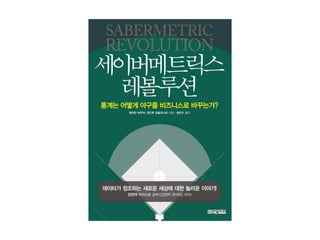
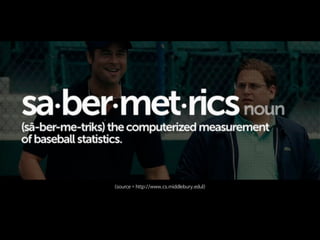
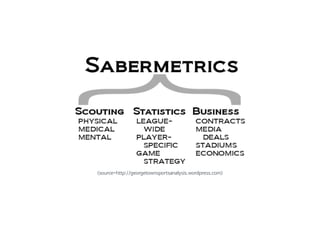
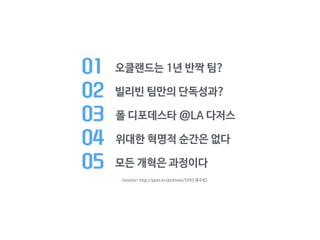
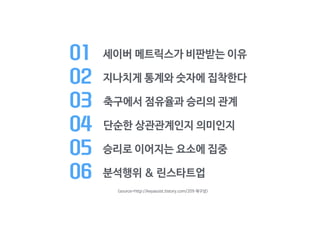
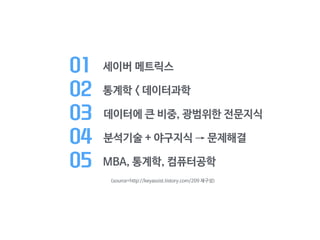
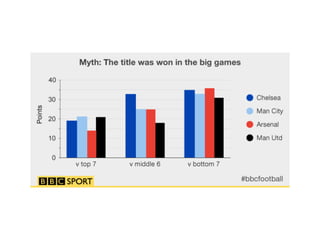
01 세이버 메트릭스가비판받는 이유
02 지나치게 통계와 숫자에 집착한다
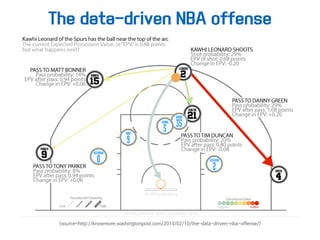
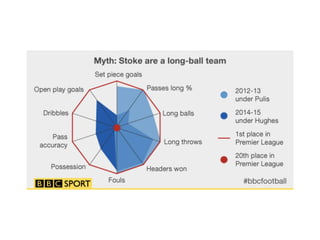
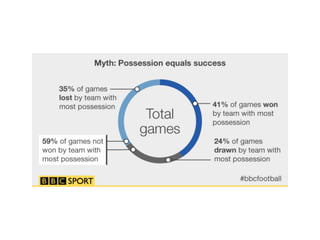
03 축구에서 점유율과 승리의 관계
04 단순한 상관관계인지 의미인지
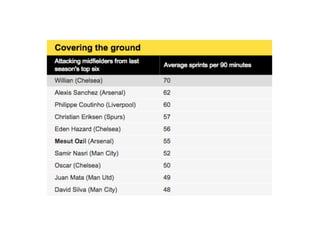
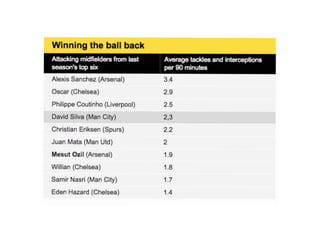
05 승리로 이어지는 요소에 집중
06 분석행위 & 린스타트업
<source=http://keyassist.tistory.com/209 재구성>
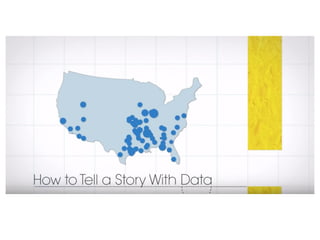
Data Visualization seeksto
use data visualization techniques
to help data practitioners
to tease patterns, trends
and relationships
buried in the data.
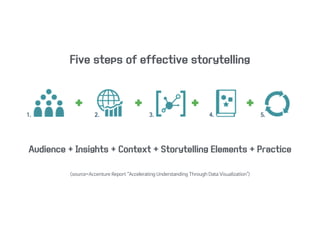
Five steps ofeffective storytelling
Audience + Insights + Context + Storytelling Elements + Practice
<source=Accenture Report “Accelerating Understanding Through Data Visualization">
55.
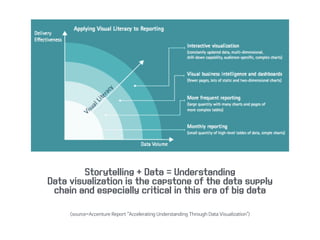
Storytelling + Data= Understanding
Data visualization is the capstone of the data supply
chain and especially critical in this era of big data
<source=Accenture Report “Accelerating Understanding Through Data Visualization">
56.
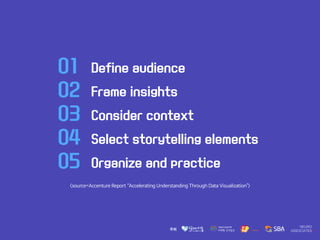
01 Define audience
02Frame insights
03 Consider context
04 Select storytelling elements
05 Organize and practice
<source=Accenture Report “Accelerating Understanding Through Data Visualization">
김영웅
꿈꾸는 데이터 디자이너매니저
경영정보시스템 전공 박사과정
경영전문대학원 MBA
컴퓨터공학 전공
Ryan Kim | Convergence Business Designer
Facebook. https://www.facebook.com/keyassist
E-mail. youngwung.kim@gmail.com
Web. http://keyassist.tistory.com
데이터.읽어주는남자


![[Week2]데이터읽어주는남자](https://cdn.slidesharecdn.com/ss_thumbnails/week2-150826002440-lva1-app6891-thumbnail.jpg?width=640&height=640&fit=bounds)

![[week6] 데이터읽어주는남자](https://cdn.slidesharecdn.com/ss_thumbnails/6-2-151001021527-lva1-app6891-thumbnail.jpg?width=640&height=640&fit=bounds)


![[week7] 데이터읽어주는남자](https://cdn.slidesharecdn.com/ss_thumbnails/7-151001021639-lva1-app6892-thumbnail.jpg?width=640&height=640&fit=bounds)


![[week11] R_ggmap, leaflet](https://cdn.slidesharecdn.com/ss_thumbnails/datadesigner-r-07-150923032312-lva1-app6891-thumbnail.jpg?width=640&height=640&fit=bounds)

![[시즌2, week3] R Basic](https://cdn.slidesharecdn.com/ss_thumbnails/datadesigner-r-02-150825143753-lva1-app6891-thumbnail.jpg?width=640&height=640&fit=bounds)
![[Week20] D3.js_Mapping](https://cdn.slidesharecdn.com/ss_thumbnails/week19mapping-151028033253-lva1-app6892-thumbnail.jpg?width=640&height=640&fit=bounds)
![[Week2] 데이터 스크래핑](https://cdn.slidesharecdn.com/ss_thumbnails/week2datascraping-150121182810-conversion-gate02-thumbnail.jpg?width=640&height=640&fit=bounds)

![[기타] 야구 기록 규칙](https://cdn.slidesharecdn.com/ss_thumbnails/170126-170206011505-thumbnail.jpg?width=640&height=640&fit=bounds)
![[기타] 야구 기록 입력법](https://cdn.slidesharecdn.com/ss_thumbnails/170206-170206011518-thumbnail.jpg?width=640&height=640&fit=bounds)
![[week9]R_statics](https://cdn.slidesharecdn.com/ss_thumbnails/r150916-150916024827-lva1-app6892-thumbnail.jpg?width=640&height=640&fit=bounds)
![[week6]R_Wrangling](https://cdn.slidesharecdn.com/ss_thumbnails/datadesigner-r-04-150906032721-lva1-app6892-thumbnail.jpg?width=640&height=640&fit=bounds)
![[week7]R_Wrangling(2)](https://cdn.slidesharecdn.com/ss_thumbnails/datadesigner-r-05-150908144745-lva1-app6891-thumbnail.jpg?width=640&height=640&fit=bounds)
![[스포츠 심리] 심화학습 - 루틴](https://cdn.slidesharecdn.com/ss_thumbnails/20170208-routineyuv1-170208095809-thumbnail.jpg?width=640&height=640&fit=bounds)
![[스포츠마케팅] 여성 팬 대상 마케팅 전략 (두산&넥센)](https://cdn.slidesharecdn.com/ss_thumbnails/smbaseballteamsfemale-targetms-140427043052-phpapp01-thumbnail.jpg?width=640&height=640&fit=bounds)
![[Week8]R_ggplot2](https://cdn.slidesharecdn.com/ss_thumbnails/week8rggplot2-150913001335-lva1-app6891-thumbnail.jpg?width=640&height=640&fit=bounds)

![[스포츠마케팅] 국내 프로야구의 여성팬을 대상으로 한 스포츠마케팅 사례 분석 및 향후 전략 제시](https://cdn.slidesharecdn.com/ss_thumbnails/3pt-140516080506-phpapp02-thumbnail.jpg?width=640&height=640&fit=bounds)
![[Week6] Getting started with R](https://cdn.slidesharecdn.com/ss_thumbnails/week6rprogramming2-150203214058-conversion-gate01-thumbnail.jpg?width=640&height=640&fit=bounds)

![안경할머니곱창 사업소개서[옛체]](https://cdn.slidesharecdn.com/ss_thumbnails/1310109183-phpapp02-110708022015-phpapp02-thumbnail.jpg?width=640&height=640&fit=bounds)


![[SSA] 01.bigdata database technology (2014.02.05)](https://cdn.slidesharecdn.com/ss_thumbnails/01-140225072202-phpapp02-thumbnail.jpg?width=640&height=640&fit=bounds)


![[2016 데이터 그랜드 컨퍼런스] 1 3. bk3(엔코아)데이터그랜드컨퍼런스 4차산업혁명의 핵심-데이터경제-엔코아](https://cdn.slidesharecdn.com/ss_thumbnails/1-3-161125004936-thumbnail.jpg?width=640&height=640&fit=bounds)


![[week17] D3.js_Tooltip](https://cdn.slidesharecdn.com/ss_thumbnails/2d3js7-151021033054-lva1-app6892-thumbnail.jpg?width=640&height=640&fit=bounds)
![[week16] D3.js_Transition](https://cdn.slidesharecdn.com/ss_thumbnails/2d3js6-151018032608-lva1-app6891-thumbnail.jpg?width=640&height=640&fit=bounds)
![[week8] 데이터읽어주는남자](https://cdn.slidesharecdn.com/ss_thumbnails/8final-151016015556-lva1-app6891-thumbnail.jpg?width=640&height=640&fit=bounds)
![[Week15] D3.js_Scatter_Chart](https://cdn.slidesharecdn.com/ss_thumbnails/2d3js5-151014035535-lva1-app6892-thumbnail.jpg?width=640&height=640&fit=bounds)
![[Week14] D3.js_Scale and Axis (보충자료)](https://cdn.slidesharecdn.com/ss_thumbnails/2d3js42-151011111651-lva1-app6891-thumbnail.jpg?width=640&height=640&fit=bounds)
![[Week14] D3.js_Scale and Axis](https://cdn.slidesharecdn.com/ss_thumbnails/week4d3-151011033640-lva1-app6892-thumbnail.jpg?width=640&height=640&fit=bounds)
![[Week13] D3.js_Bar Chart](https://cdn.slidesharecdn.com/ss_thumbnails/week3d3-151007011322-lva1-app6892-thumbnail.jpg?width=640&height=640&fit=bounds)
![[Week12] D3.js_Basic2](https://cdn.slidesharecdn.com/ss_thumbnails/week2d3-151004003519-lva1-app6891-thumbnail.jpg?width=640&height=640&fit=bounds)
![[week12] D3.js_Basic](https://cdn.slidesharecdn.com/ss_thumbnails/2d3js1-150930011102-lva1-app6892-thumbnail.jpg?width=640&height=640&fit=bounds)
![[Week5]R_scraping](https://cdn.slidesharecdn.com/ss_thumbnails/week5rscraping-150902002731-lva1-app6891-thumbnail.jpg?width=640&height=640&fit=bounds)
![[Week4]데이터읽어주는남자](https://cdn.slidesharecdn.com/ss_thumbnails/week4-150831083756-lva1-app6892-thumbnail.jpg?width=640&height=640&fit=bounds)
![[Week4] Google refine](https://cdn.slidesharecdn.com/ss_thumbnails/week4googlerefinelecture-150830004221-lva1-app6892-thumbnail.jpg?width=640&height=640&fit=bounds)
![[Week3]데이터읽어주는남자](https://cdn.slidesharecdn.com/ss_thumbnails/week3-150826083652-lva1-app6891-thumbnail.jpg?width=640&height=640&fit=bounds)

![[week16] D3.js (Scale & axis)](https://cdn.slidesharecdn.com/ss_thumbnails/d3-150410223256-conversion-gate01-thumbnail.jpg?width=640&height=640&fit=bounds)
![[week14] Getting started with D3.js](https://cdn.slidesharecdn.com/ss_thumbnails/d3-150331194754-conversion-gate01-thumbnail.jpg?width=640&height=640&fit=bounds)
![[Week10] R graphics](https://cdn.slidesharecdn.com/ss_thumbnails/week10rgraphics-150224230109-conversion-gate02-thumbnail.jpg?width=640&height=640&fit=bounds)