Webinar: How to troubleshoot bandwidth hogs and take action.
•Download as PPTX, PDF•
0 likes•69 views

NetFlow Analyzer presents "How to troubleshoot bandwidth hogs and take action" in its recent webinar.
Report
Share
Report
Share

Recommended
IoTMeetupGuildford#14: Mark Hill - http://thethingsnetwork.org - OpenTRV
The document outlines The Things Network, an open source initiative to build a global data network for Internet of Things devices. It describes the key components of the decentralized architecture, including gateways that connect to devices, routers that route data, brokers that decouple components, handlers that process data, and a network server for device management. The goals are to support a large number of low-power devices in a standardized, efficient and trust-based manner while complying with LoRaWAN specifications. Next steps outlined are to gather feedback on the proposed architecture and expand development teams.
Spider & F5 Round Table - Application Centric Security
Hackers attack for various reasons like politics, money, fame or boredom. They target applications by disrupting availability, performance, and reputation. F5 provides comprehensive application-centric security across layers 3 to 7 to protect applications. It consolidates firewall, traffic management, and security functions into one platform and provides protections like DDoS mitigation, web application firewall, and IP intelligence to secure applications. F5's high-performance appliances are purpose-built to deliver carrier-grade reliability and scalability.
Novatrack Product Line
The document describes the Novatrack tracking system which includes a communication server to receive device data from various sources, a database server to store spatial data, and a web services layer and application server to provide access to the data through web applications and interfaces. The modular design allows the system to scale for different needs and integrate various hardware devices and data types.
Achieve Full API Lifecycle Management Using NGINX Controller
This document discusses NGINX Controller's API Management module. It provides full lifecycle management of APIs, including API definition and publication, security features like rate limiting and authentication/authorization, ongoing monitoring and maintenance, and analytics. Key capabilities covered include creating API definitions and publishing them to NGINX Plus instances, implementing rate limiting policies, managing API keys for authentication, and monitoring API gateway performance using customizable dashboards and alerts. The vision is for NGINX Controller to be an orchestration and analytics platform for all NGINX Plus products.
Microwaves vs Humans: How to secure your cloud
While automation has improved infrastructure configuration and deployment through tools like configuration management, infrastructure as code, and CI/CD pipelines, there are still areas that could be improved. These include one-off tasks, disposable infrastructure, networking, and security monitoring. For security monitoring specifically, automating the collection of logs and metrics around things like SSH logins, services, and changes to infrastructure can help with correlation when issues occur. Combining information from various automation systems into a unified view would help determine the root cause of problems.
Bandwidth reporting, capacity planning, and traffic shaping: NetFlow Analyzer...
Bandwidth reporting, capacity planning, and traffic shaping: NetFlow Analyzer...ManageEngine, Zoho Corporation
The document provides an overview of NetFlow Analyzer's capabilities for diagnosing and troubleshooting network traffic issues. It discusses how to customize data storage and dashboards to monitor traffic in real-time. Reporting and automation features allow generating historical reports to identify bandwidth capacity issues. Forensic analysis with raw data helps pinpoint the root cause of traffic spikes by filtering traffic by application, user, or other criteria. An example troubleshooting scenario demonstrates how NetFlow Analyzer could be used to identify and resolve a network congestion issue caused by a patch upgrade affecting many servers during business hours. The document also covers capacity planning, billing, and bandwidth optimization techniques.PLNOG 13: B. van der Sloot, S. Abdel-Hafez: Running a 2 Tbps global IP networ...
Bart van der Sloot joined FiberRing as Managing Director in April 2014, with the objectives to further grow and enhance the footprint, quality and business of FiberRing’s 2 Tbps global IP network, covering over 50 locations on 3 continents. From 1999 to 2013 Bart worked at Global Crossing (acquired by Level 3 in 2011), where he developed staffing, systems and business processes for Global Crossing’s European brand new sales team, built and coached a Wholesale Sales team to sign new telecom customers and grow revenues in various countries across Europe, led Global Crossing’s expansion into Central and Eastern Europe and established Level 3’s position in the Benelux broadcast market.
Samer Abdel-Hafez joined the FiberRing network team in December 2013 as Network Design Engineer. Samer’s responsibilities within the team include planning capacity for the large traffic volume of FiberRing, arranging interconnections in new locations and markets, designing advanced ad-hoc solutions for the FiberRing network and customers and advise the Network support team on day to day issues.
Abstract: FiberRing operates one of the largest content networks in the world, peaking at over 2 Tb/s. In order to facilitate troubleshooting, detect attacks and saving important data as router configurations, we implement a series of tools mostly implemented in house or open source.
The key point of this presentation is to describe how FiberRing is using these tools for:
monitoring: FiberRing makes extensive use of Opsview (Nagios) and NMIS. We utilise Opsview for alerts and reporting and NMIS for detailed traffic analysis.
capacity planning: FiberRing choose PMACCT as netflow collector software and implemented an in house front-end solution that helps us locate strategic peering partners and explore ways to reduce the costs to deliver our content.
DDOS attacks detection: As every large hosting provider, we are regularly target of DDoS attacks. We implement a set of linux boxes running running nfcapd to collect traffic flows with 1 minute/per host granularity. This gives us great flexibility and incredibly valuable data to quick detect attacks and take corrective actions.
routers’ configuration backups: FiberRing is actively involved in the development of Oxidized, an innovative configuration backup tool which poses itself as rancid replacement.
Enterprise Network Monitoring Software by ServicePilot
Get a network monitoring software that equips you with the tools you need to monitor and analyze performance degradations.
Distributed Network Monitoring - Interopnet class by NetBeez
This course provides an overview of distributed network monitoring in modern network environments and describes its benefits and use cases. Referencing the network topology of InteropNet, we will discuss the goals of the installation, review the deployment locations of the NetBeez agents, and explain the configured monitoring tests. During the last part of the session, we will generate reports and analyze in detail the statistics of the performance data captured and processed by the system.
NetBeez - IEEE IRI 2016
Abstract: Enterprise networks are becoming increasingly complex, with applications living on hybrid clouds and network connectivity being provided by multiple mediums (wired, wireless, VPN, etc.) This complexity has made end-user experience visibility more important than ever. One very effective solution to the problem of end-user visibility is distributed network monitoring. In distributed network monitoring, multiple sensors are deployed within the network infrastructure to measure network and application performance and detect connectivity and performance degradation issues that could impact network users and critical applications. The performance data generated by the sensors is collected in a central repository for further processing and analysis. External systems like data analytics and software-defined network controllers stand to benefit from this data. Consequently, having application program interfaces (APIs) and integration with third party tools is very important. In this session, we will introduce a commercial distributed network monitoring solution called NetBeez, and show how NetBeez integrates with other tools like Splunk and Slack to enable network operators to be more proactive and effective in solving user-affecting network issues.
501 ch 3 network technologies and tools
This document discusses network technologies and tools, including networking concepts like TCP/IP and common protocols, network devices like switches and routers, and methods for implementing a secure network. It covers topics like sniffing and DoS attacks, network segmentation using VLANs, firewall configuration with rules and zones, and the use of switches, routers, and other devices to prevent spoofing and floods and securely separate network traffic.
Vp ns
This document discusses virtual private networks (VPNs) and provides information on various VPN types and implementations. It begins by explaining that VPNs are used to connect private networks via the internet in a secure manner. It then covers IP-based VPNs and their components like encryption and encapsulation. The document also summarizes VPN characteristics, types including server, firewall and router-based, architectures, best practices, and different implementation methods such as IPSec and SSL-based VPNs.
Corsa Giga Filter
Corsa Technology's introduced GigaFilter, a new feature on the Red Armor NSE7000 hardware platform that allows instant filtering of up to 4 Billion IPv4 addresses on 10 Gbps and 100 Gbps links to mitigate volumetric DDoS attacks.
Rethinking Security: Corsa Red Armor Network Security Enforcement
Service providers, including Content Distribution Networks (CDN) and Internet Service Providers (ISP) are rapidly building 100G connections to meet customer and business needs. Meanwhile IoT has become real, enabling high-bandwidth DDoS attacks to explode. Protecting the network has become even more critical but finding the right mitigation solution is difficult.
Corsa’s new Red Armor NSE7000 Network Security Enforcement engine delivers scalable 100G DDoS protection at a considerable cost savings. This high-performance enforcement engine installs into existing DDoS architectures in 10 minutes and interoperates with existing DDOS detection technology providing the necessary 100G line rate enforcement as a bump in the wire.
Practical Examples of LoRaWAN in Action
Examples of nodes and applications being used to explore the potential of LoRaWAN. Presented to the "Kickstarting Hull's Smart City" event
Achieve Full API Lifecycle Management Using NGINX Controller – EMEA
Attend this webinar and learn how to manage the entire lifecycle of your APIs using NGINX Controller. This includes defining, publishing, securing, routing, monitoring, troubleshooting, and analyzing usage of your APIs to assess their value. Get an overview and demo of NGINX Controller’s API Management Module.
Join this webinar to learn:
- How to manage API definitions and their component resources, define upstream groups and their backend servers, and route resources to upstreams
- How to boost developer productivity by enabling teams to deploy new APIs faster with environment‑specific, policy‑driven management
- How to mitigate DDoS attacks and protect your applications from being flooded with malicious or errant API calls by setting rate limits
- How you can meet and exceed SLAs by finding the root cause of performance issues and troubleshooting them quickly
https://www.nginx.com/resources/webinars/full-lifecycle-api-management-nginx-controller-emea
Slick: A control plane for middleboxes
Theophilus Benson
Research Track Part 2
ONS2015: http://bit.ly/ons2015sd
ONS Inspire! Webinars: http://bit.ly/oiw-sd
Watch the talk (video) on ONS Content Archives: http://bit.ly/ons-archives-sd
Corsa Technology DP2000: Open Programmable Networking & Virtualizing Network ...
In a major move to deliver the promised benefits of Software-Defined Networking (SDN), Corsa Technology introduced the Corsa DP2000 series, a new open programmable switching and routing platform that delivers 10G and 100G subscriber-level networking, on-demand services and real-time network tuning. The Corsa DP2000 allows network architects and operators to dynamically partition hardware into independent virtual SDN switches or routers operating at line-rate.
Unit08
Network security protocols like IPSec, VPNs, Kerberos, and SSL are used to protect data as it travels across networks. IPSec ensures privacy and authentication at the network layer using encryption. VPNs allow private network connections over public networks using protocols like L2TP. Kerberos uses tickets to authenticate users and services between domains. SSL establishes encrypted links between clients and servers using public key cryptography and digital certificates from certificate authorities. Firewalls and proxy servers filter network traffic to control access and enhance security.
[old] Network Performance Monitoring for DevOps and IT
Take a look at our updated Network Monitoring presentation in the link given below:
https://www.slideshare.net/Site24x7/network-final
Get comprehensive performance insights by monitoring critical network devices such as routers, switches and firewalls with Site24x7.
About Site24x7:
Site24x7 offers unified cloud monitoring for DevOps and IT operations. Monitor the experience of real users accessing websites and applications from desktop and mobile devices. In-depth monitoring capabilities enable DevOps teams to monitor and troubleshoot applications, servers and network infrastructure including private and public clouds. End user experience monitoring is done from 50+ locations across the world and various wireless carriers. For more information on Site24x7, please visit http://www.site24x7.com/.
Forums: https://forums.site24x7.com/
Facebook: http://www.facebook.com/Site24x7
Twitter: http://twitter.com/site24x7
Google+: https://plus.google.com/+Site24x7
LinkedIn: https://www.linkedin.com/company/site...
View Blogs: http://blogs.site24x7.com/
IoT whitepaper limited slide for test
This document outlines key concepts in internet of things (IoT) systems. It discusses different types of connected devices, from simple devices with small data models to more complex devices. It also describes common components of IoT systems including sensors, gateways, IoT servers, admin portals, collectors, and apps. Finally, it provides a high-level overview of how these different elements interact and connect devices to the cloud and third-party systems in an IoT world.
Corsa DP2000 Platform
The Corsa DP2000 series is an open programmable switching and routing platform that delivers 10G and 100G subscriber-level networking, on-demand services and real-time network tuning. The Corsa DP2000 allows network architects and operators to dynamically partition hardware into independent virtual SDN switches or routers operating at line-rate.
501 ch 3 network technologies tools
The document discusses network technologies and tools for implementing a secure network. It reviews basic networking concepts like protocols, network devices, and network address allocation. It also provides examples of how to configure firewall rules and use devices like switches, routers, and proxies to securely segment networks and filter traffic. The goal is to understand these fundamentals and apply methods like ACLs, VLANs, and protocol filtering to harden network security.
Effective Service Mesh to turbocharge Cloud Resiliency
This document discusses how service meshes can turbocharge cloud resiliency. It describes some key challenges with inter-service communication like failures, latency, routing, and observability. It then explains how a service mesh provides a dedicated infrastructure layer to address these issues through capabilities like traffic management, circuit breaking, telemetry, and fault injection. Specifically, it outlines how the service mesh provides resiliency through active health checks, timeouts, retries, and circuit breaking in the data plane. It also discusses capabilities for observability, tracing, and injecting faults to test resiliency.
Fintech week london 2014
TimePack is a new technology that embeds time and location data into network packets to provide real-time network visibility and universal latency monitoring. It allows infrastructure to become intelligent and latency-aware. TimePack monitors packet journeys from source to destination and provides visibility even for cloud services. The solution includes network probes, plugins for Linux, and inline monitoring. It can simulate traffic and provides a dashboard for real-time monitoring with minimal overhead. Future plans include integrating the technology into network devices and developing an analyzer appliance to extract TimePack data for detailed traffic analysis.
What You Should Know Before The Next DDoS Attack
Last month, the world’s largest-ever distributed denial of service (DDOS) attack — 1.35 Tbps — hit GitHub and raised the stakes for every commercial website. These increasingly larger and more distributed attacks challenge security practitioners to better anticipate potential attacks on their own applications and infrastructure. In this live webinar, Cloudflare security experts will discuss the new DDoS landscape and mitigation techniques.
DDosMon A Global DDoS Monitoring Project
DDosMon A Global DDoS Monitoring Project by Yiming Gong.
A presentation given at APNIC 42's FIRST TC Security Session (2) session on Wednesday, 5 October 2016.
TLS 1.3 and Other New Features in NGINX Plus R17 and NGINX Open Source
The latest version of the TLS protocol, TLS 1.3, was just released in August 2018. TLS 1.3 is faster and more secure than TLS 1.2. In this webinar, we cover what’s new in TLS 1.3 and how to use it with NGINX, plus other new features in NGINX Open Source and NGINX Plus.
Join this webinar to learn:
- What’s new in TLS 1.3 and why it's faster and more secure than TLS 1.2
- How to use TLS 1.3 with NGINX Plus and NGINX Open Source
- About two-stage rate limiting, simplified OpenID Connect, and 2x faster NGINX and ModSecurity WAF performance
- More with a live demo of TLS 1.3 in action
Watch On-demand: https://www.nginx.com/resources/webinars/tls-1-3-new-features-nginx-plus-r17-nginx-open-source/
Free Netflow analyzer training - diagnosing_and_troubleshooting
This document summarizes a training on customizing NetFlow Analyzer for diagnosing and troubleshooting traffic issues faster. It discusses how to customize data storage and dashboards, use reporting and automation, and conduct troubleshooting with forensics. Major topics covered include controlling data retention, identifying potential issues early with alerts, finding the root cause of issues using reports and forensics, resolving issues, optimizing traffic, and verifying billing. The trainer provides guidance on these capabilities in NetFlow Analyzer to help users diagnose network problems more quickly and efficiently.
NetFlow Analyzer Training Part II : Diagnosing and troubleshooting traffic is...
NetFlow Analyzer Training Part II : Diagnosing and troubleshooting traffic is...ManageEngine, Zoho Corporation
In this presentation, you'll learn how to troubleshoot bandwidth issues with NetFlow Analyzer.
Topics covered:
1. Customizing data storage
2. Customizing dashboards
3. Reporting and automation
4. Troubleshooting with forensics
5. Traffic shaping
6. Capacity planning and billing
To know more, visit www.netflowanalyzer.comMore Related Content
What's hot
Distributed Network Monitoring - Interopnet class by NetBeez
This course provides an overview of distributed network monitoring in modern network environments and describes its benefits and use cases. Referencing the network topology of InteropNet, we will discuss the goals of the installation, review the deployment locations of the NetBeez agents, and explain the configured monitoring tests. During the last part of the session, we will generate reports and analyze in detail the statistics of the performance data captured and processed by the system.
NetBeez - IEEE IRI 2016
Abstract: Enterprise networks are becoming increasingly complex, with applications living on hybrid clouds and network connectivity being provided by multiple mediums (wired, wireless, VPN, etc.) This complexity has made end-user experience visibility more important than ever. One very effective solution to the problem of end-user visibility is distributed network monitoring. In distributed network monitoring, multiple sensors are deployed within the network infrastructure to measure network and application performance and detect connectivity and performance degradation issues that could impact network users and critical applications. The performance data generated by the sensors is collected in a central repository for further processing and analysis. External systems like data analytics and software-defined network controllers stand to benefit from this data. Consequently, having application program interfaces (APIs) and integration with third party tools is very important. In this session, we will introduce a commercial distributed network monitoring solution called NetBeez, and show how NetBeez integrates with other tools like Splunk and Slack to enable network operators to be more proactive and effective in solving user-affecting network issues.
501 ch 3 network technologies and tools
This document discusses network technologies and tools, including networking concepts like TCP/IP and common protocols, network devices like switches and routers, and methods for implementing a secure network. It covers topics like sniffing and DoS attacks, network segmentation using VLANs, firewall configuration with rules and zones, and the use of switches, routers, and other devices to prevent spoofing and floods and securely separate network traffic.
Vp ns
This document discusses virtual private networks (VPNs) and provides information on various VPN types and implementations. It begins by explaining that VPNs are used to connect private networks via the internet in a secure manner. It then covers IP-based VPNs and their components like encryption and encapsulation. The document also summarizes VPN characteristics, types including server, firewall and router-based, architectures, best practices, and different implementation methods such as IPSec and SSL-based VPNs.
Corsa Giga Filter
Corsa Technology's introduced GigaFilter, a new feature on the Red Armor NSE7000 hardware platform that allows instant filtering of up to 4 Billion IPv4 addresses on 10 Gbps and 100 Gbps links to mitigate volumetric DDoS attacks.
Rethinking Security: Corsa Red Armor Network Security Enforcement
Service providers, including Content Distribution Networks (CDN) and Internet Service Providers (ISP) are rapidly building 100G connections to meet customer and business needs. Meanwhile IoT has become real, enabling high-bandwidth DDoS attacks to explode. Protecting the network has become even more critical but finding the right mitigation solution is difficult.
Corsa’s new Red Armor NSE7000 Network Security Enforcement engine delivers scalable 100G DDoS protection at a considerable cost savings. This high-performance enforcement engine installs into existing DDoS architectures in 10 minutes and interoperates with existing DDOS detection technology providing the necessary 100G line rate enforcement as a bump in the wire.
Practical Examples of LoRaWAN in Action
Examples of nodes and applications being used to explore the potential of LoRaWAN. Presented to the "Kickstarting Hull's Smart City" event
Achieve Full API Lifecycle Management Using NGINX Controller – EMEA
Attend this webinar and learn how to manage the entire lifecycle of your APIs using NGINX Controller. This includes defining, publishing, securing, routing, monitoring, troubleshooting, and analyzing usage of your APIs to assess their value. Get an overview and demo of NGINX Controller’s API Management Module.
Join this webinar to learn:
- How to manage API definitions and their component resources, define upstream groups and their backend servers, and route resources to upstreams
- How to boost developer productivity by enabling teams to deploy new APIs faster with environment‑specific, policy‑driven management
- How to mitigate DDoS attacks and protect your applications from being flooded with malicious or errant API calls by setting rate limits
- How you can meet and exceed SLAs by finding the root cause of performance issues and troubleshooting them quickly
https://www.nginx.com/resources/webinars/full-lifecycle-api-management-nginx-controller-emea
Slick: A control plane for middleboxes
Theophilus Benson
Research Track Part 2
ONS2015: http://bit.ly/ons2015sd
ONS Inspire! Webinars: http://bit.ly/oiw-sd
Watch the talk (video) on ONS Content Archives: http://bit.ly/ons-archives-sd
Corsa Technology DP2000: Open Programmable Networking & Virtualizing Network ...
In a major move to deliver the promised benefits of Software-Defined Networking (SDN), Corsa Technology introduced the Corsa DP2000 series, a new open programmable switching and routing platform that delivers 10G and 100G subscriber-level networking, on-demand services and real-time network tuning. The Corsa DP2000 allows network architects and operators to dynamically partition hardware into independent virtual SDN switches or routers operating at line-rate.
Unit08
Network security protocols like IPSec, VPNs, Kerberos, and SSL are used to protect data as it travels across networks. IPSec ensures privacy and authentication at the network layer using encryption. VPNs allow private network connections over public networks using protocols like L2TP. Kerberos uses tickets to authenticate users and services between domains. SSL establishes encrypted links between clients and servers using public key cryptography and digital certificates from certificate authorities. Firewalls and proxy servers filter network traffic to control access and enhance security.
[old] Network Performance Monitoring for DevOps and IT
Take a look at our updated Network Monitoring presentation in the link given below:
https://www.slideshare.net/Site24x7/network-final
Get comprehensive performance insights by monitoring critical network devices such as routers, switches and firewalls with Site24x7.
About Site24x7:
Site24x7 offers unified cloud monitoring for DevOps and IT operations. Monitor the experience of real users accessing websites and applications from desktop and mobile devices. In-depth monitoring capabilities enable DevOps teams to monitor and troubleshoot applications, servers and network infrastructure including private and public clouds. End user experience monitoring is done from 50+ locations across the world and various wireless carriers. For more information on Site24x7, please visit http://www.site24x7.com/.
Forums: https://forums.site24x7.com/
Facebook: http://www.facebook.com/Site24x7
Twitter: http://twitter.com/site24x7
Google+: https://plus.google.com/+Site24x7
LinkedIn: https://www.linkedin.com/company/site...
View Blogs: http://blogs.site24x7.com/
IoT whitepaper limited slide for test
This document outlines key concepts in internet of things (IoT) systems. It discusses different types of connected devices, from simple devices with small data models to more complex devices. It also describes common components of IoT systems including sensors, gateways, IoT servers, admin portals, collectors, and apps. Finally, it provides a high-level overview of how these different elements interact and connect devices to the cloud and third-party systems in an IoT world.
Corsa DP2000 Platform
The Corsa DP2000 series is an open programmable switching and routing platform that delivers 10G and 100G subscriber-level networking, on-demand services and real-time network tuning. The Corsa DP2000 allows network architects and operators to dynamically partition hardware into independent virtual SDN switches or routers operating at line-rate.
501 ch 3 network technologies tools
The document discusses network technologies and tools for implementing a secure network. It reviews basic networking concepts like protocols, network devices, and network address allocation. It also provides examples of how to configure firewall rules and use devices like switches, routers, and proxies to securely segment networks and filter traffic. The goal is to understand these fundamentals and apply methods like ACLs, VLANs, and protocol filtering to harden network security.
Effective Service Mesh to turbocharge Cloud Resiliency
This document discusses how service meshes can turbocharge cloud resiliency. It describes some key challenges with inter-service communication like failures, latency, routing, and observability. It then explains how a service mesh provides a dedicated infrastructure layer to address these issues through capabilities like traffic management, circuit breaking, telemetry, and fault injection. Specifically, it outlines how the service mesh provides resiliency through active health checks, timeouts, retries, and circuit breaking in the data plane. It also discusses capabilities for observability, tracing, and injecting faults to test resiliency.
Fintech week london 2014
TimePack is a new technology that embeds time and location data into network packets to provide real-time network visibility and universal latency monitoring. It allows infrastructure to become intelligent and latency-aware. TimePack monitors packet journeys from source to destination and provides visibility even for cloud services. The solution includes network probes, plugins for Linux, and inline monitoring. It can simulate traffic and provides a dashboard for real-time monitoring with minimal overhead. Future plans include integrating the technology into network devices and developing an analyzer appliance to extract TimePack data for detailed traffic analysis.
What You Should Know Before The Next DDoS Attack
Last month, the world’s largest-ever distributed denial of service (DDOS) attack — 1.35 Tbps — hit GitHub and raised the stakes for every commercial website. These increasingly larger and more distributed attacks challenge security practitioners to better anticipate potential attacks on their own applications and infrastructure. In this live webinar, Cloudflare security experts will discuss the new DDoS landscape and mitigation techniques.
DDosMon A Global DDoS Monitoring Project
DDosMon A Global DDoS Monitoring Project by Yiming Gong.
A presentation given at APNIC 42's FIRST TC Security Session (2) session on Wednesday, 5 October 2016.
TLS 1.3 and Other New Features in NGINX Plus R17 and NGINX Open Source
The latest version of the TLS protocol, TLS 1.3, was just released in August 2018. TLS 1.3 is faster and more secure than TLS 1.2. In this webinar, we cover what’s new in TLS 1.3 and how to use it with NGINX, plus other new features in NGINX Open Source and NGINX Plus.
Join this webinar to learn:
- What’s new in TLS 1.3 and why it's faster and more secure than TLS 1.2
- How to use TLS 1.3 with NGINX Plus and NGINX Open Source
- About two-stage rate limiting, simplified OpenID Connect, and 2x faster NGINX and ModSecurity WAF performance
- More with a live demo of TLS 1.3 in action
Watch On-demand: https://www.nginx.com/resources/webinars/tls-1-3-new-features-nginx-plus-r17-nginx-open-source/
What's hot (20)
Distributed Network Monitoring - Interopnet class by NetBeez
Distributed Network Monitoring - Interopnet class by NetBeez
Rethinking Security: Corsa Red Armor Network Security Enforcement
Rethinking Security: Corsa Red Armor Network Security Enforcement
Achieve Full API Lifecycle Management Using NGINX Controller – EMEA
Achieve Full API Lifecycle Management Using NGINX Controller – EMEA
Corsa Technology DP2000: Open Programmable Networking & Virtualizing Network ...
Corsa Technology DP2000: Open Programmable Networking & Virtualizing Network ...
[old] Network Performance Monitoring for DevOps and IT
[old] Network Performance Monitoring for DevOps and IT
Effective Service Mesh to turbocharge Cloud Resiliency
Effective Service Mesh to turbocharge Cloud Resiliency
TLS 1.3 and Other New Features in NGINX Plus R17 and NGINX Open Source
TLS 1.3 and Other New Features in NGINX Plus R17 and NGINX Open Source
Similar to Webinar: How to troubleshoot bandwidth hogs and take action.
Free Netflow analyzer training - diagnosing_and_troubleshooting
This document summarizes a training on customizing NetFlow Analyzer for diagnosing and troubleshooting traffic issues faster. It discusses how to customize data storage and dashboards, use reporting and automation, and conduct troubleshooting with forensics. Major topics covered include controlling data retention, identifying potential issues early with alerts, finding the root cause of issues using reports and forensics, resolving issues, optimizing traffic, and verifying billing. The trainer provides guidance on these capabilities in NetFlow Analyzer to help users diagnose network problems more quickly and efficiently.
NetFlow Analyzer Training Part II : Diagnosing and troubleshooting traffic is...
NetFlow Analyzer Training Part II : Diagnosing and troubleshooting traffic is...ManageEngine, Zoho Corporation
In this presentation, you'll learn how to troubleshoot bandwidth issues with NetFlow Analyzer.
Topics covered:
1. Customizing data storage
2. Customizing dashboards
3. Reporting and automation
4. Troubleshooting with forensics
5. Traffic shaping
6. Capacity planning and billing
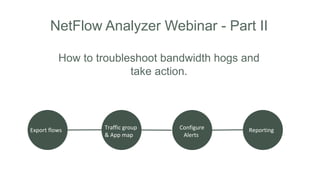
To know more, visit www.netflowanalyzer.comExport flows, group traffic, map application traffic and more: NetFlow Analyz...
Export flows, group traffic, map application traffic and more: NetFlow Analyz...ManageEngine, Zoho Corporation
The document provides an overview and agenda for a training on NetFlow Analyzer. It discusses initial setup steps including exporting flows from devices, viewing real-time traffic graphs, and configuring alerts. Common challenges are also addressed, such as mapping unknown applications or setting interface speed. Upcoming training will cover additional topics like alarms, customizing data storage, and traffic troubleshooting.NetFlow Analyzer Training Part I: Getting the initial settings right
In this presentation, you'll learn how to get started with bandwidth monitoring tool, NetFlow Analyzer.
Topics covered:
1. Configuring flow export from network devices
2. Traffic group
3. Application mapping
4. In-depth traffic visibility
5. Threshold-based alerting
How ManageEngine NetFlow Analyzer helped Boston Properties Save Bandwidth Costs
This presentation is about how ManageEngine NetFlow Analyzer played an effective role in managing network bandwidth at one of America's leading real estate companies Boston Properties.
NETFLOW ANALYZER 9600 - AN OVERVIEW
ManageEngine NetFlow Analyzer is a network monitoring and security solution that provides bandwidth monitoring, traffic analytics, and anomaly detection. It supports all major networking vendors and protocols. The solution offers centralized or distributed deployment options and customizable reports, alerts, and billing features. It leverages NetFlow/IPFIX data to generate insights into network and application usage, capacity planning, and security threats. Over 5,000 customers worldwide use NetFlow Analyzer for comprehensive network visibility and management.
The Need for Complex Analytics from Forwarding Pipelines
Nic Viljoen, Research Engineer, (including Tom Tofigh and Bryan Sullivan form AT&T) presentation from ONS 2016 at Santa Clara Convention Center in Santa Clara, CA.
Manageengine Netflow analyzer - An Insight
The document provides an overview of NetFlow Analyzer Version 9 software. It analyzes network traffic using multiple monitoring technologies including NetFlow, sFlow, IPFIX, and analyzes applications, bandwidth usage, conversations, and security. It supports Cisco technologies like NBAR, CBQoS, WAAS, and IPSLA. The software provides traffic analysis, network forensics, reporting, capacity planning, and usage-based billing capabilities.
Deep Packet Inspection technology evolution
Point of view to Deep Packet Inspection technology evolution
Current products and maket state, application and ecosystem
Cisco IT Infrastructure Monitoring with SolarWinds Tools
Keeping your network in line with modern requirements is not easy. Without the help of specialised tools to watch your Cisco network, there is no easy way to keep track of exactly what is going on.
SolarWinds offers comprehensive network management tools that can help you get answers to any question about the performance of your Cisco networks.
Download this FREE “SolarWinds IT Infrastructure Monitoring for Cisco” guide to learn how SolarWinds can address common challenges when managing Cisco IT networks:
More information: http://techxperts.eu/cisco-network-performance-monitoring-with-solarwinds-npm/
Deep Flow Monitoring with ServicePilot
Collect, store and decode packets from any source and make sure that key applications get bandwidth in priority over undesirable applications.
PNDA - Platform for Network Data Analytics
PNDA brings together a number of open source technologies to provide a simple, scalable open big data analytics Platform for Network Data Analytics.
Copyright © 2018 PNDA Project a Series of LF Projects, LLC
For web site terms of use, trademark policy and other project policies please see https://lfprojects.org
Cyberscout Presentation
This document provides an overview of an advanced cyber defense and monitoring system. Key points include:
1) The system has been in development since 2006 and can monitor various internet protocols at speeds up to 10Gbps.
2) It has been deployed by 7 law enforcement agencies globally, covering over 1 billion internet users.
3) The system supports comprehensive filtering and analysis capabilities to detect suspicious online activities in real-time.
4) It has a highly secure, redundant, and flexible architecture that can be deployed at various scales from individual cities to nationwide networks.
ONS Summit 2017 SKT TINA
The document discusses TiNA, an integrated network analyzer developed by SK Telecom to provide unified network monitoring and operation for software-defined data centers. TiNA includes systems for network packet brokering, probing, analysis, visualization, and service-centric monitoring. It provides both packet-level and flow-level network analytics using open source software and the T-CAP, an open converged network appliance developed by SKT that integrates switching and server functions. The document outlines TiNA's capabilities and provides examples of its use for traffic engineering, cloud data center multi-tenancy monitoring, and LTE network monitoring.
Data center webinar_v2_1
The document discusses securing data centers from cyber threats. It describes how attacks have evolved from manual to mechanized to sophisticated human-led attacks. It advocates employing segmentation, threat defense and visibility measures like firewalls, IDS/IPS, and NetFlow. The Cisco Cyber Threat Defense solution places these tools at the access, aggregation and core layers, including the ASA firewall, Nexus switches, and StealthWatch for network monitoring and analytics. This provides visibility into network traffic across physical and virtual infrastructure to detect threats and policy violations.
Free NetFlow Analyzer training - Getting the initial settings right
This document provides an overview of initial setup and configuration of NetFlow Analyzer. It discusses exporting network flow data, viewing traffic details in the inventory, and configuring alerts. The steps include:
1) Configuring flow export from network devices using manual commands or the Network Configuration Manager tool.
2) Viewing traffic statistics and details for devices, interfaces, applications and other groups in the inventory section.
3) Creating alert profiles to monitor thresholds and receive notifications for issues like interface overutilization or link downs.
ClickHouse Paris Meetup. Pragma Analytics Software Suite w/ClickHouse, by Mat...
Pragma Innovation is an IT services company focused on time series data solutions. Their PASS (Pragma Analytics Software Suite) allows companies to analyze, report on, and make decisions from time series network data using open source software. It is designed for ISPs, hosting providers, and telecom companies. The solution ingests network and log data, standardizes it, enriches it using tools like GeoIP, and stores it in a time series database. This allows customers to build applications for traffic engineering, security, and business intelligence use cases. Key challenges addressed in version 2.0 of the solution include data sampling, IPv4/IPv6 support, and using ClickHouse as the time series database for its performance and simplicity
F5 TMOS v13.0
The document discusses new features in the F5 BIG-IP v13.0 software release. Key points include enhanced application protection and access, usability improvements, enriched reporting for visibility, support for MQTT IoT traffic, and augmented capabilities for service providers. Notable features are high performance virtual editions for NFV/cloud use cases, simplified management in AWS using roles/permissions, and network behavioral DDoS detection.
1. Network monitoring and measurement-2.ppt
Network monitoring and measurement involves measuring network traffic and monitoring systems to detect outages. It provides information for understanding network behavior, planning, security, billing, and more. Both active and passive monitoring techniques are used, with active involving test traffic and passive observing live traffic. Key metrics include availability, connectivity, latency, throughput, and link utilization. Various software tools exist to help with network monitoring and management tasks.
Network Bandwidth management - Mumbai Seminar
This document discusses how NetFlow Analyzer can help with bandwidth monitoring and management challenges. It provides an overview of NetFlow Analyzer's capabilities for gaining visibility into network traffic, managing traffic across LAN, WAN and wireless networks, identifying and resolving network issues faster, controlling unnecessary bandwidth usage, and preventing security threats. Key benefits highlighted include real-time and historical traffic monitoring and reporting, troubleshooting capabilities, traffic grouping and analysis, alerting, and affordable pricing starting at $595 for 10 interfaces. A case study is also presented on how NetFlow Analyzer helped a large healthcare organization address network downtime issues and reduce bandwidth costs.
Similar to Webinar: How to troubleshoot bandwidth hogs and take action. (20)
Free Netflow analyzer training - diagnosing_and_troubleshooting
Free Netflow analyzer training - diagnosing_and_troubleshooting
NetFlow Analyzer Training Part II : Diagnosing and troubleshooting traffic is...
NetFlow Analyzer Training Part II : Diagnosing and troubleshooting traffic is...
Export flows, group traffic, map application traffic and more: NetFlow Analyz...
Export flows, group traffic, map application traffic and more: NetFlow Analyz...
NetFlow Analyzer Training Part I: Getting the initial settings right
NetFlow Analyzer Training Part I: Getting the initial settings right
How ManageEngine NetFlow Analyzer helped Boston Properties Save Bandwidth Costs
How ManageEngine NetFlow Analyzer helped Boston Properties Save Bandwidth Costs
The Need for Complex Analytics from Forwarding Pipelines
The Need for Complex Analytics from Forwarding Pipelines
Cisco IT Infrastructure Monitoring with SolarWinds Tools
Cisco IT Infrastructure Monitoring with SolarWinds Tools
Free NetFlow Analyzer training - Getting the initial settings right
Free NetFlow Analyzer training - Getting the initial settings right
ClickHouse Paris Meetup. Pragma Analytics Software Suite w/ClickHouse, by Mat...
ClickHouse Paris Meetup. Pragma Analytics Software Suite w/ClickHouse, by Mat...
More from ManageEngine, Zoho Corporation
Create seamless customer experiences
Learn how analyzing key website metrics that are related to user interactions will help you make insightful improvements. Understand how replaying individual customer transactions and analyzing every element of your webpage will help drill down to the root causes issues and create better content strategies respectively.
From web interface to database: Monitor what matters
Learn how to how to monitor and gain code-level insights into the performance of your Java, Node.js, PHP, and .NET Core applications in real-time with the help of ManageEngine Applications Manager.
NetFlow Analyzer Free Training Series Part I - May 2020
Get a complete overview of NetFlow Analyzer. Learn about the basic initial settings, configuration, customization, alerts, reports, and the various other features of the product.
Overcome real-time server and VM monitoring challenges
Learn how to monitor the operational status of servers and virtual machines across an organization's IT infrastructure, track the status of critical metrics, tackle hardware problems, and optimize resource allocation effectively with ManageEngine Applications Manager.
Modernizing Cloud and Hyperconverged Infrastructure monitoring
This document discusses monitoring various cloud infrastructure and applications using an end-to-end application performance monitoring solution. It covers monitoring metrics in AWS, GCP, Oracle Cloud Infrastructure, Hyperconverged infrastructure like Nutanix and Cisco UCS, Oracle Autonomous Database, and using trend analysis reports for forecasting and resource planning. Upcoming monitoring enhancements for additional cloud services on AWS, Azure, and GCP are also outlined through 2020.
Deliver seamless digital experience
Learn how to monitor your website URLs and identify components that slow down your website performance.
Free NetFlow Analyzer training Season 1 Part 2 - Feb 2020
Learn the various advanced monitoring, customization, troubleshooting and security features in Netflow Analyzer.
Agenda:
-Troubleshooting with forensics and ASAM
-Reporting and automation
-Traffic shaping
-Distributed Monitoring
From web interface to the database:Monitor all that matters
Learn how to track key operational metrics of your Node.js and PHP infrastructure in real-time and get insight into the nuances of autonomous databases.
NetFlow Analyzer Training Season 1 Part 1 - Feb 2020 - EST
Get to know more about NetFlow Analyzer, its basic settings and how to up your bandwidth management game with NetFlow Analyzer.
NetFlow Analyzer Training Season 1 Part 1 - Feb 2020 - GMT
The document discusses the results of a study on the impact of COVID-19 lockdowns on air pollution. Researchers analyzed satellite data from NASA and the European Space Agency and found that nitrogen dioxide levels decreased significantly during lockdown periods in major cities across the world as traffic and industrial activities reduced. Overall, the temporary improvements in air quality during widespread lockdowns highlight the human-caused nature of poor air pollution but also show how collective changes in behavior can positively impact the environment.
NetFlow Analyzer Product Overview
NetFlow Analyzer captures flow data and monitors interface bandwidth usage in real-time. This product overview will help you get the most out of NetFlow Analyzer.
Monitoring cloud applications and hyperconverged infrastructure
This document discusses monitoring cloud and hyperconverged infrastructure. It covers monitoring Amazon Web Services (AWS) by visualizing metrics for compute, storage, databases and other services. It also discusses monitoring Oracle Cloud Infrastructure and Google Cloud Platform, including compute metrics. Monitoring Nutanix hyperconverged infrastructure is covered, such as storage, virtual machines and alerts. The document concludes with the importance of capacity planning for cloud resources.
Building the right website monitoring strategy
This document discusses website monitoring strategies including tracking key metrics of web servers like Apache, IIS and Nginx; optimizing individual URLs for user experience; using synthetic monitoring to simulate web transactions; and detecting unauthorized content changes. It provides overviews of monitoring various web servers and their key performance indicators. It also describes optimizing the user experience by monitoring URL sequences, implementing real browser monitoring, and using web transaction recording. Finally, it discusses monitoring website content to detect hacks and defacement.
Unlock the value of your big data infrastructure
This document summarizes a presentation about unlocking the value of big data infrastructure. It discusses key components of Apache Hadoop and Spark including HDFS, MapReduce, YARN, and Spark cores/RDDs. It also discusses leveraging graph databases for business, NoSQL databases in big data frameworks like MongoDB, Cassandra, and Redis. Finally, it discusses discovering and mapping issues, and forecasting utilization trends to plan capacity.
Key to optimal end user experience
Learn how to optimize application response time, measure end user satisfaction, and analyze application errors with ease.
Monitoring cloud applications and containers
Learn the key metrics to track in your AWS, Azure, Docker, and Kubernetes infrastructure to ensure that they are up and running.
implementing the right website monitoring strategy
This document discusses implementing the right website monitoring strategy. It covers monitoring web servers like Apache, IIS, and Nginx to ensure performance and availability. It also discusses optimizing individual URLs, monitoring dynamic webpages through synthetic transactions, and detecting unauthorized changes to websites through content monitoring. The overall strategy aims to provide visibility, optimize user experience, and prevent hacks.
Big data and non relational database
Learn how to monitor critical big data metrics and understand how effective capacity planning can help in achieving optimal database performance.
Visibility-from web application interface to the database
Learn how to identify transactions that are slowing down your applications and how analyzing error traces can help you eliminate performance barriers.
Free OpManager training Part 4 - Monitoring Network Performance and Network Maps
Free OpManager training Part 4 - Monitoring Network Performance and Network MapsManageEngine, Zoho Corporation
This document summarizes a training session on fault management and IT automation using OpManager. It includes an agenda covering alarm severity levels, threshold violation alarms, alarms from event logs, SNMP traps, syslog alarms, and notifications. It also discusses using IT workflows to automate problem remediation.More from ManageEngine, Zoho Corporation (20)
From web interface to database: Monitor what matters
From web interface to database: Monitor what matters
NetFlow Analyzer Free Training Series Part I - May 2020
NetFlow Analyzer Free Training Series Part I - May 2020
Overcome real-time server and VM monitoring challenges
Overcome real-time server and VM monitoring challenges
Modernizing Cloud and Hyperconverged Infrastructure monitoring
Modernizing Cloud and Hyperconverged Infrastructure monitoring
Free NetFlow Analyzer training Season 1 Part 2 - Feb 2020
Free NetFlow Analyzer training Season 1 Part 2 - Feb 2020
From web interface to the database:Monitor all that matters
From web interface to the database:Monitor all that matters
NetFlow Analyzer Training Season 1 Part 1 - Feb 2020 - EST
NetFlow Analyzer Training Season 1 Part 1 - Feb 2020 - EST
NetFlow Analyzer Training Season 1 Part 1 - Feb 2020 - GMT
NetFlow Analyzer Training Season 1 Part 1 - Feb 2020 - GMT
Monitoring cloud applications and hyperconverged infrastructure
Monitoring cloud applications and hyperconverged infrastructure
implementing the right website monitoring strategy
implementing the right website monitoring strategy
Visibility-from web application interface to the database
Visibility-from web application interface to the database
Free OpManager training Part 4 - Monitoring Network Performance and Network Maps
Free OpManager training Part 4 - Monitoring Network Performance and Network Maps
Recently uploaded
Measures in SQL (SIGMOD 2024, Santiago, Chile)
SQL has attained widespread adoption, but Business Intelligence tools still use their own higher level languages based upon a multidimensional paradigm. Composable calculations are what is missing from SQL, and we propose a new kind of column, called a measure, that attaches a calculation to a table. Like regular tables, tables with measures are composable and closed when used in queries.
SQL-with-measures has the power, conciseness and reusability of multidimensional languages but retains SQL semantics. Measure invocations can be expanded in place to simple, clear SQL.
To define the evaluation semantics for measures, we introduce context-sensitive expressions (a way to evaluate multidimensional expressions that is consistent with existing SQL semantics), a concept called evaluation context, and several operations for setting and modifying the evaluation context.
A talk at SIGMOD, June 9–15, 2024, Santiago, Chile
Authors: Julian Hyde (Google) and John Fremlin (Google)
https://doi.org/10.1145/3626246.3653374
Alluxio Webinar | 10x Faster Trino Queries on Your Data Platform
Alluxio Webinar
June. 18, 2024
For more Alluxio Events: https://www.alluxio.io/events/
Speaker:
- Jianjian Xie (Staff Software Engineer, Alluxio)
As Trino users increasingly rely on cloud object storage for retrieving data, speed and cloud cost have become major challenges. The separation of compute and storage creates latency challenges when querying datasets; scanning data between storage and compute tiers becomes I/O bound. On the other hand, cloud API costs related to GET/LIST operations and cross-region data transfer add up quickly.
The newly introduced Trino file system cache by Alluxio aims to overcome the above challenges. In this session, Jianjian will dive into Trino data caching strategies, the latest test results, and discuss the multi-level caching architecture. This architecture makes Trino 10x faster for data lakes of any scale, from GB to EB.
What you will learn:
- Challenges relating to the speed and costs of running Trino in the cloud
- The new Trino file system cache feature overview, including the latest development status and test results
- A multi-level cache framework for maximized speed, including Trino file system cache and Alluxio distributed cache
- Real-world cases, including a large online payment firm and a top ridesharing company
- The future roadmap of Trino file system cache and Trino-Alluxio integration
Unlock the Secrets to Effortless Video Creation with Invideo: Your Ultimate G...
Unlock the Secrets to Effortless Video Creation with Invideo: Your Ultimate G...The Third Creative Media
"Navigating Invideo: A Comprehensive Guide" is an essential resource for anyone looking to master Invideo, an AI-powered video creation tool. This guide provides step-by-step instructions, helpful tips, and comparisons with other AI video creators. Whether you're a beginner or an experienced video editor, you'll find valuable insights to enhance your video projects and bring your creative ideas to life.Malibou Pitch Deck For Its €3M Seed Round
French start-up Malibou raised a €3 million Seed Round to develop its payroll and human resources
management platform for VSEs and SMEs. The financing round was led by investors Breega, Y Combinator, and FCVC.
Photoshop Tutorial for Beginners (2024 Edition)
Photoshop Tutorial for Beginners (2024 Edition)
Explore the evolution of programming and software development and design in 2024. Discover emerging trends shaping the future of coding in our insightful analysis."
Here's an overview:Introduction: The Evolution of Programming and Software DevelopmentThe Rise of Artificial Intelligence and Machine Learning in CodingAdopting Low-Code and No-Code PlatformsQuantum Computing: Entering the Software Development MainstreamIntegration of DevOps with Machine Learning: MLOpsAdvancements in Cybersecurity PracticesThe Growth of Edge ComputingEmerging Programming Languages and FrameworksSoftware Development Ethics and AI RegulationSustainability in Software EngineeringThe Future Workforce: Remote and Distributed TeamsConclusion: Adapting to the Changing Software Development LandscapeIntroduction: The Evolution of Programming and Software Development
Photoshop Tutorial for Beginners (2024 Edition)Explore the evolution of programming and software development and design in 2024. Discover emerging trends shaping the future of coding in our insightful analysis."Here's an overview:Introduction: The Evolution of Programming and Software DevelopmentThe Rise of Artificial Intelligence and Machine Learning in CodingAdopting Low-Code and No-Code PlatformsQuantum Computing: Entering the Software Development MainstreamIntegration of DevOps with Machine Learning: MLOpsAdvancements in Cybersecurity PracticesThe Growth of Edge ComputingEmerging Programming Languages and FrameworksSoftware Development Ethics and AI RegulationSustainability in Software EngineeringThe Future Workforce: Remote and Distributed TeamsConclusion: Adapting to the Changing Software Development LandscapeIntroduction: The Evolution of Programming and Software Development
The importance of developing and designing programming in 2024
Programming design and development represents a vital step in keeping pace with technological advancements and meeting ever-changing market needs. This course is intended for anyone who wants to understand the fundamental importance of software development and design, whether you are a beginner or a professional seeking to update your knowledge.
Course objectives:
1. **Learn about the basics of software development:
- Understanding software development processes and tools.
- Identify the role of programmers and designers in software projects.
2. Understanding the software design process:
- Learn about the principles of good software design.
- Discussing common design patterns such as Object-Oriented Design.
3. The importance of user experience (UX) in modern software:
- Explore how user experience can improve software acceptance and usability.
- Tools and techniques to analyze and improve user experience.
4. Increase efficiency and productivity through modern development tools:
- Access to the latest programming tools and languages used in the industry.
- Study live examples of applications
Mobile App Development Company In Noida | Drona Infotech
React.js, a JavaScript library developed by Facebook, has gained immense popularity for building user interfaces, especially for single-page applications. Over the years, React has evolved and expanded its capabilities, becoming a preferred choice for mobile app development. This article will explore why React.js is an excellent choice for the Best Mobile App development company in Noida.
Visit Us For Information: https://www.linkedin.com/pulse/what-makes-reactjs-stand-out-mobile-app-development-rajesh-rai-pihvf/
What’s New in Odoo 17 – A Complete Roadmap
Odoo releases a new update every year. The latest version, Odoo 17, came out in October 2023. It brought many improvements to the user interface and user experience, along with new features in modules like accounting, marketing, manufacturing, websites, and more.
The Odoo 17 update has been a hot topic among startups, mid-sized businesses, large enterprises, and Odoo developers aiming to grow their businesses. Since it is now already the first quarter of 2024, you must have a clear idea of what Odoo 17 entails and what it can offer your business if you are still not aware of it.
This blog covers the features and functionalities. Explore the entire blog and get in touch with expert Odoo ERP consultants to leverage Odoo 17 and its features for your business too.
An Overview of Odoo ERP
Odoo ERP was first released as OpenERP software in February 2005. It is a suite of business applications used for ERP, CRM, eCommerce, websites, and project management. Ten years ago, the Odoo Enterprise edition was launched to help fund the Odoo Community version.
When you compare Odoo Community and Enterprise, the Enterprise edition offers exclusive features like mobile app access, Odoo Studio customisation, Odoo hosting, and unlimited functional support.
Today, Odoo is a well-known name used by companies of all sizes across various industries, including manufacturing, retail, accounting, marketing, healthcare, IT consulting, and R&D.
The latest version, Odoo 17, has been available since October 2023. Key highlights of this update include:
Enhanced user experience with improvements to the command bar, faster backend page loading, and multiple dashboard views.
Instant report generation, credit limit alerts for sales and invoices, separate OCR settings for invoice creation, and an auto-complete feature for forms in the accounting module.
Improved image handling and global attribute changes for mailing lists in email marketing.
A default auto-signature option and a refuse-to-sign option in HR modules.
Options to divide and merge manufacturing orders, track the status of manufacturing orders, and more in the MRP module.
Dark mode in Odoo 17.
Now that the Odoo 17 announcement is official, let’s look at what’s new in Odoo 17!
What is Odoo ERP 17?
Odoo 17 is the latest version of one of the world’s leading open-source enterprise ERPs. This version has come up with significant improvements explained here in this blog. Also, this new version aims to introduce features that enhance time-saving, efficiency, and productivity for users across various organisations.
Odoo 17, released at the Odoo Experience 2023, brought notable improvements to the user interface and added new functionalities with enhancements in performance, accessibility, data analysis, and management, further expanding its reach in the market.
The Comprehensive Guide to Validating Audio-Visual Performances.pdf
Ensuring the optimal performance of your audio-visual (AV) equipment is crucial for delivering exceptional experiences. AV performance validation is a critical process that verifies the quality and functionality of your AV setup. Whether you're a content creator, a business conducting webinars, or a homeowner creating a home theater, validating your AV performance is essential.
The Power of Visual Regression Testing_ Why It Is Critical for Enterprise App...
Visual testing plays a vital role in ensuring that software products meet the aesthetic requirements specified by clients in functional and non-functional specifications. In today's highly competitive digital landscape, users expect a seamless and visually appealing online experience. Visual testing, also known as automated UI testing or visual regression testing, verifies the accuracy of the visual elements that users interact with.
Why Apache Kafka Clusters Are Like Galaxies (And Other Cosmic Kafka Quandarie...
Closing talk for the Performance Engineering track at Community Over Code EU (Bratislava, Slovakia, June 5 2024) https://eu.communityovercode.org/sessions/2024/why-apache-kafka-clusters-are-like-galaxies-and-other-cosmic-kafka-quandaries-explored/ Instaclustr (now part of NetApp) manages 100s of Apache Kafka clusters of many different sizes, for a variety of use cases and customers. For the last 7 years I’ve been focused outwardly on exploring Kafka application development challenges, but recently I decided to look inward and see what I could discover about the performance, scalability and resource characteristics of the Kafka clusters themselves. Using a suite of Performance Engineering techniques, I will reveal some surprising discoveries about cosmic Kafka mysteries in our data centres, related to: cluster sizes and distribution (using Zipf’s Law), horizontal vs. vertical scalability, and predicting Kafka performance using metrics, modelling and regression techniques. These insights are relevant to Kafka developers and operators.
DECODING JAVA THREAD DUMPS: MASTER THE ART OF ANALYSIS
Are you ready to unlock the secrets hidden within Java thread dumps? Join us for a hands-on session where we'll delve into effective troubleshooting patterns to swiftly identify the root causes of production problems. Discover the right tools, techniques, and best practices while exploring *real-world case studies of major outages* in Fortune 500 enterprises. Engage in interactive lab exercises where you'll have the opportunity to troubleshoot thread dumps and uncover performance issues firsthand. Join us and become a master of Java thread dump analysis!
Orca: Nocode Graphical Editor for Container Orchestration
Tool demo on CEDI/SISTEDES/JISBD2024 at A Coruña, Spain. 2024.06.18
"Orca: Nocode Graphical Editor for Container Orchestration"
by Pedro J. Molina PhD. from Metadev
Modelling Up - DDDEurope 2024 - Amsterdam
What to do when you have a perfect model for your software but you are constrained by an imperfect business model?
This talk explores the challenges of bringing modelling rigour to the business and strategy levels, and talking to your non-technical counterparts in the process.
Baha Majid WCA4Z IBM Z Customer Council Boston June 2024.pdf
IBM watsonx Code Assistant for Z, our latest Generative AI-assisted mainframe application modernization solution. Mainframe (IBM Z) application modernization is a topic that every mainframe client is addressing to various degrees today, driven largely from digital transformation. With generative AI comes the opportunity to reimagine the mainframe application modernization experience. Infusing generative AI will enable speed and trust, help de-risk, and lower total costs associated with heavy-lifting application modernization initiatives. This document provides an overview of the IBM watsonx Code Assistant for Z which uses the power of generative AI to make it easier for developers to selectively modernize COBOL business services while maintaining mainframe qualities of service.
ACE - Team 24 Wrapup event at ahmedabad.
Atlassian Team 24 event wrap-up Ahmedabad. Recap of Atlassian team24 event.
Manyata Tech Park Bangalore_ Infrastructure, Facilities and More
Located in the bustling city of Bangalore, Manyata Tech Park stands as one of India’s largest and most prominent tech parks, playing a pivotal role in shaping the city’s reputation as the Silicon Valley of India. Established to cater to the burgeoning IT and technology sectors
Everything You Need to Know About X-Sign: The eSign Functionality of XfilesPr...
Wondering how X-Sign gained popularity in a quick time span? This eSign functionality of XfilesPro DocuPrime has many advancements to offer for Salesforce users. Explore them now!
Unveiling the Advantages of Agile Software Development.pdf
Learn about Agile Software Development's advantages. Simplify your workflow to spur quicker innovation. Jump right in! We have also discussed the advantages.
一比一原版(USF毕业证)旧金山大学毕业证如何办理
USF硕士毕业证成绩单【微信95270640】一比一伪造旧金山大学文凭@假冒USF毕业证成绩单+Q微信95270640办理USF学位证书@仿造USF毕业文凭证书@购买旧金山大学毕业证成绩单USF真实使馆认证/真实留信认证回国人员证明
#一整套旧金山大学文凭证件办理#—包含旧金山大学旧金山大学本科毕业证成绩单学历认证|使馆认证|归国人员证明|教育部认证|留信网认证永远存档教育部学历学位认证查询办理国外文凭国外学历学位认证#我们提供全套办理服务。
一整套留学文凭证件服务:
一:旧金山大学旧金山大学本科毕业证成绩单毕业证 #成绩单等全套材料从防伪到印刷水印底纹到钢印烫金
二:真实使馆认证(留学人员回国证明)使馆存档
三:真实教育部认证教育部存档教育部留服网站永久可查
四:留信认证留学生信息网站永久可查
国外毕业证学位证成绩单办理方法:
1客户提供办理旧金山大学旧金山大学本科毕业证成绩单信息:姓名生日专业学位毕业时间等(如信息不确定可以咨询顾问:我们有专业老师帮你查询);
2开始安排制作毕业证成绩单电子图;
3毕业证成绩单电子版做好以后发送给您确认;
4毕业证成绩单电子版您确认信息无误之后安排制作成品;
5成品做好拍照或者视频给您确认;
6快递给客户(国内顺丰国外DHLUPS等快读邮寄)。
教育部文凭学历认证认证的用途:
如果您计划在国内发展那么办理国内教育部认证是必不可少的。事业性用人单位如银行国企公务员在您应聘时都会需要您提供这个认证。其他私营 #外企企业无需提供!办理教育部认证所需资料众多且烦琐所有材料您都必须提供原件我们凭借丰富的经验帮您快速整合材料让您少走弯路。
实体公司专业为您服务如有需要请联系我: 微信95270640奈一次次令他失望山娃今年岁上五年级识得很多字从走出小屋开始山娃就知道父亲的家和工地共有一个很动听的名字——天河工地的底层空空荡荡很宽阔很凉爽在地上铺上报纸和水泥袋父亲和工人们中午全睡在地上地面坑坑洼洼山娃曾多次绊倒过也曾有长铁钉穿透凉鞋刺在脚板上但山娃不怕工地上也常有五六个从乡下来的小学生他们的父母亲也是高楼上的建筑工人小伙伴来自不同省份都操着带有浓重口音的普通话可不知为啥山娃不仅很快与他们熟识了
Recently uploaded (20)
Alluxio Webinar | 10x Faster Trino Queries on Your Data Platform
Alluxio Webinar | 10x Faster Trino Queries on Your Data Platform
Unlock the Secrets to Effortless Video Creation with Invideo: Your Ultimate G...
Unlock the Secrets to Effortless Video Creation with Invideo: Your Ultimate G...
Mobile App Development Company In Noida | Drona Infotech
Mobile App Development Company In Noida | Drona Infotech
The Comprehensive Guide to Validating Audio-Visual Performances.pdf
The Comprehensive Guide to Validating Audio-Visual Performances.pdf
The Power of Visual Regression Testing_ Why It Is Critical for Enterprise App...
The Power of Visual Regression Testing_ Why It Is Critical for Enterprise App...
Why Apache Kafka Clusters Are Like Galaxies (And Other Cosmic Kafka Quandarie...
Why Apache Kafka Clusters Are Like Galaxies (And Other Cosmic Kafka Quandarie...
DECODING JAVA THREAD DUMPS: MASTER THE ART OF ANALYSIS
DECODING JAVA THREAD DUMPS: MASTER THE ART OF ANALYSIS
Orca: Nocode Graphical Editor for Container Orchestration
Orca: Nocode Graphical Editor for Container Orchestration
Baha Majid WCA4Z IBM Z Customer Council Boston June 2024.pdf
Baha Majid WCA4Z IBM Z Customer Council Boston June 2024.pdf
Manyata Tech Park Bangalore_ Infrastructure, Facilities and More
Manyata Tech Park Bangalore_ Infrastructure, Facilities and More
Everything You Need to Know About X-Sign: The eSign Functionality of XfilesPr...
Everything You Need to Know About X-Sign: The eSign Functionality of XfilesPr...
Unveiling the Advantages of Agile Software Development.pdf
Unveiling the Advantages of Agile Software Development.pdf
Webinar: How to troubleshoot bandwidth hogs and take action.
- 1. NetFlow Analyzer Webinar - Part II How to troubleshoot bandwidth hogs and take action. Export flows Traffic group & App map Configure Alerts Reporting
- 2. AGENDA • Cisco Wireless LAN Controller • Cisco Internet Protocol Service Level Agreement • Alarms & Alert Profiles • Storage Settings • Reports • High Performance • Deep Packet Inspection
- 3. CISCO WIRELESS LAN CONTROLLER
- 7. DPI Let's you have in-depth information about the URL APPLICATION SOURCE DESTINATION CONVERSATION
- 8. CISCO (IP SLA) INTERNET PROTOCOL SERVICE LEVEL AGREEMENT
- 9. CISCO IP SLA • WAN • VOIP • VIDEO
- 10. WAN LINKS • Availability • Round Trip Time • Path Hop Round Trip Time
- 11. VOIP • Availability • MOS • Jitter • Latency • Packet Loss • Call Path Availability
- 12. VIDEO • Availability • Jitter • Latency • Packet Error
- 13. ALARMS & ALERTS PROFILE
- 14. Alert Profiles Preconfigured alerts: • Link down • No flow Threshold based alerts • IP range, IP address or IP network • Based on port/protocol range • Based on application • Based on DSCP
- 15. ALARMS
- 16. STORAGE SETTINGS
- 17. STORAGE SETTINGS • RAW Data • Aggregated Data • One-Minute Data
- 18. Aggregated data Default ON Raw data Default OFF DATA STORAGE • Each and every flow received from router is stored in raw data • Storage time limit (one hour to one month) • By default one day is selected • Improve raw storage up to one year with High Perf • Narrow down to network issues faster with forensics • Stores "top 100" records for conversation by default (Up to 300 records) • Retains data forever by default • Historical reporting
- 19. RAW DATA ADVANTAGES • One-minute granularity for the most detailed traffic analysis • Improves accuracy with each and every conversation detail • Helps in better root cause analysis • Deeper insights for troubleshooting network issues with forensics reports http://blogs.manageengine.com/product-blog/netflowanalyzer/2010/01/29/data-storage-pattern-in-netflow-analyzer.html
- 20. ONE MINUTE DATA
- 21. One-Minute Traffic Data • Interface traffic graph for less than 24-hour period • Capacity planning traffic report • Compare report Raw Data • Forensics • Last 2 hour for interface snapshot report • Traffic details for App flow, Medianet, Multicast, AVC and NSEL flow (NAT). Aggregated Data • All reports in inventory & dashboard for Application, conversation and QoS For traffic report greater than 24 hours • Search and custom search report • Consolidated report • Schedule report • Report profile DATA STORAGE SUMMARY
- 22. REPORTS
- 23. REPORTS • Custom Search • Compare • Forensics • Consolidated • Ip Group & Protocol
- 24. FORENSICS • Get more granular traffic statistics using raw data • Drill down to identify which users, applications, and protocols are consuming the most bandwidth at a specific time • Troubleshoot accurately by defining multiple criteria to filter required traffic
- 25. REPORT PROFILE
- 26. HIGH PERFORMANCE
- 27. HIGH PERFORMANCE • Increased RAW Data Storage Capacity • Columnar Database • Saves Troubleshooting Time • Improved Data Compression • Insightful Report • Better Bandwidth Management
- 29. SUMMARY We had a quick overview on monitoring – Cisco Wireless Lan Controller – DPI – Monitoring WAN, VOIP & Video Links – Notification – Storage Types - Reports - High Performance
- 30. NEED MORE HELP ? youtube.com/opmanagertechvideos help.netflowanalyzer.com forums.manageengine.com/netflowanalyzer netflowanalyzer-support@manageengine.com +1 (888) 720-9500 / +1 (408) 916 - 9595
- 31. THANK YOU ! Evaluator or Trial User eval-itom@manageengine.com Licensed Customer netflowanalyzer-support@manageengine.com