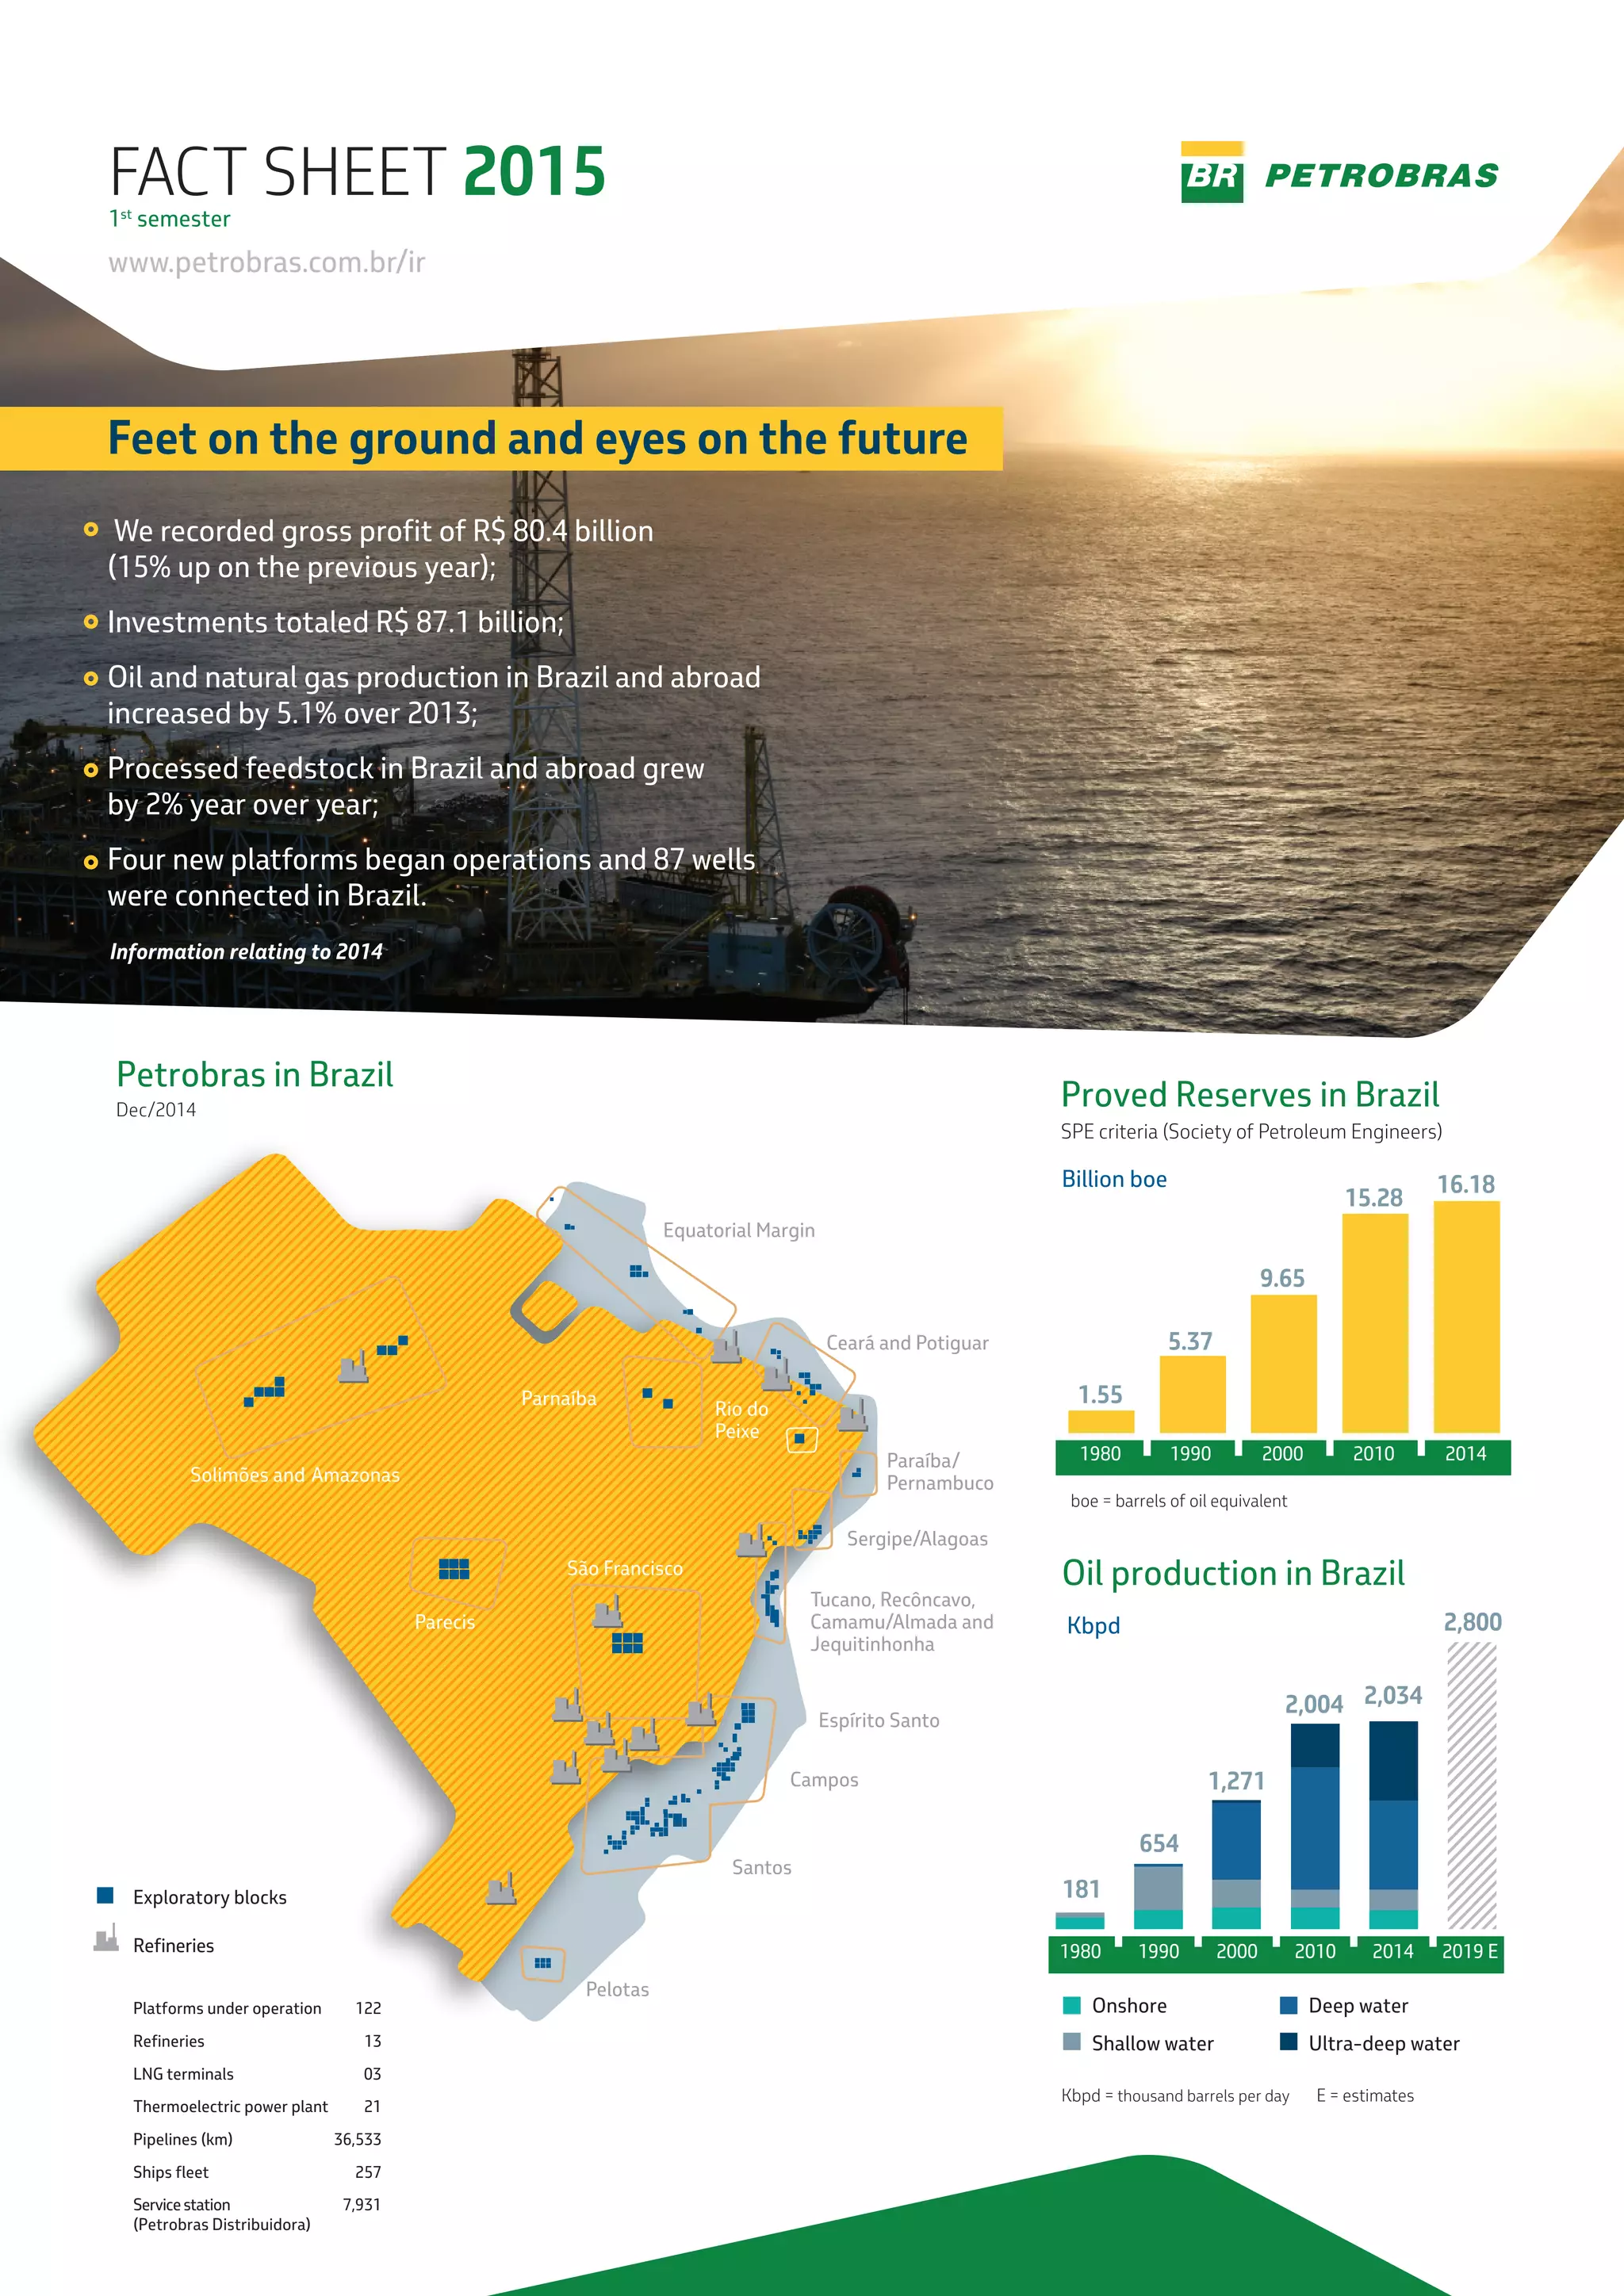
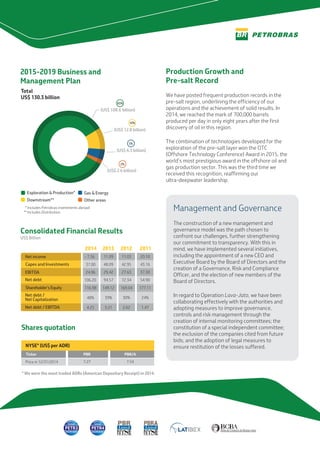
Check out highlights of our operations and financial results.
Petrobras’ Fact Sheet is an annual publication that consolidates the information relative to the fiscal year. In it, you can find the Company’s Profile, Competitive Advantages, Consolidated Financial Results, Operating and Social and Environmental Responsibility Data. The document also features our International Operations, as well as Petrobras’ Business Plan and the Performance of our shares at Bovespa and New York (NYSE).
OPERATIONAL AND FINANCIAL
RESULTS - 1st Quarter 2014
Conference Call / Webcast
May 12th 2014
1Q14 Results
8% increase in Operating Income. 14% reduction in Net Income relative to 4Q13
Higher Operating Income due to the full effect during the 1Q14 of the oil products price adjustments and the lower share of
imported diesel in sales, negatively impacted by the provision for PIDV. Net income was lower due to the impact of the fiscal
benefit from interest on capital of R$ 3.2 billion, that occurred in the 4Q13.
Growing through our strengths: Repsol's strategic plan is based on four basic pillars: upstream growth, maximizing downstream returns, maintaining our financial strength and generating competitive shareholder returns.
For more information, visit: http://ow.ly/Kc1HR
Confira destaques das nossas operações e resultados financeiros.
O Fact Sheet da Petrobras é uma publicação anual que consolida as informações relativas ao exercício fiscal. Nele você pode conferir o Perfil da Companhia, as Vantagens Competitivas, os Resultados Financeiros Consolidados, os Dados Operacionais e a Responsabilidade Social e Ambiental. Nossa Atuação Internacional também está presente no documento, assim como o Plano de Negócios da Petrobras e a Performance de nossas ações na Bovespa e em Nova Iorque (NYSE).
Perfeito para você - case de comunicação integrada [marketing imobiliário]Bruno Trindade
Case muito interessante de comunicação integrada para o mercado imobiliário. Uma forte campanha realizada pela ARC/Agra em um momento de forte retração do mercado.
Edition 41 - Sharing in Petrobras - March/2014Petrobras
- Strategic Plan: horizon 2030
- 2014-2018 Business and Management Plan
- Declaration of commerciality in Transfer of Rights areas
- Libra Consortium
- Capital raising abroad
- 2013 net income was R$ 23.6 billion
- Oil and natural gas output expected to rise 7.5% in 2014
- Record in the pre-salt: 412,000 barrels/day
- Rising output at Cascade and Chinook
- New regasification terminal in Bahia
- Petrobras returns to F1 with Willians Martini Racing
- Cenpes turns 50
- Ultra-low sulfur gasoline launched in Brazil
Bellatrix Exploration Ltd. is a growth oriented oil and gas company operating in Western Canada’s Sedimentary Basin. The Company focuses on operating with integrity and conducting operations in a safe and environmentally responsible manner while providing sustained shareholder growth in value. Our land base is focused in west central Alberta, Canada.
Improving Offshore Production WhitepaperDean Murphy
Benefit from a short whitepaper which reviews two recent presentations by senior representatives at EnQuest and Wintershall. The whitepaper looks at their approaches towards improving production efficiencies regarding their North Sea interests.
The report shares critical insight, including:
- A review of EnQuest’s production optimisation model currently being used in the North Sea to improve current operations
- A look at the planning that is going into extending the lifetime of Brage and how Wintershall are taking steps towards improving production
- Future considerations and development plans for EnQuest and Wintershall within the North Sea
O Relatório de Sustentabilidade 2017 reúne dados do período de 1º de janeiro a 31 de dezembro de 2017 e apresenta conteúdos detalhados sobre nossa atuação corporativa, resultados e contribuições para a sociedade, práticas trabalhistas, meio ambiente, entre outros.
FORWARD-LOOKING STATEMENTS:
DISCLAIMER
The presentation may contain forward-looking statements about future events within the meaning of Section 27 A of the Securities Act of 1933, as amended, and Section 21 E of the Securities Exchange Act of 1934, as amended, that are not based on historical facts and are not assurances of future results. Such forward-looking statements merely reflect the Company’s current views and estimates of future economic
circumstances, industry conditions, company performance and
financial results. Such terms as "anticipate", "believe", "expect",
"forecast", "intend", "plan", "project", "seek", "should", along with similar or analogous expressions, are used to identify such forward-looking statements. Readers are cautioned that these statements are only projections and may differ materially from
actual future results or events. Readers are referred to the documents filed by the Company with the SEC, specifically the Company’s most recent Annual Report on Form 20-F, which identify important risk factors that could cause actual results to differ from those contained in the forward-looking statements,
including, among other things, risks relating to general economic
and business conditions, including crude oil and other commodity prices, refining margins and prevailing exchange rates, uncertainties inherent in making estimates of our oil and
gas reserves including recently discovered oil and gas reserves,
international and Brazilian political, economic and social developments, receipt of governmental approvals and licenses and our ability to obtain financing.
1. Proved Reserves in Brazil
SPE criteria (Society of Petroleum Engineers)
boe = barrels of oil equivalent
Oil production in Brazil
Kbpd
Onshore
Shallow water
Deep water
Ultra-deep water
Kbpd = thousand barrels per day E = estimates
Platforms under operation
Refineries
122
13
LNG terminals 03
Thermoelectric power plant 21
Pipelines (km) 36,533
Ships fleet 257
Servicestation
(Petrobras Distribuidora)
7,931
Exploratory blocks
Refineries
Petrobras in Brazil
Dec/2014
Equatorial Margin
Ceará and Potiguar
Parnaíba
Rio do
Peixe
Solimões and Amazonas
Parecis
São Francisco
Pelotas
Santos
Campos
Espírito Santo
Sergipe/Alagoas
Paraíba/
Pernambuco
Tucano, Recôncavo,
Camamu/Almada and
Jequitinhonha
FACT SHEET 2015
www.petrobras.com.br/ir
1st
semester
2,800
1980 1990 2000 2010 2014 2019 E
181
654
1,271
2,004 2,034
Feet on the ground and eyes on the future
We recorded gross profit of R$ 80.4 billion
(15% up on the previous year);
Investments totaled R$ 87.1 billion;
Oil and natural gas production in Brazil and abroad
increased by 5.1% over 2013;
Processed feedstock in Brazil and abroad grew
by 2% year over year;
Four new platforms began operations and 87 wells
were connected in Brazil.
Billion boe
1980 1990 2010 20142000
1.55
5.37
15.28
16.18
9.65
Information relating to 2014
2. Production Growth and
Pre-salt Record
We have posted frequent production records in the
pre-salt region, underlining the efficiency of our
operations and the achievement of solid results. In
2014, we reached the mark of 700,000 barrels
produced per day in only eight years after the first
discovery of oil in this region.
The combination of technologies developed for the
exploration of the pre-salt layer won the OTC
(Offshore Technology Conference) Award in 2015, the
world’s most prestigious award in the offshore oil and
gas production sector. This was the third time we
received this recognition, reaffirming our
ultra-deepwater leadership.
Management and Governance
The construction of a new management and
governance model was the path chosen to
confront our challenges, further strengthening
our commitment to transparency. With this in
mind, we have implemented several initiatives,
including the appointment of a new CEO and
Executive Board by the Board of Directors and the
creation of a Governance, Risk and Compliance
Officer, and the election of new members of the
Board of Directors.
In regard to Operation Lava-Jato, we have been
collaborating effectively with the authorities and
adopting measures to improve governance,
controls and risk management through the
creation of internal monitoring committees; the
constitution of a special independent committee;
the exclusion of the companies cited from future
bids; and the adoption of legal measures to
ensure restitution of the losses suffered.
Consolidated Financial Results
US$ Billion
Net income
Capex and Investments
EBITDA
Net debt
Shareholder’sEquity
Net debt /
Net Capitalization
Net debt / EBITDA
2013 2012 20112014
- 7.36
37.00
24.96
106.20
116.98
48%
4.25
Total
2015-2019 Business and
Management Plan
Exploration & Production*
Downstream**
Gas & Energy
Other areas
US$ 130.3 billion
(US$ 108.6 billion)
83%
10%
(US$ 12.8 billion)
5%
(US$ 6.3 billion)
2%
(US$ 2.6 billion)
* Includes Petrobras investments abroad
** Includes Distribution
Shares quotation
* We were the most traded ADRs (American Depositary Receipt) in 2014.
7.547.27
NYSE* (US$ per ADR)
Price in 12/31/2014
PBR/APBRTicker
11.03
42.95
27.63
72.34
169.04
30%
2.62
20.10
43.16
37.30
54.90
177.11
24%
1.47
11.09
48.09
29.42
94.57
149.12
39%
3.21