Download to read offline


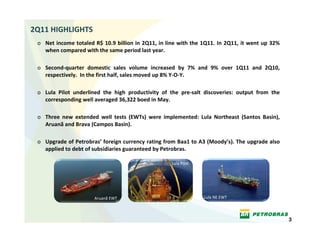
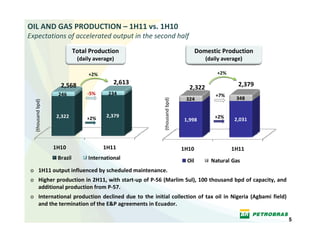
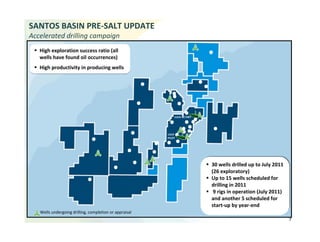
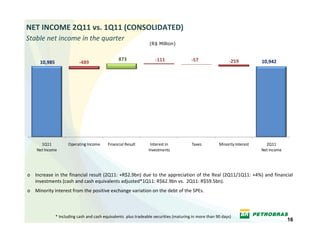


Petrobras reported financial results for the 2nd quarter of 2011, with net income of R$10.9 billion, in line with 1Q11 results. Domestic oil and gas sales volumes increased 7% compared to 1Q11 and 9% compared to 2Q10. Three new extended well tests were implemented in pre-salt areas. Production is expected to increase in the second half of the year with the start-up of new offshore fields and platforms. Drilling in the Santos Basin pre-salt continues at an accelerated pace with high exploration success.