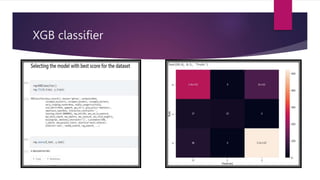
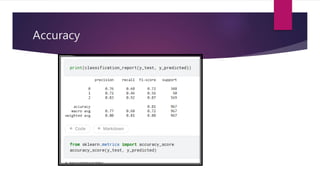
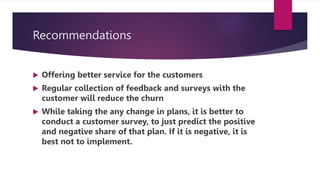
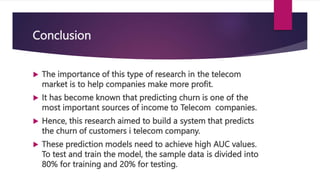
Telecom Churn Prediction
STUDENT ID
UNIVERSITY NAME
Introduction
 Customer Churn is common issue prevailing in service sector.
This issue is highly faced by credit card companies, cable
services, telecom services etc. The customer churn metrics
aid in the improvement of customer retention.
 To predict customer churn in telecom, companies typically
collect and analyze large amounts of customer data, such as
call data records, billing data, usage patterns, customer
demographics, and customer service interactions. The data is
then used to build predictive models that can identify
customers who are at risk of leaving the service.
Aim
 To predict the customer churn among Telecom
industry
 Framing out key variables used for churn prediction
 Usage of machine learning models to build, evaluate
and predict the customer churn
 Estimating optimal machine learning model for
customer churn
Dataset description
 The source dataset is basically a
comma separated variable.
 There are totally 38 variables in
the dataset
 Churn variable illustrates
whether the customer is churned
or not
 Churn is the target variable
Churn prediction model
Methods
 Exploratory data analysis (EDA) method was used in
this study to analyse the data.
 Customer was the control variable
 Model building which includes defining the purpose if
model, determine the model boundary, build the
model, create an interface and export the model.
 Evaluating machine learning algorithm is an essential
part of project.
Methods
 The data was analyzed using python software
 The libraries used are
 Numpy, pandas, plotly, matplotlib, seaborn, sklearn.
 Exploratory data analysis (EDA) is an approach to analyse data sets & to
summarize their main characteristics, often with visual methods.
 A Statistical model can be used or not, but primarily EDA is for seeing what
the data can tell us beyond the formal modelling or hypothesis
Data cleaning
Data Visualization
Histogram of categorical variables
Customer Behaviour
Heat map
Box plot by customer churn status
Visualisation
Accuracy of Various Models
Models Accuracy
Random forest classifier 78%
Logistic regression 78%
Gaussian NB 36%
Decision tree classifier 77%
XGB classifier 82%
XGB classifier
Accuracy
Recommendations
 Offering better service for the customers
 Regular collection of feedback and surveys with the
customer will reduce the churn
 While taking the any change in plans, it is better to
conduct a customer survey, to just predict the positive
and negative share of that plan. If it is negative, it is
best not to implement.
Conclusion
 The importance of this type of research in the telecom
market is to help companies make more profit.
 It has become known that predicting churn is one of the
most important sources of income to Telecom companies.
 Hence, this research aimed to build a system that predicts
the churn of customers i telecom company.
 These prediction models need to achieve high AUC values.
To test and train the model, the sample data is divided into
80% for training and 20% for testing.

Telcom churn .pptx

  • 1.
  • 2.
    Introduction  Customer Churnis common issue prevailing in service sector. This issue is highly faced by credit card companies, cable services, telecom services etc. The customer churn metrics aid in the improvement of customer retention.  To predict customer churn in telecom, companies typically collect and analyze large amounts of customer data, such as call data records, billing data, usage patterns, customer demographics, and customer service interactions. The data is then used to build predictive models that can identify customers who are at risk of leaving the service.
  • 3.
    Aim  To predictthe customer churn among Telecom industry  Framing out key variables used for churn prediction  Usage of machine learning models to build, evaluate and predict the customer churn  Estimating optimal machine learning model for customer churn
  • 4.
    Dataset description  Thesource dataset is basically a comma separated variable.  There are totally 38 variables in the dataset  Churn variable illustrates whether the customer is churned or not  Churn is the target variable
  • 5.
  • 6.
    Methods  Exploratory dataanalysis (EDA) method was used in this study to analyse the data.  Customer was the control variable  Model building which includes defining the purpose if model, determine the model boundary, build the model, create an interface and export the model.  Evaluating machine learning algorithm is an essential part of project.
  • 7.
    Methods  The datawas analyzed using python software  The libraries used are  Numpy, pandas, plotly, matplotlib, seaborn, sklearn.  Exploratory data analysis (EDA) is an approach to analyse data sets & to summarize their main characteristics, often with visual methods.  A Statistical model can be used or not, but primarily EDA is for seeing what the data can tell us beyond the formal modelling or hypothesis
  • 8.
  • 9.
  • 10.
  • 11.
  • 12.
  • 13.
    Box plot bycustomer churn status
  • 14.
  • 15.
    Accuracy of VariousModels Models Accuracy Random forest classifier 78% Logistic regression 78% Gaussian NB 36% Decision tree classifier 77% XGB classifier 82%
  • 16.
  • 17.
  • 18.
    Recommendations  Offering betterservice for the customers  Regular collection of feedback and surveys with the customer will reduce the churn  While taking the any change in plans, it is better to conduct a customer survey, to just predict the positive and negative share of that plan. If it is negative, it is best not to implement.
  • 19.
    Conclusion  The importanceof this type of research in the telecom market is to help companies make more profit.  It has become known that predicting churn is one of the most important sources of income to Telecom companies.  Hence, this research aimed to build a system that predicts the churn of customers i telecom company.  These prediction models need to achieve high AUC values. To test and train the model, the sample data is divided into 80% for training and 20% for testing.

Editor's Notes

  • #12 Most of the customer were found to be retained especially young aged customers. Churning was highly seen in elderly customers.
  • #13 Correlation: Dependence or association is any statistical relationship, whether causal or not, between two random variables or bivariate data. With the help of Correlation matrix, we can find interdependency between variables 1)Least dependency of variables for predicting churn are tenure and contract. 2)Churn variable is depending more on monthly charges.
  • #14 We found outliers in exiting customers which is out of whiskers. An Outlier is an observation that is numerically distant from the rest of the data. • Using Skew() method we found that Churn data is inconsistent with tenure • Customers who disconnecting their subscription plans are selecting short tenure Telecom Company need to offer better plans for those customers who choose short tenures.
  • #15 Churning was largely seen among Single customers than Married. Most of the married customers stayed within the company. There are no gender biases in churning status among customers.