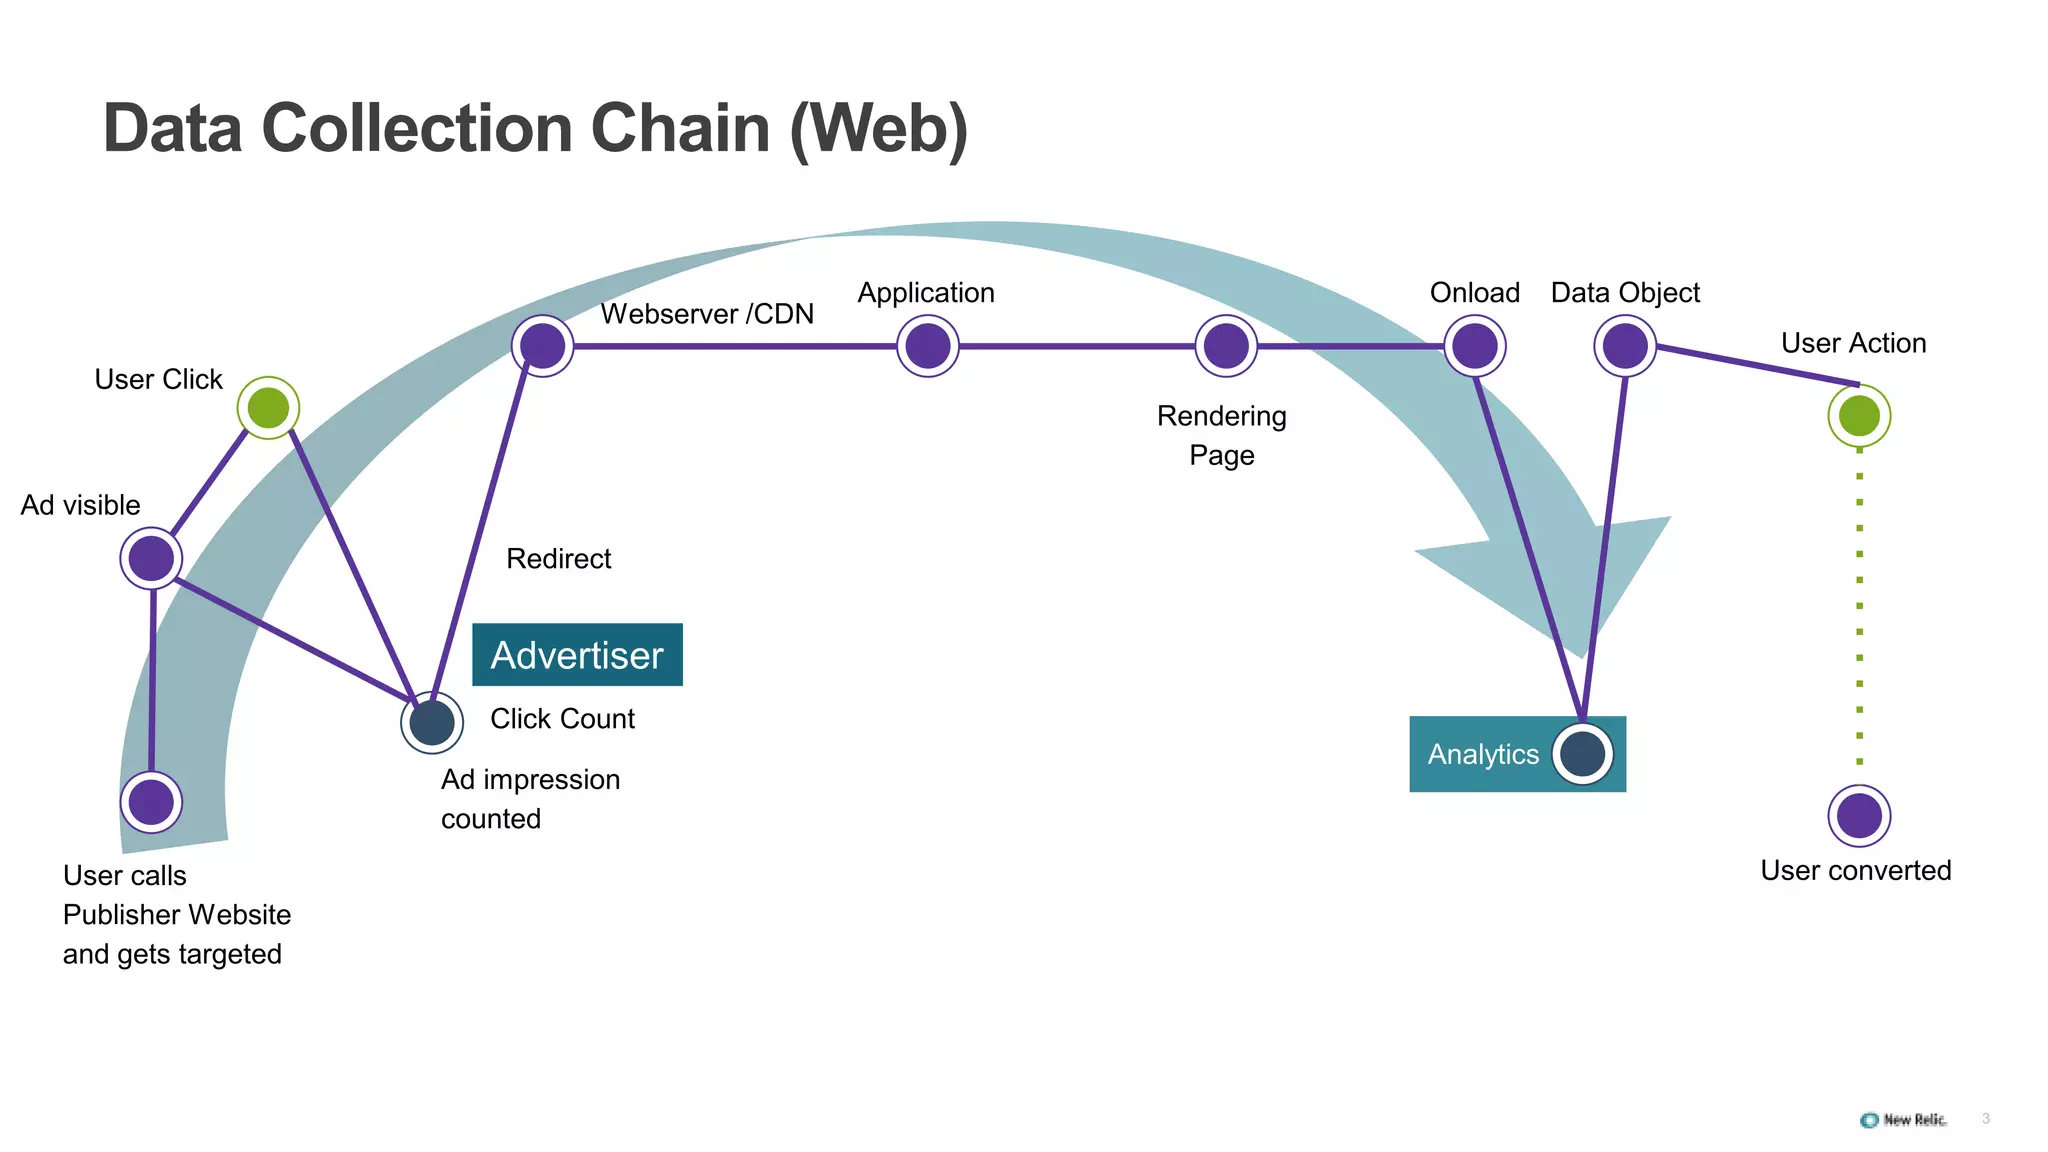
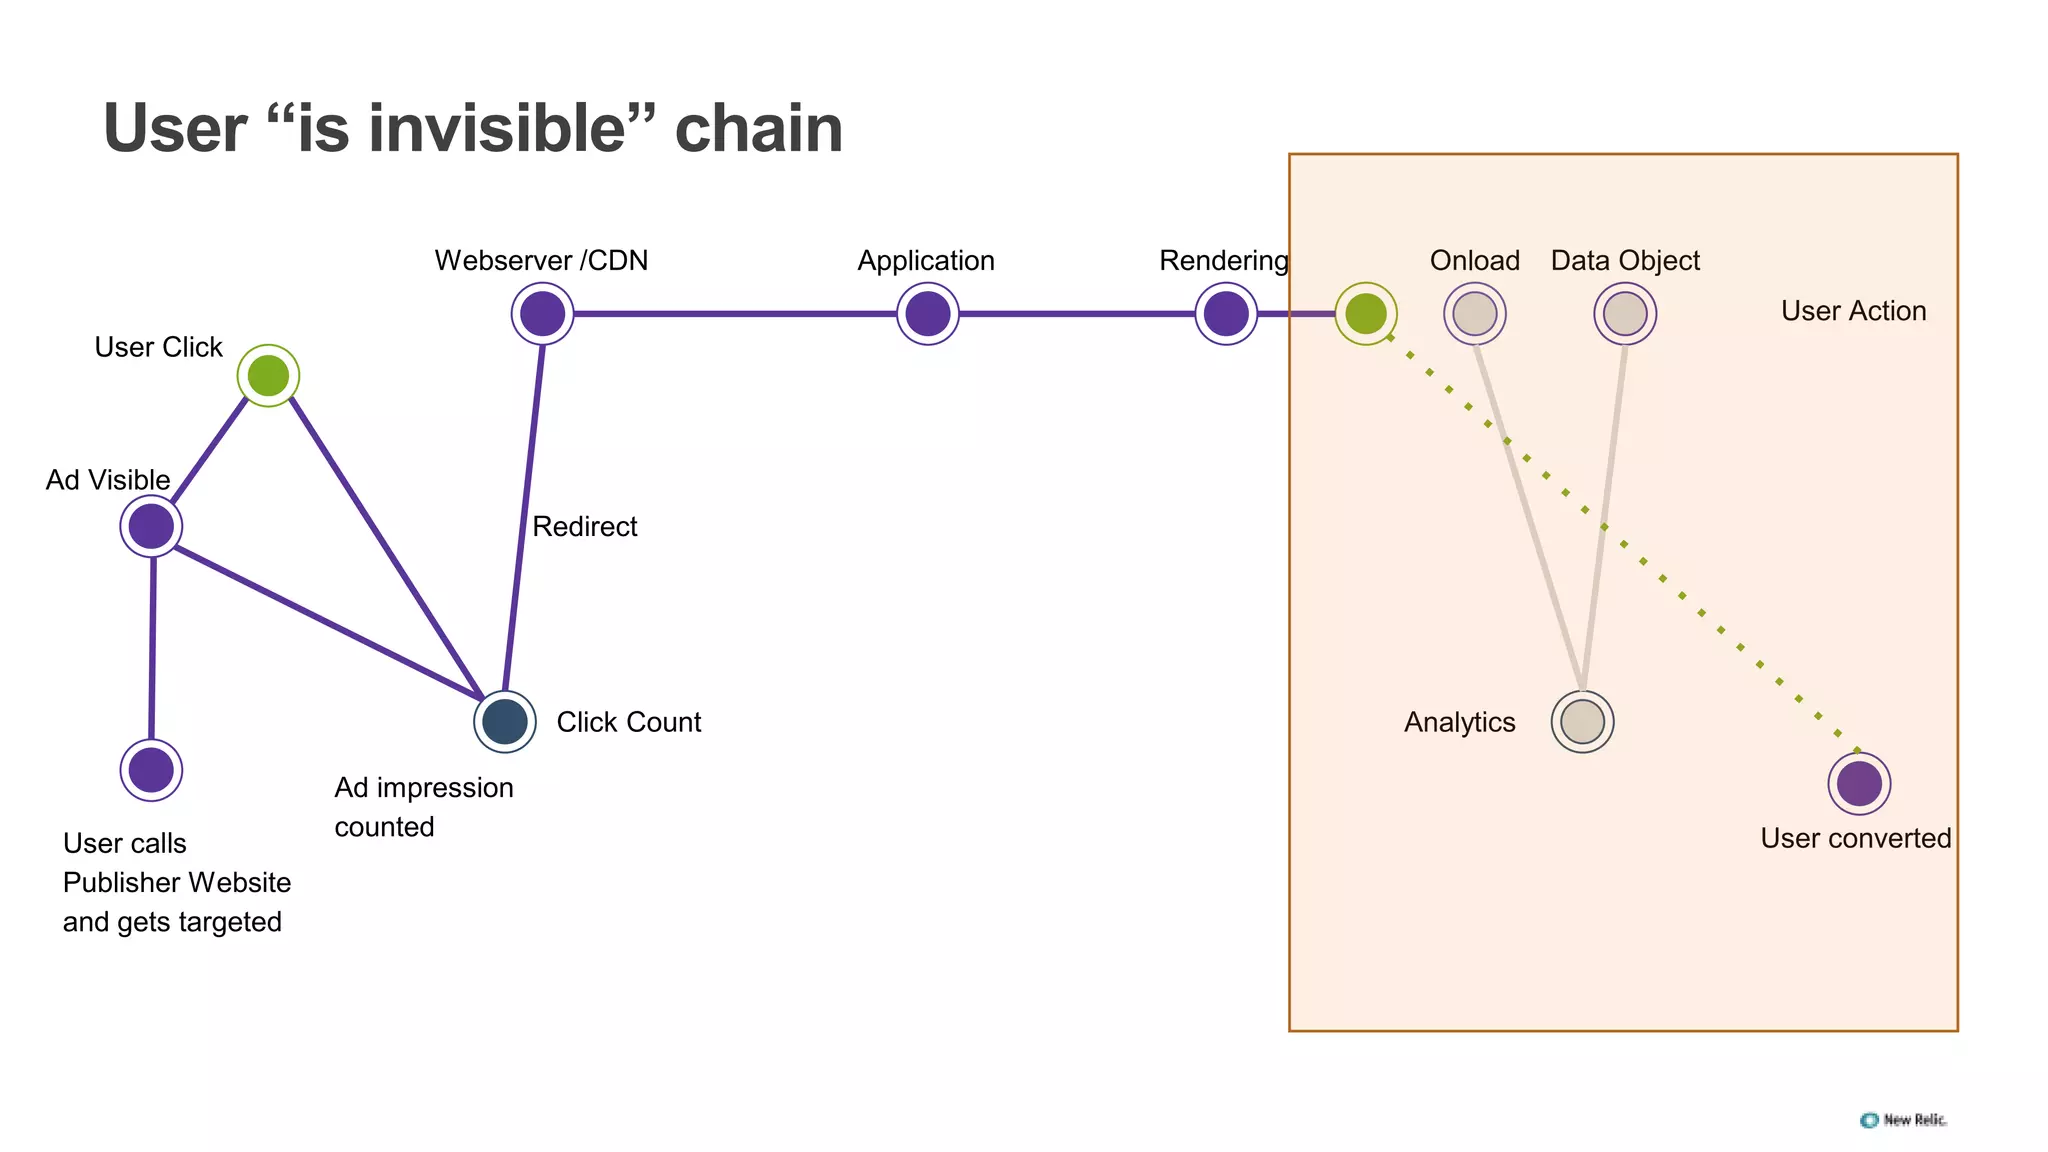
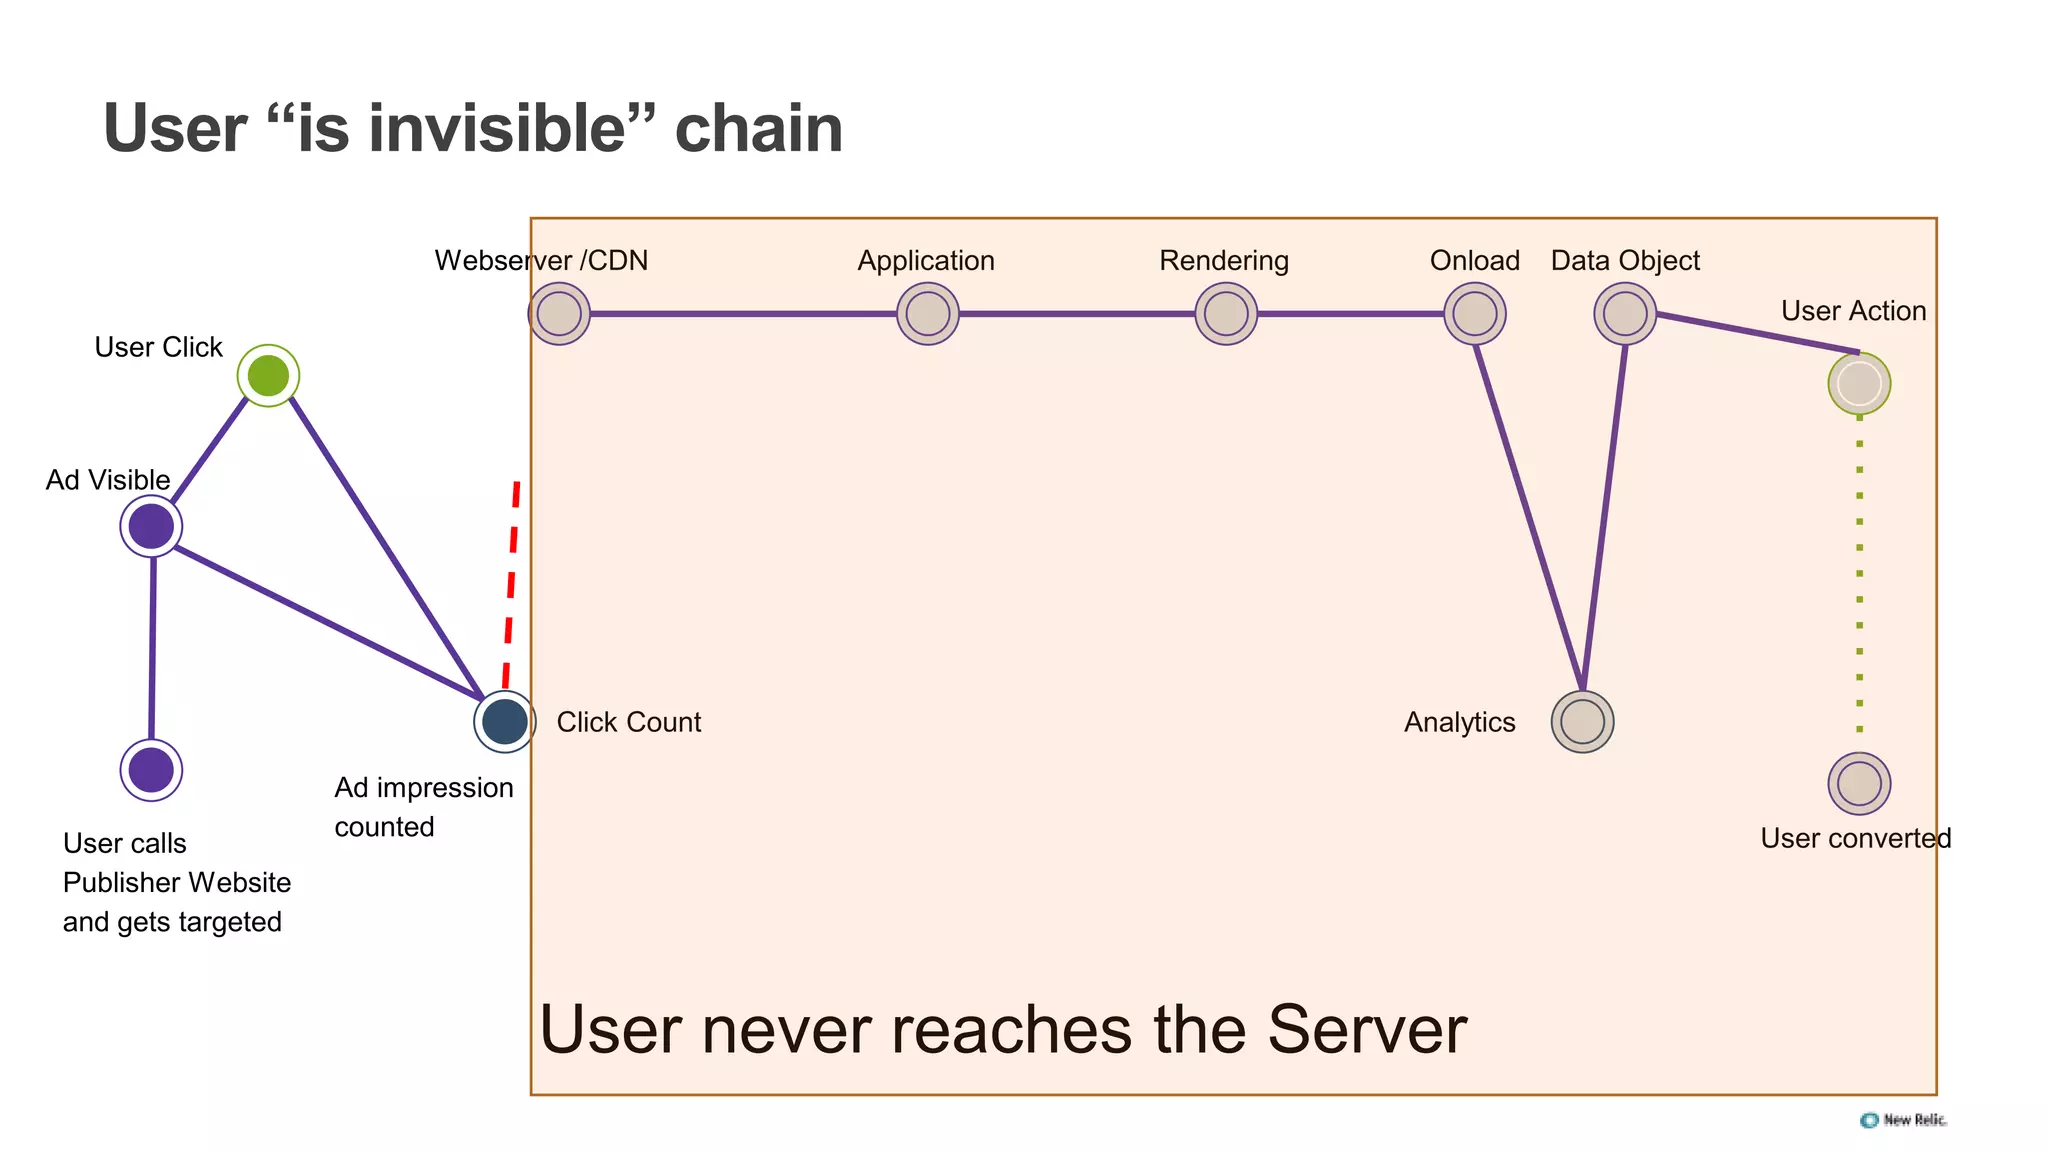
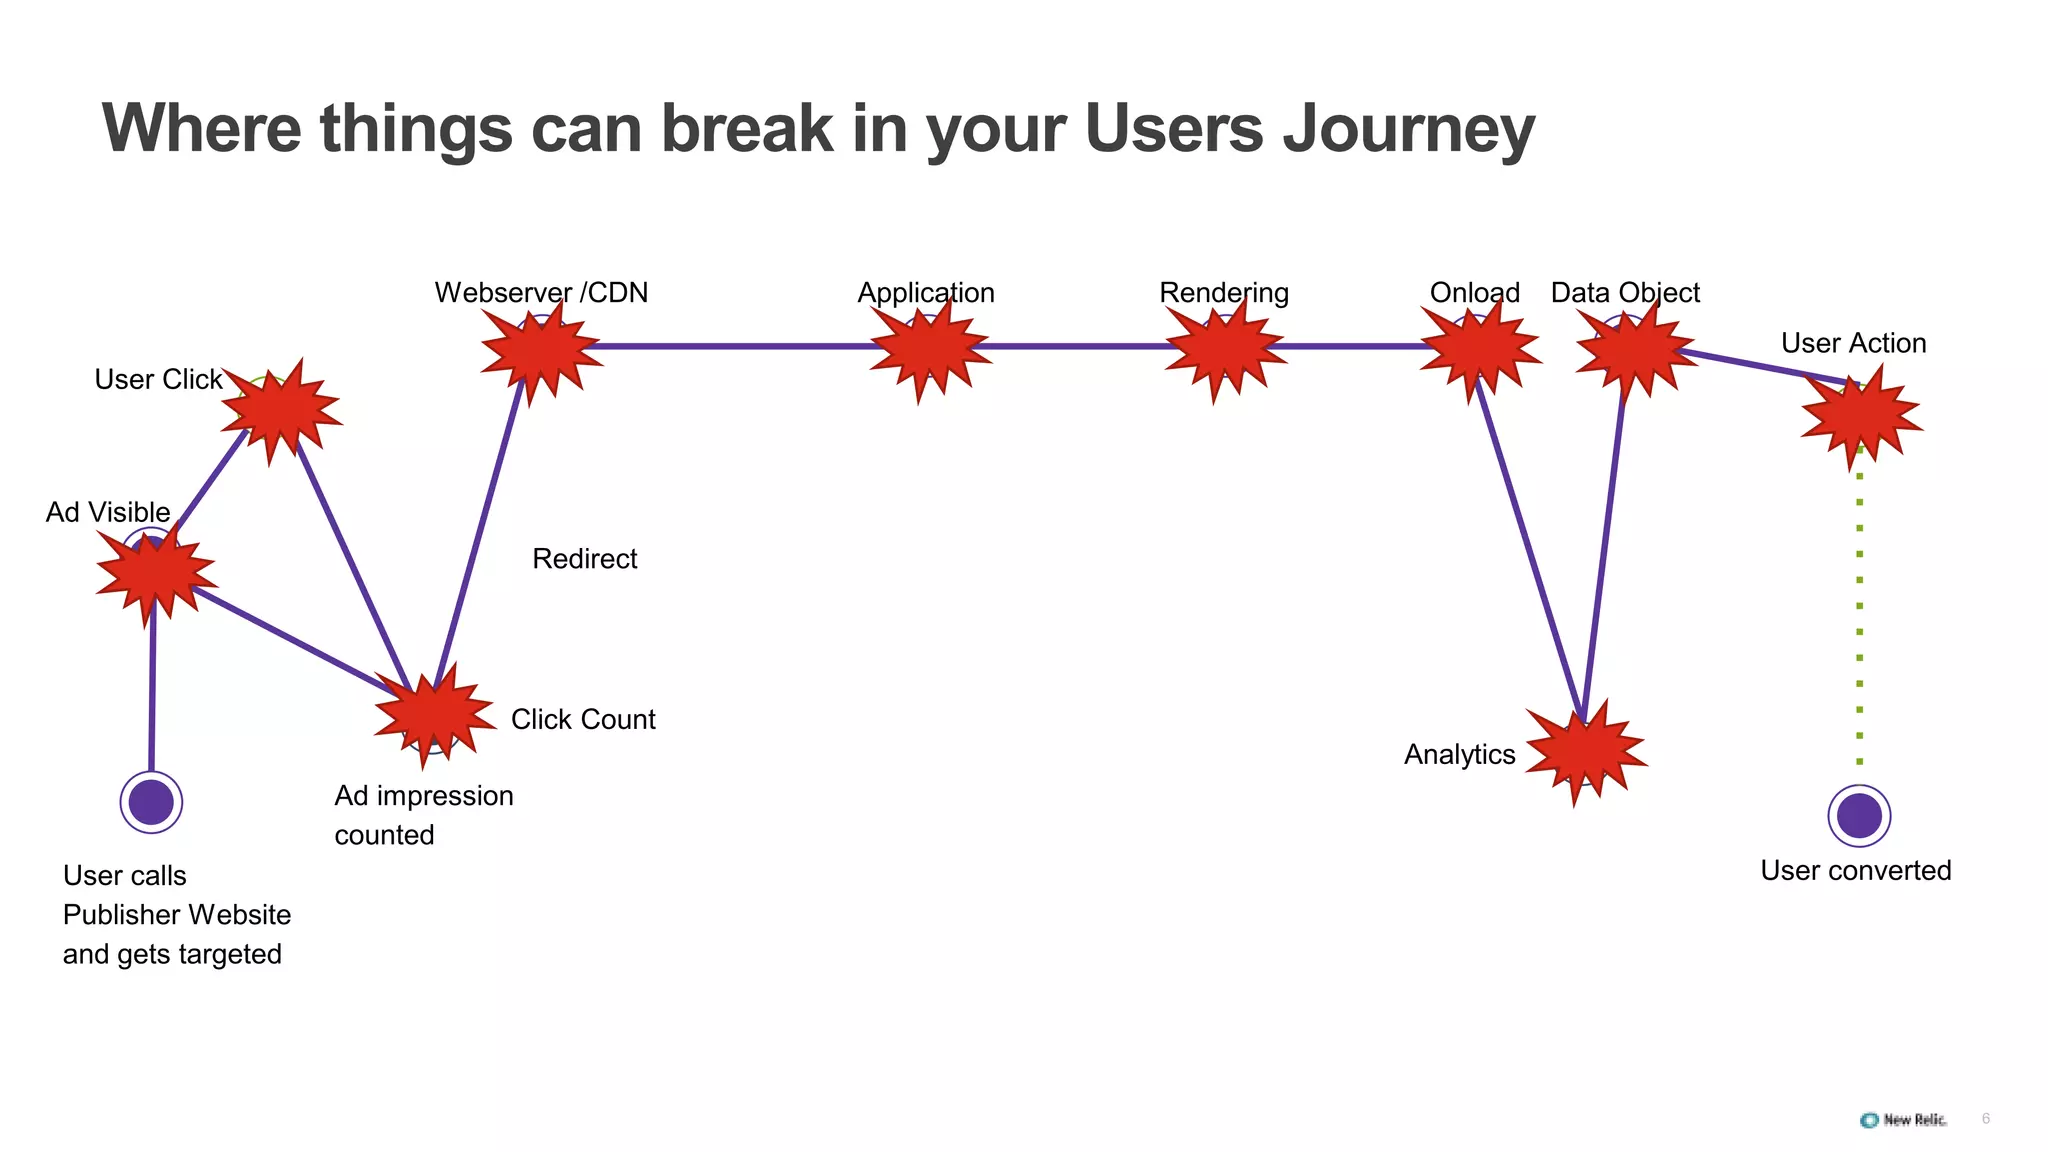
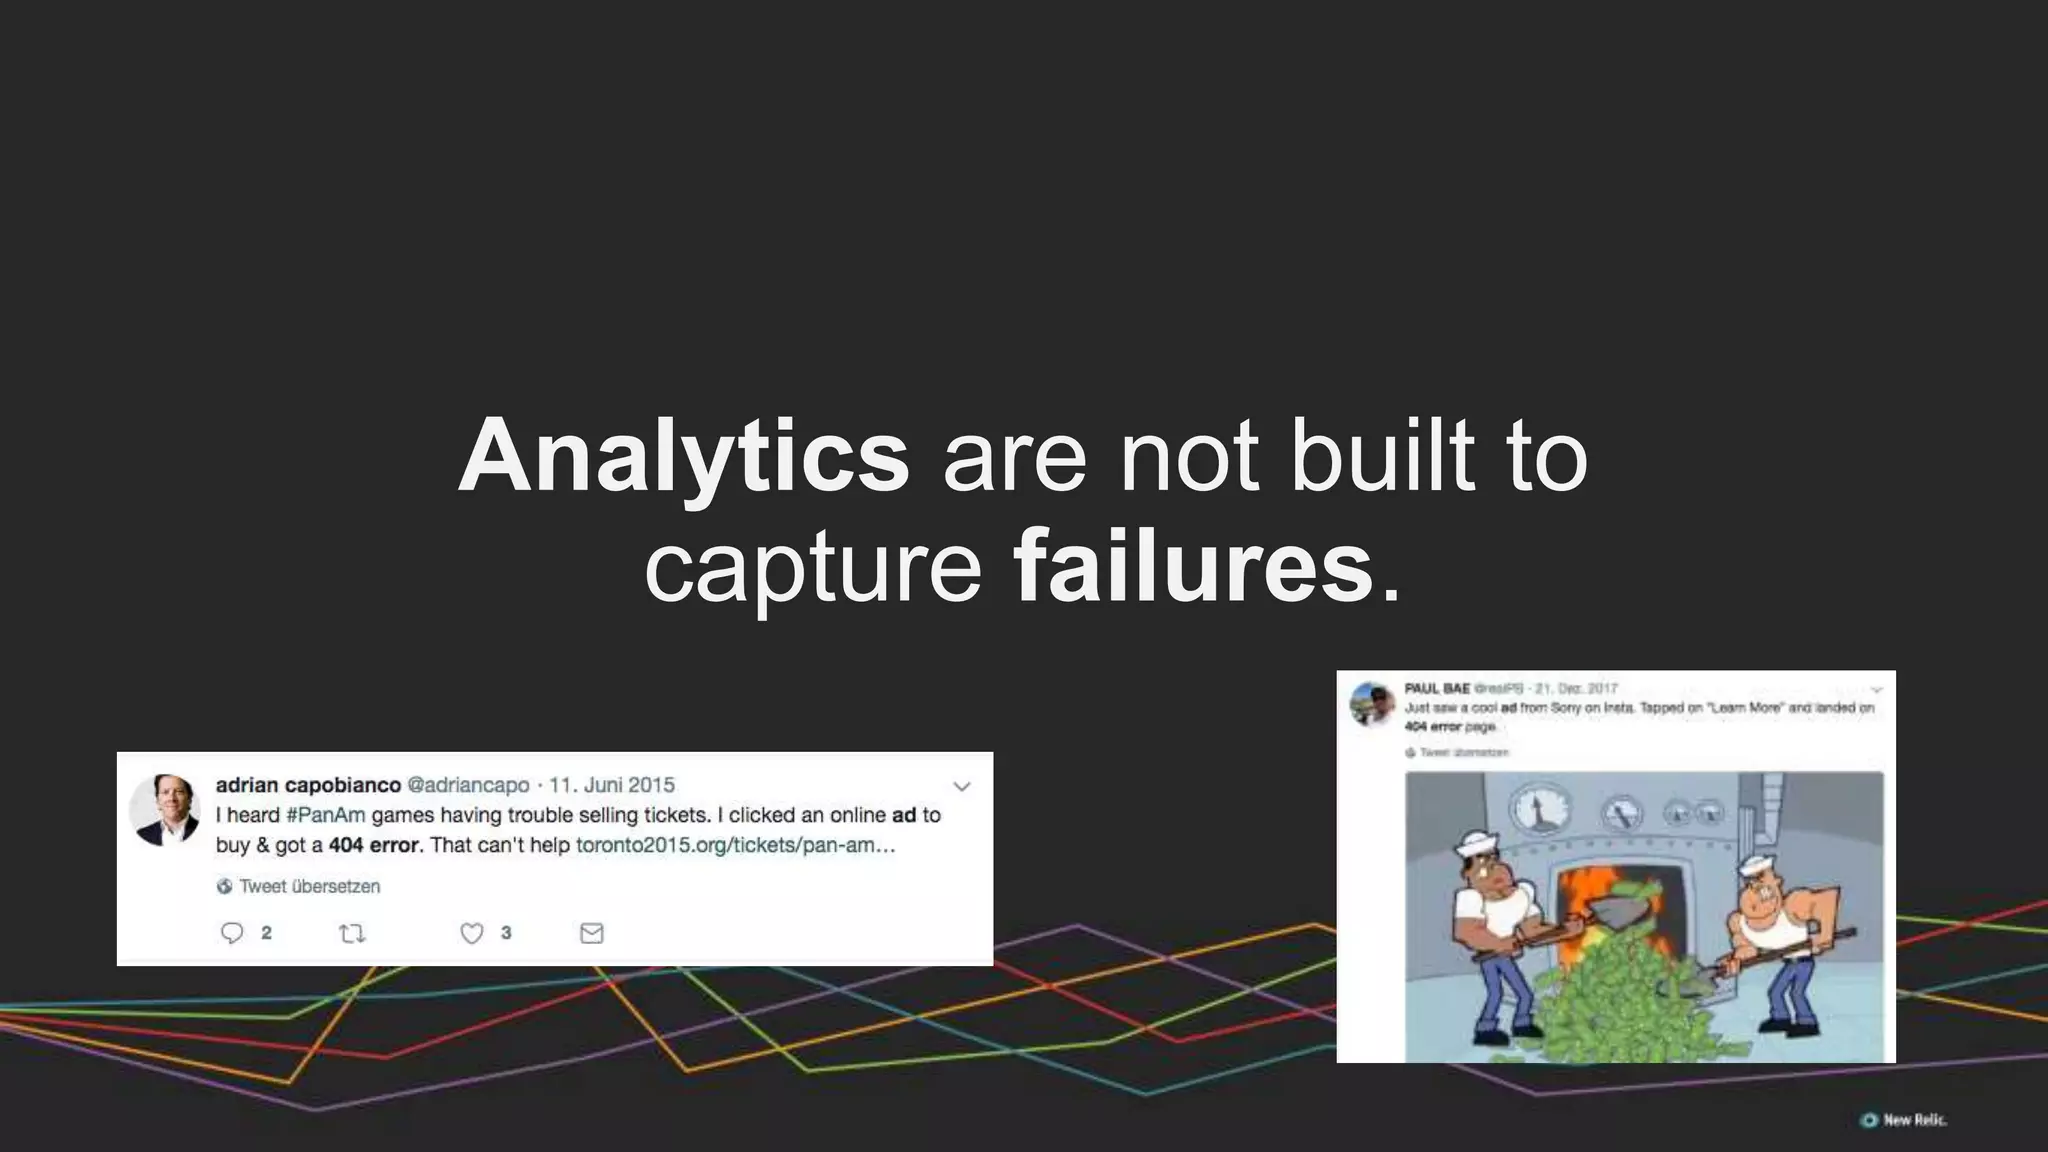
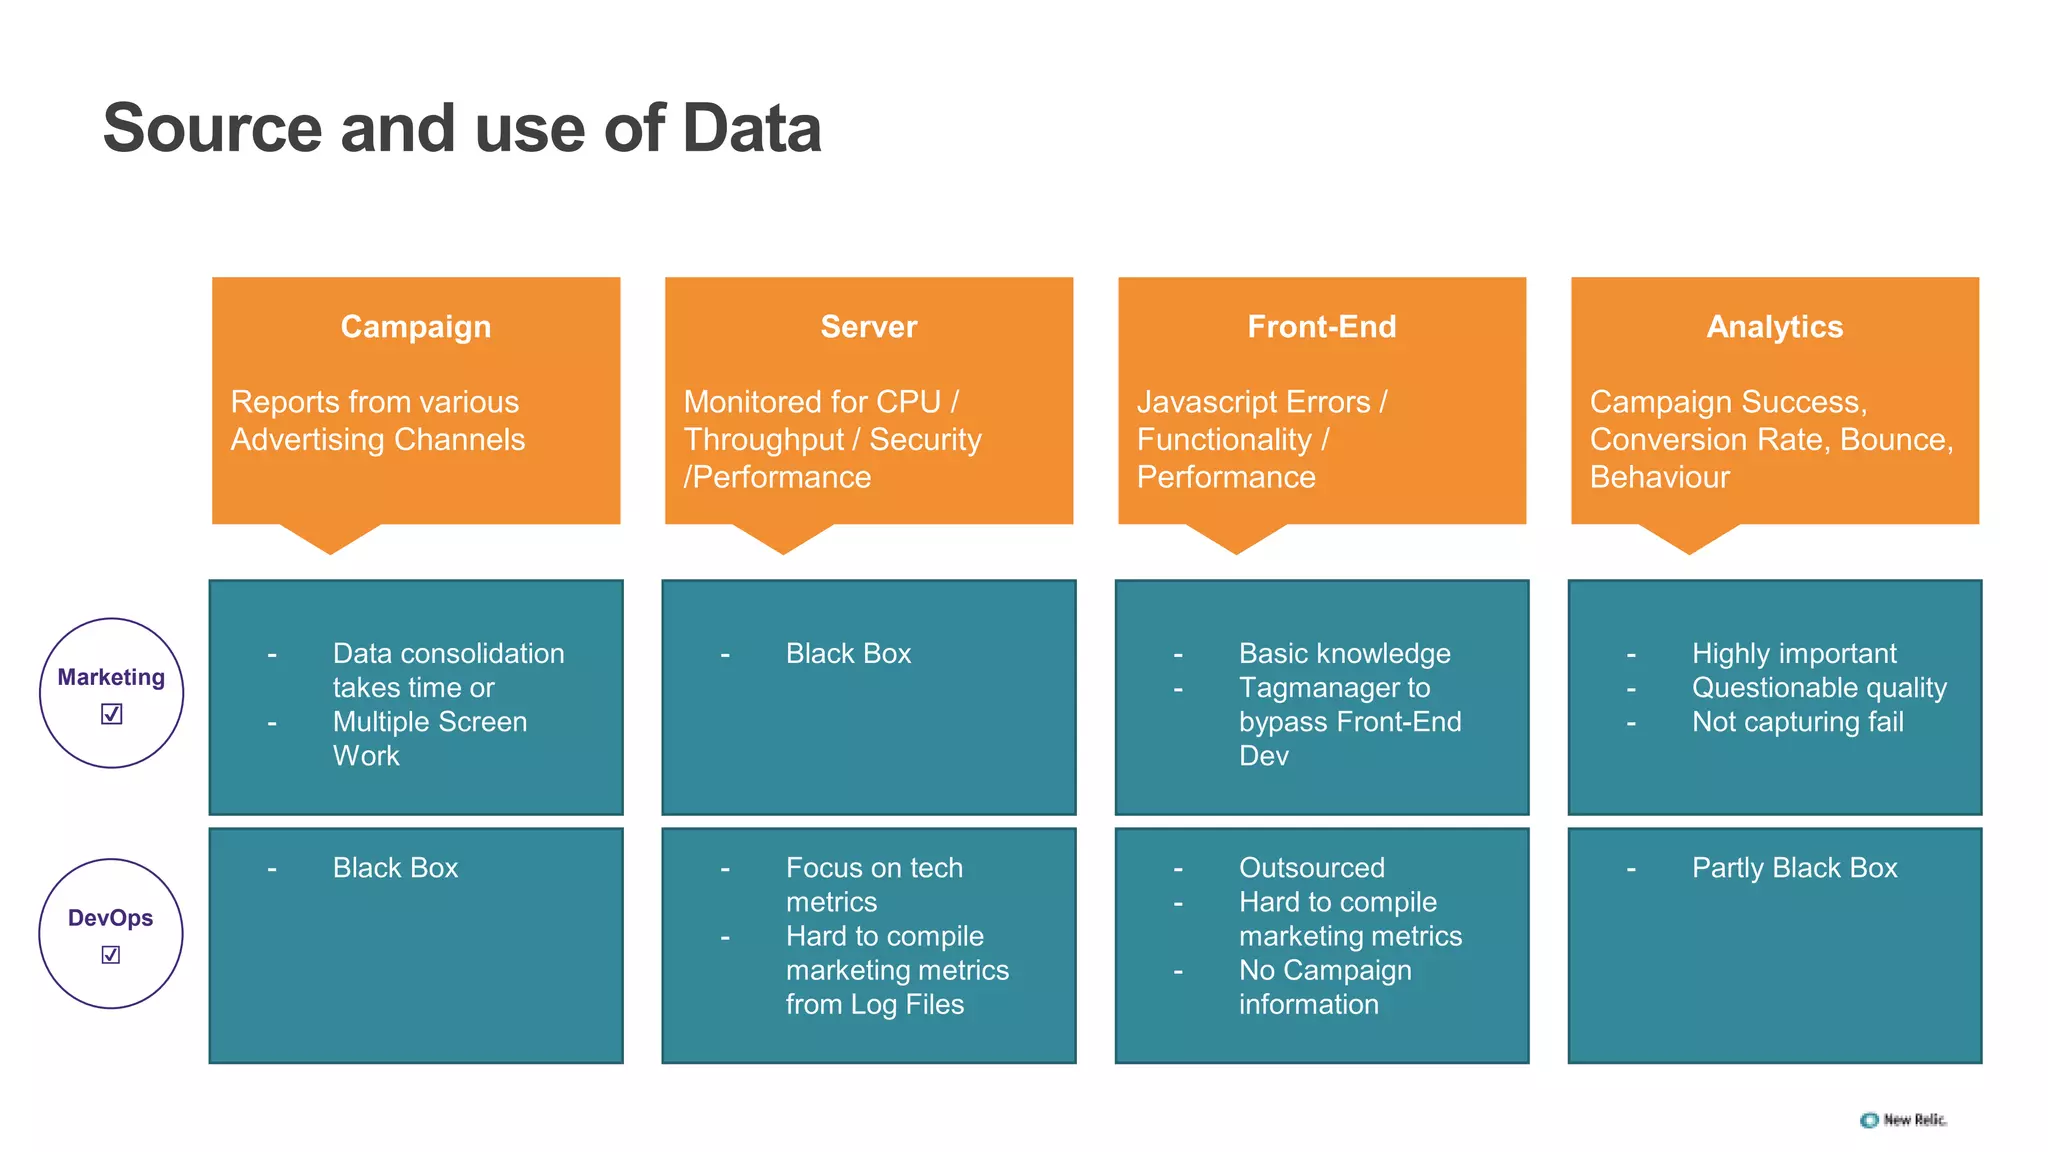
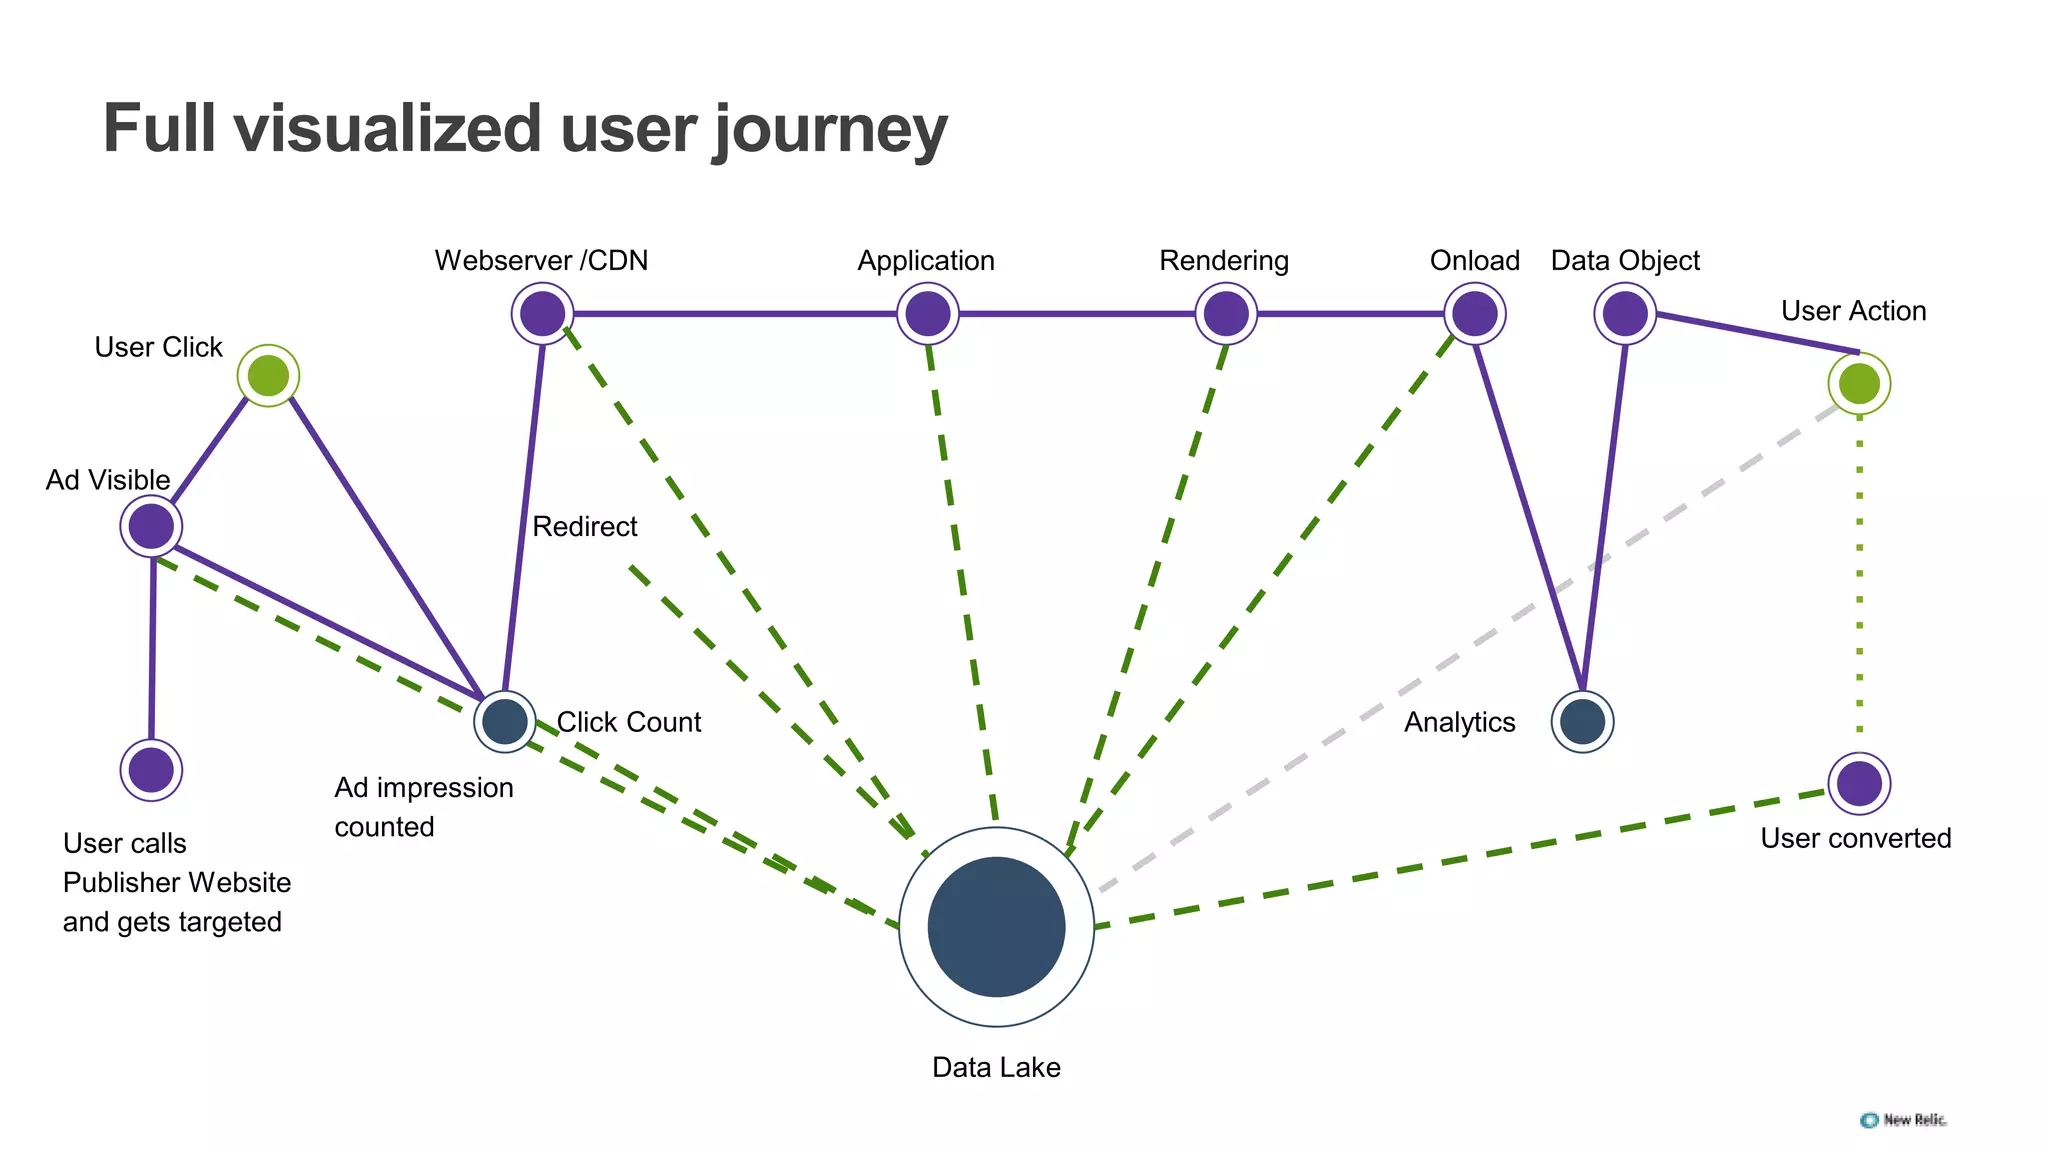
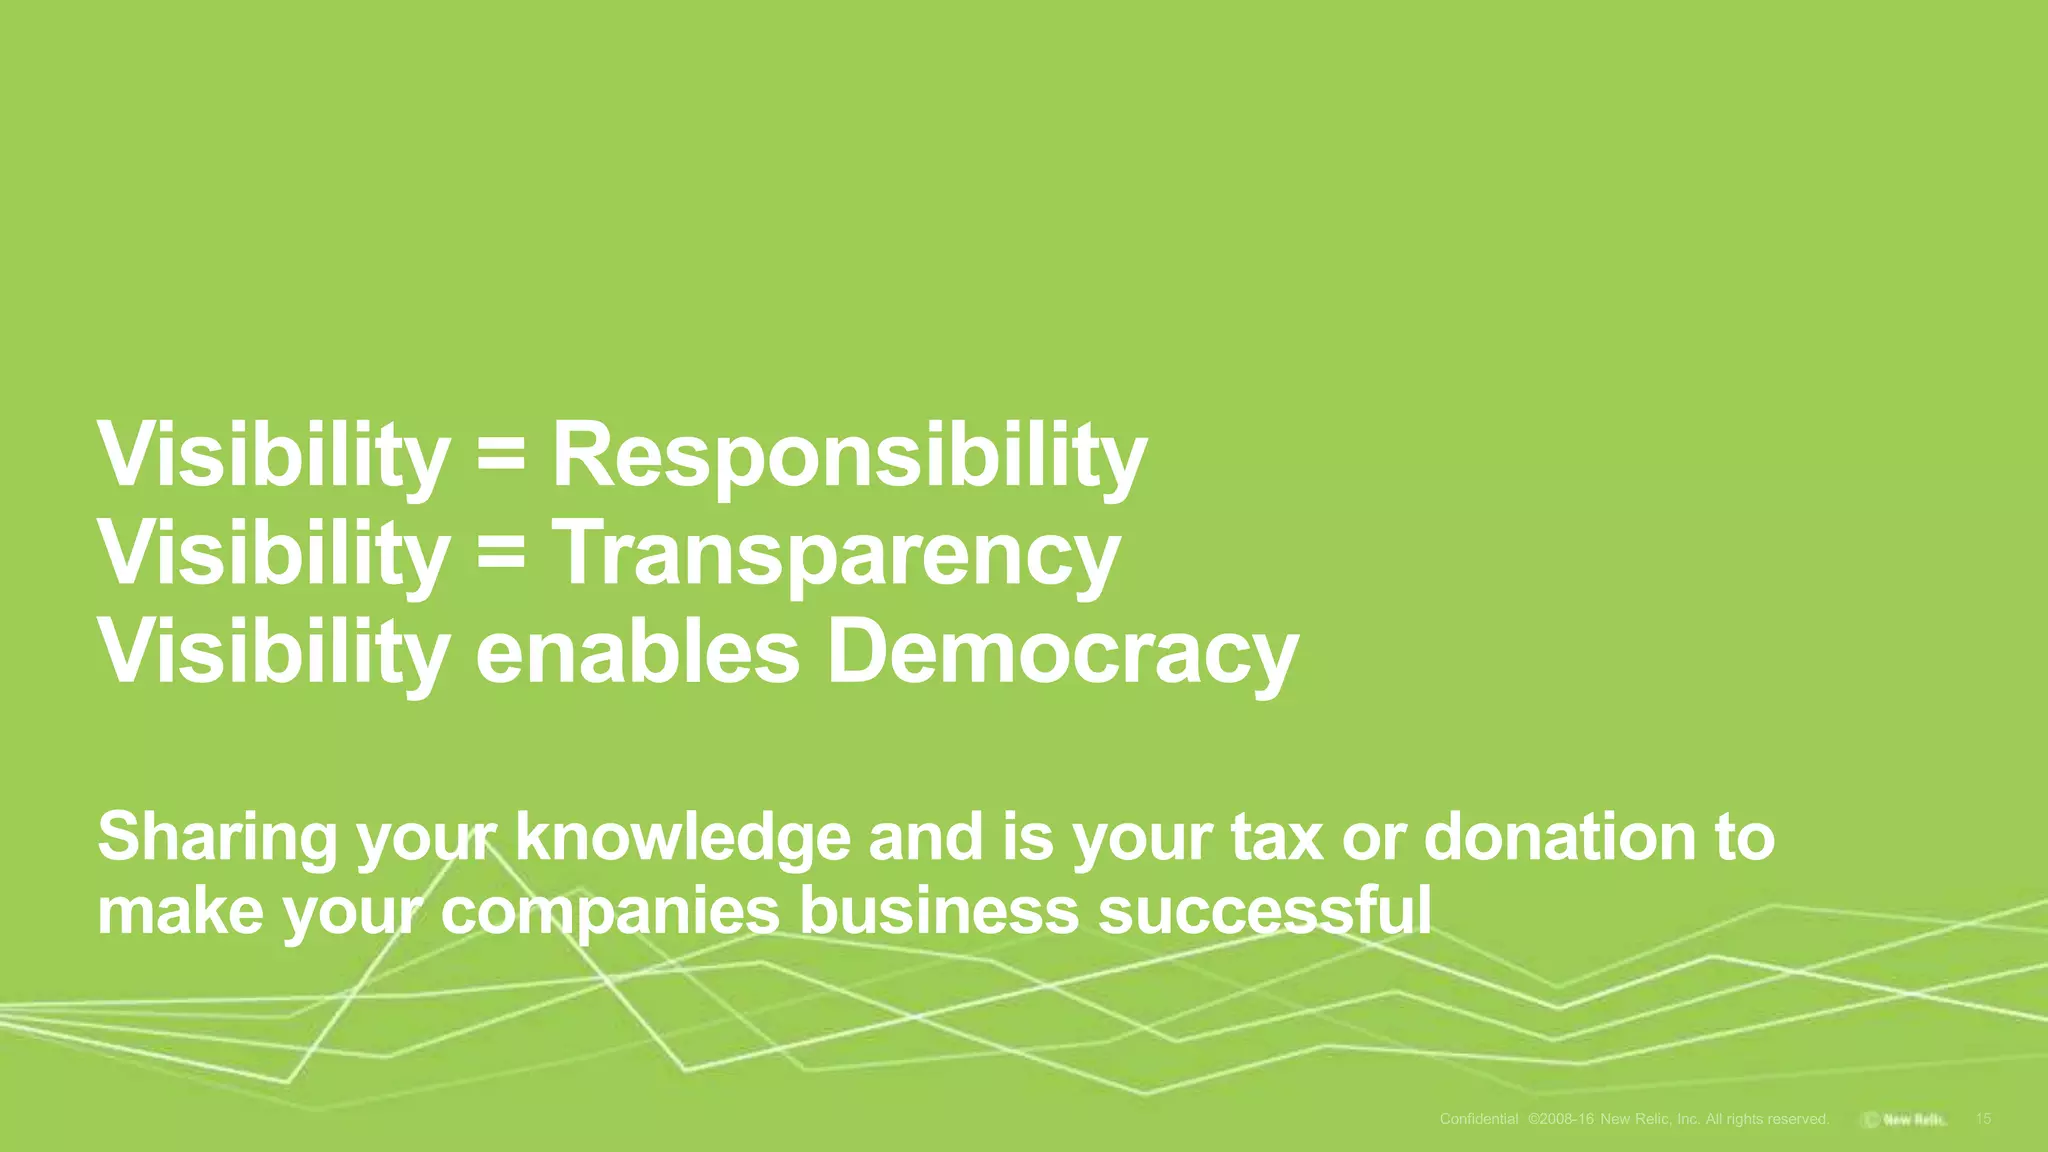
Presenter Name, Title and or Date
Politics of Data
Heiko Specht, hspecht@newrelic.com, @heispe
1
2Confidential ©2008-15 New Relic, Inc. All rights reserved.
Before we start. What’s the Problem
Analytics
3
Data Collection Chain (Web)
User calls
Publisher Website
and gets targeted
Ad impression
counted
User converted
Ad visible
User Click
Click Count
Redirect
Webserver /CDN
Application
Rendering
Page
Onload Data Object
User Action
Advertiser
User “is invisible” chain
User calls
Publisher Website
and gets targeted
Ad impression
counted User converted
Ad Visible
User Click
Click Count
Redirect
Webserver /CDN Application Rendering Onload Data Object
Analytics
User Action
User “is invisible” chain
User calls
Publisher Website
and gets targeted
Ad impression
counted User converted
Ad Visible
User Click
Click Count
Webserver /CDN Application Rendering Onload Data Object
Analytics
User Action
User never reaches the Server
6
Where things can break in your Users Journey
User calls
Publisher Website
and gets targeted
Ad impression
counted
User converted
Ad Visible
User Click
Click Count
Redirect
Webserver /CDN Application Rendering Onload Data Object
Analytics
User Action
Analytics are not built to
capture failures.
Campaign
Reports from various
Advertising Channels
☑
Marketing
- Data consolidation
takes time or
- Multiple Screen
Work
- Black Box
Server
Monitored for CPU /
Throughput / Security
/Performance
- Black Box
- Focus on tech
metrics
- Hard to compile
marketing metrics
from Log Files
Front-End
Javascript Errors /
Functionality /
Performance
- Basic knowledge
- Tagmanager to
bypass Front-End
Dev
- Outsourced
- Hard to compile
marketing metrics
- No Campaign
information
Analytics
Campaign Success,
Conversion Rate, Bounce,
Behaviour
- Highly important
- Questionable quality
- Not capturing fail
- Partly Black Box
Source and use of Data
☑
DevOps
9
DevOps to Data Lake district (Aristocracy to Dictatorship)
Confidential ©2008-15 New Relic, Inc. All rights reserved.
Ops
QADev
before
ELK
Uptrend
s
Nagios
Splunk
Prome-
thius
Busines
s
GA
Icinga
Runscope
Piwik
Optimizely
Adobe
Anarchy
Full visualized user journey
User calls
Publisher Website
and gets targeted
Ad impression
counted User converted
Ad Visible
User Click
Click Count
Redirect
Webserver /CDN Application Rendering Onload Data Object
Analytics
User Action
Data Lake
13Confidential ©2008-15 New Relic, Inc. All rights reserved.
14
Lets get the Analysts in ! They will be the saviors…NOT?
Alternative Facts
Visibility = Responsibility
Visibility = Transparency
Visibility enables Democracy
Sharing your knowledge and is your tax or donation to
make your companies business successful

Politics of Data

  • 1.
    Presenter Name, Titleand or Date Politics of Data Heiko Specht, hspecht@newrelic.com, @heispe 1
  • 2.
    2Confidential ©2008-15 NewRelic, Inc. All rights reserved. Before we start. What’s the Problem
  • 3.
    Analytics 3 Data Collection Chain(Web) User calls Publisher Website and gets targeted Ad impression counted User converted Ad visible User Click Click Count Redirect Webserver /CDN Application Rendering Page Onload Data Object User Action Advertiser
  • 4.
    User “is invisible”chain User calls Publisher Website and gets targeted Ad impression counted User converted Ad Visible User Click Click Count Redirect Webserver /CDN Application Rendering Onload Data Object Analytics User Action
  • 5.
    User “is invisible”chain User calls Publisher Website and gets targeted Ad impression counted User converted Ad Visible User Click Click Count Webserver /CDN Application Rendering Onload Data Object Analytics User Action User never reaches the Server
  • 6.
    6 Where things canbreak in your Users Journey User calls Publisher Website and gets targeted Ad impression counted User converted Ad Visible User Click Click Count Redirect Webserver /CDN Application Rendering Onload Data Object Analytics User Action
  • 7.
    Analytics are notbuilt to capture failures.
  • 8.
    Campaign Reports from various AdvertisingChannels ☑ Marketing - Data consolidation takes time or - Multiple Screen Work - Black Box Server Monitored for CPU / Throughput / Security /Performance - Black Box - Focus on tech metrics - Hard to compile marketing metrics from Log Files Front-End Javascript Errors / Functionality / Performance - Basic knowledge - Tagmanager to bypass Front-End Dev - Outsourced - Hard to compile marketing metrics - No Campaign information Analytics Campaign Success, Conversion Rate, Bounce, Behaviour - Highly important - Questionable quality - Not capturing fail - Partly Black Box Source and use of Data ☑ DevOps
  • 9.
    9 DevOps to DataLake district (Aristocracy to Dictatorship) Confidential ©2008-15 New Relic, Inc. All rights reserved. Ops QADev before ELK Uptrend s Nagios Splunk Prome- thius Busines s GA Icinga Runscope Piwik Optimizely Adobe
  • 10.
  • 12.
    Full visualized userjourney User calls Publisher Website and gets targeted Ad impression counted User converted Ad Visible User Click Click Count Redirect Webserver /CDN Application Rendering Onload Data Object Analytics User Action Data Lake
  • 13.
    13Confidential ©2008-15 NewRelic, Inc. All rights reserved.
  • 14.
    14 Lets get theAnalysts in ! They will be the saviors…NOT? Alternative Facts
  • 15.
    Visibility = Responsibility Visibility= Transparency Visibility enables Democracy Sharing your knowledge and is your tax or donation to make your companies business successful

Editor's Notes

  • #4 In a perfect world everything runs fine. From the prospect customers first visual showing your brand – pushed by your marketing devision – the click on the ad counted by your advertising agency – the generation of the response from your Applications and infrastructure – down to perfect and timely rendering of the response in the device of your visitor and the recognition of the campaign click and visit in your analytics. Recognitions that make you steer your efforts to drive more users and more revenue.
  • #5 Unfortunately nowadays a freaky lot of things can happen to make exactly that click recognizable. First and most issue here is a slow load time of the user who might become active on your page before the analytics have captured him. There are a lot of more reasons within your companies control and reason outside of your control why analytics does not tell you the truth. I find this blog post interesting: https://www.crazyegg.com/blog/why-is-google-analytics-inaccurate/
  • #6 Aside of not seeing users because of analytics not working or loading the users might never reach the landing page for various other reasons – either the adverting agency’s redirect to your web is not working or the link entered as a landing page for a campaign ends in the nirvana. These two issues are very often seen and could be influenced (either the IT creates a redirect for faulty requests, either you get in touch with the agency to enhance the campaign on their cost or you correct the link in the interface your agency is providing to you. Overall – it is important that you are AWARE of an issue, that you know the impact of the issue.
  • #7 Honestly – everywhere in the journey from “first touch” down to the conversion of a user – things can go wrong – and will go wrong. The questions are: Who is aware? When is he aware? What is the workflow to fix/act? What is the impact? What should be handled with priority?
  • #8 If a campain is not reaching your Servers, if a page is not getting rendered, if your application is not working, if your page is not functioning (i. e. JS errors), if your users decided to block tracking.... Analytics will not tell you about the user. The visitor simply does not exist in the analytics. Even worse: the user might complain about the things that went wrong. They will blame you for a faulty linked Ad, they will tweet about bad experience and not functioning digital feedback.
  • #9 First key is to understand who is responsible for what kind of data currently. I clustered them into 2 groups: 1.) Marketing (driving traffic and analysing traffic) 2.) DevOps (creating applications / feature and run these apps and features) Both focus on their core interest and measure exactly that – they do finger pointing to the other group if things break (some trashy thing put into the tagmanager, or Applications not standing the traffic produced).
  • #10 Instead of learning from the past enterprises today tend to work in silos. These silos differ a lot from the “pre” Devops areas. To accomplish creating, testing and running code and infrastructure IT teams work with a wide range of various tools. Same is true for Marketing. While the Toolset in IT is more team depending the selection of tools in more marketing depending on topics (like Channels). Currently everyone sits on the data and keeps that data set as a vault or treasure. They are dictators of their data and do a lot to keep all the power over data. Team leaders tend to follow the modern trend letting the teams the freedom to select what they want to use.
  • #11 The teams become dictators of their data – the company ends in a data anarchy with a manifested shadow IT (i. e. using tools not compliant with company policy or marketeers using tools to bypass dictators in the IT. This is not an idea invented by me but more a long known fact and there is some cool lecture about this topic available online: https://timoelliott.com/blog/2014/05/data-democracy-vs-data-anarchy.html https://www.marketingmag.com.au/hubs-c/opinion-rollo-shadow-it/
  • #12 It will be hard for every enterprise to overcome the obstacle of having teams sitting on their treasure and resist to make it accessible for others or to change to a compliant tool that is so very helpful for what one is doing with a very low impact on the companies goal. This neet feature that is sooo helpful. It turned out that looking into the data what nice things are captured that might be helpful to others initates a cultural change. It is expected by the new generation of CIOs who work towards business and expect their DevOps becoming BizDevOps. https://www.kienbaum.com/de/blog/gespraech-mit-klaus-straub-cio-der-bmw-group-teil-1 (for english natives - use the google translate feature) https://translate.google.de/translate?sl=de&tl=en&js=y&prev=_t&hl=de&ie=UTF-8&u=https%3A%2F%2Fwww.kienbaum.com%2Fde%2Fblog%2Fgespraech-mit-klaus-straub-cio-der-bmw-group-teil-1&edit-text= At the end of the day – you have the choice to hood your treasure like the Gollum or if you are willing to volunteer.
  • #13 To shift to a data democracy it is important to have all sources data available – not necessarily in a BIG DATA storage (while this is helpful). The shift from having a lake district to a single data lake (formerly: single source of truth) is helpful because of various reasons: You might not know yet what you need to ask the data present You can put things in context you have not been able to do before You can see what is there coming from other teams You can identify overlaps and maybe reduce the amount of tools used to capture data The only option to visualize a complete user journey. But there are also risk you should not underestimate with regards to creating/having a huge lake
  • #14 https://en.wikipedia.org/wiki/Data_lake “We see customers creating big data graveyards, dumping everything into HDFS [Hadoop Distributed File System] and hoping to do something with it down the road. But then they just lose track of what’s there. The main challenge is not creating a data lake, but taking advantage of the opportunities it presents.” Hope is coming with the data scientists and analytics specialists letting run throught the data and making sense of it. The flipside of using specialist: Lack of understanding what the data means (6 or 7 metrics for “response time”)? They do not understand how the data is created? Having specialists working on the data – and not users of the data is a risk. But the pain is also: Users might not have the technical depth of knowledge to query the data to get sense and value out of it for their role Risk to fall back into an Aristocracy Workload on the system is underestimated (imagine every user / role contributing to the business success is querying data and create Dashboards and reports) – this can easily cost a freaky lot of cost. https://ovaledge.com/challenges-data-lake/
  • #15 There are a lot of risks using a data lake described here: https://sonra.io/2017/08/08/are-data-lakes-fake-news/ One underestimated risk is to let leave the modulation / integration into the hands of “specialists” only. With that you implement additional bottlenecks. Data structures might change, Data formats might change, Additional data might appear depending the version of the data collector. Timezone adjustments etc etc… Wrong interpreted data can cause dramatic effects: You will lie - by will (because of distrust in the data base) or by missing understanding You will interpret hard (but unsupportive) facts as fake news You will do wrong business decisions You need to find an excuse when things go down the drain.
  • #16 A real democracy depends on volunteering as well – sharing your knowledge is the „tax“ you pay to enjoy the greater goods. The same is true for your data lake. You need to be open to share your data with others. It might be the case that others find some valuable information in your vault. Coming back to the point from Slide 3: Check if your advertising company has an API for sellers (i. e. Adform: https://api.adform.com/v1/help/seller) that reports the amount of clicks on certain ad campaign. (same could be done with other channels like twitter, facebook, youtube, google...) Correlate the amount of clicks with those containing the campaign ID from your web-servers (if you use New Relic – enable request.parameter.utm_campaign) -> You can correlate if the there are differences which would hint you if there are issues with the redirect or with the url implemented in the campaign -> You will see even those who clicked by accident or have „noTrack“ on. -> 100% in real time If you have the device in monitoring and contribute to the data lake you will be able to determine if issues on the page block analytics or cause issues And finally you can include the analytics to make a distinction of things like first touch, returing visitor etc. With making your data accessible and visible for others they will most likely understand your personal KPIs better and will be able to put them into the context of the broader company goal.