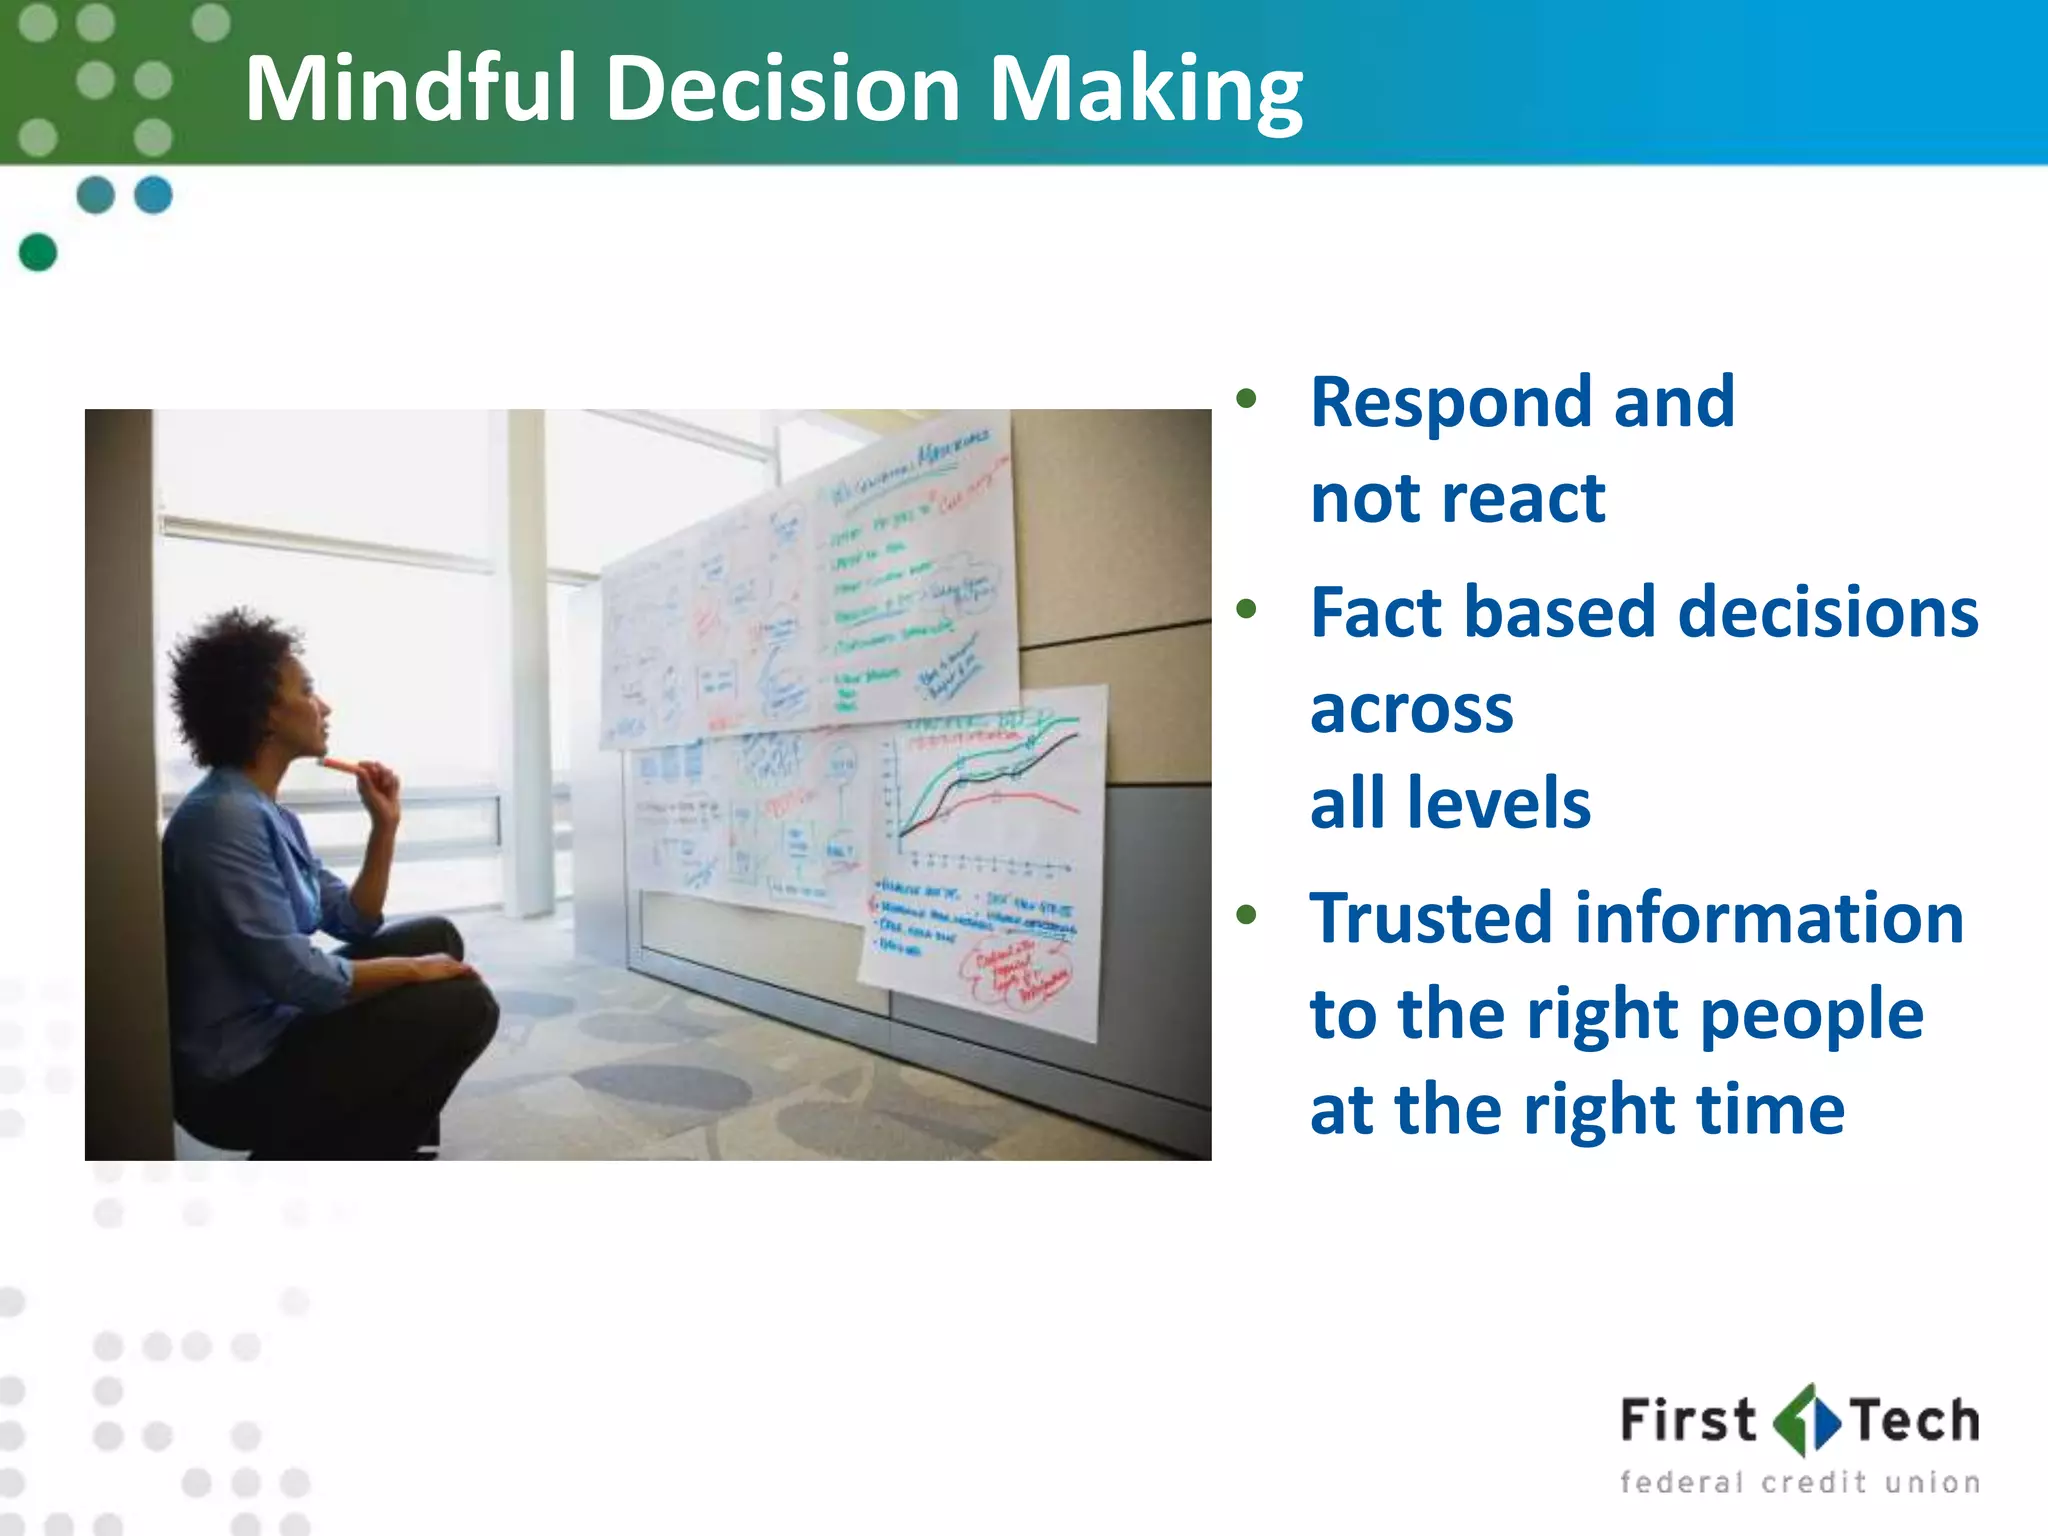
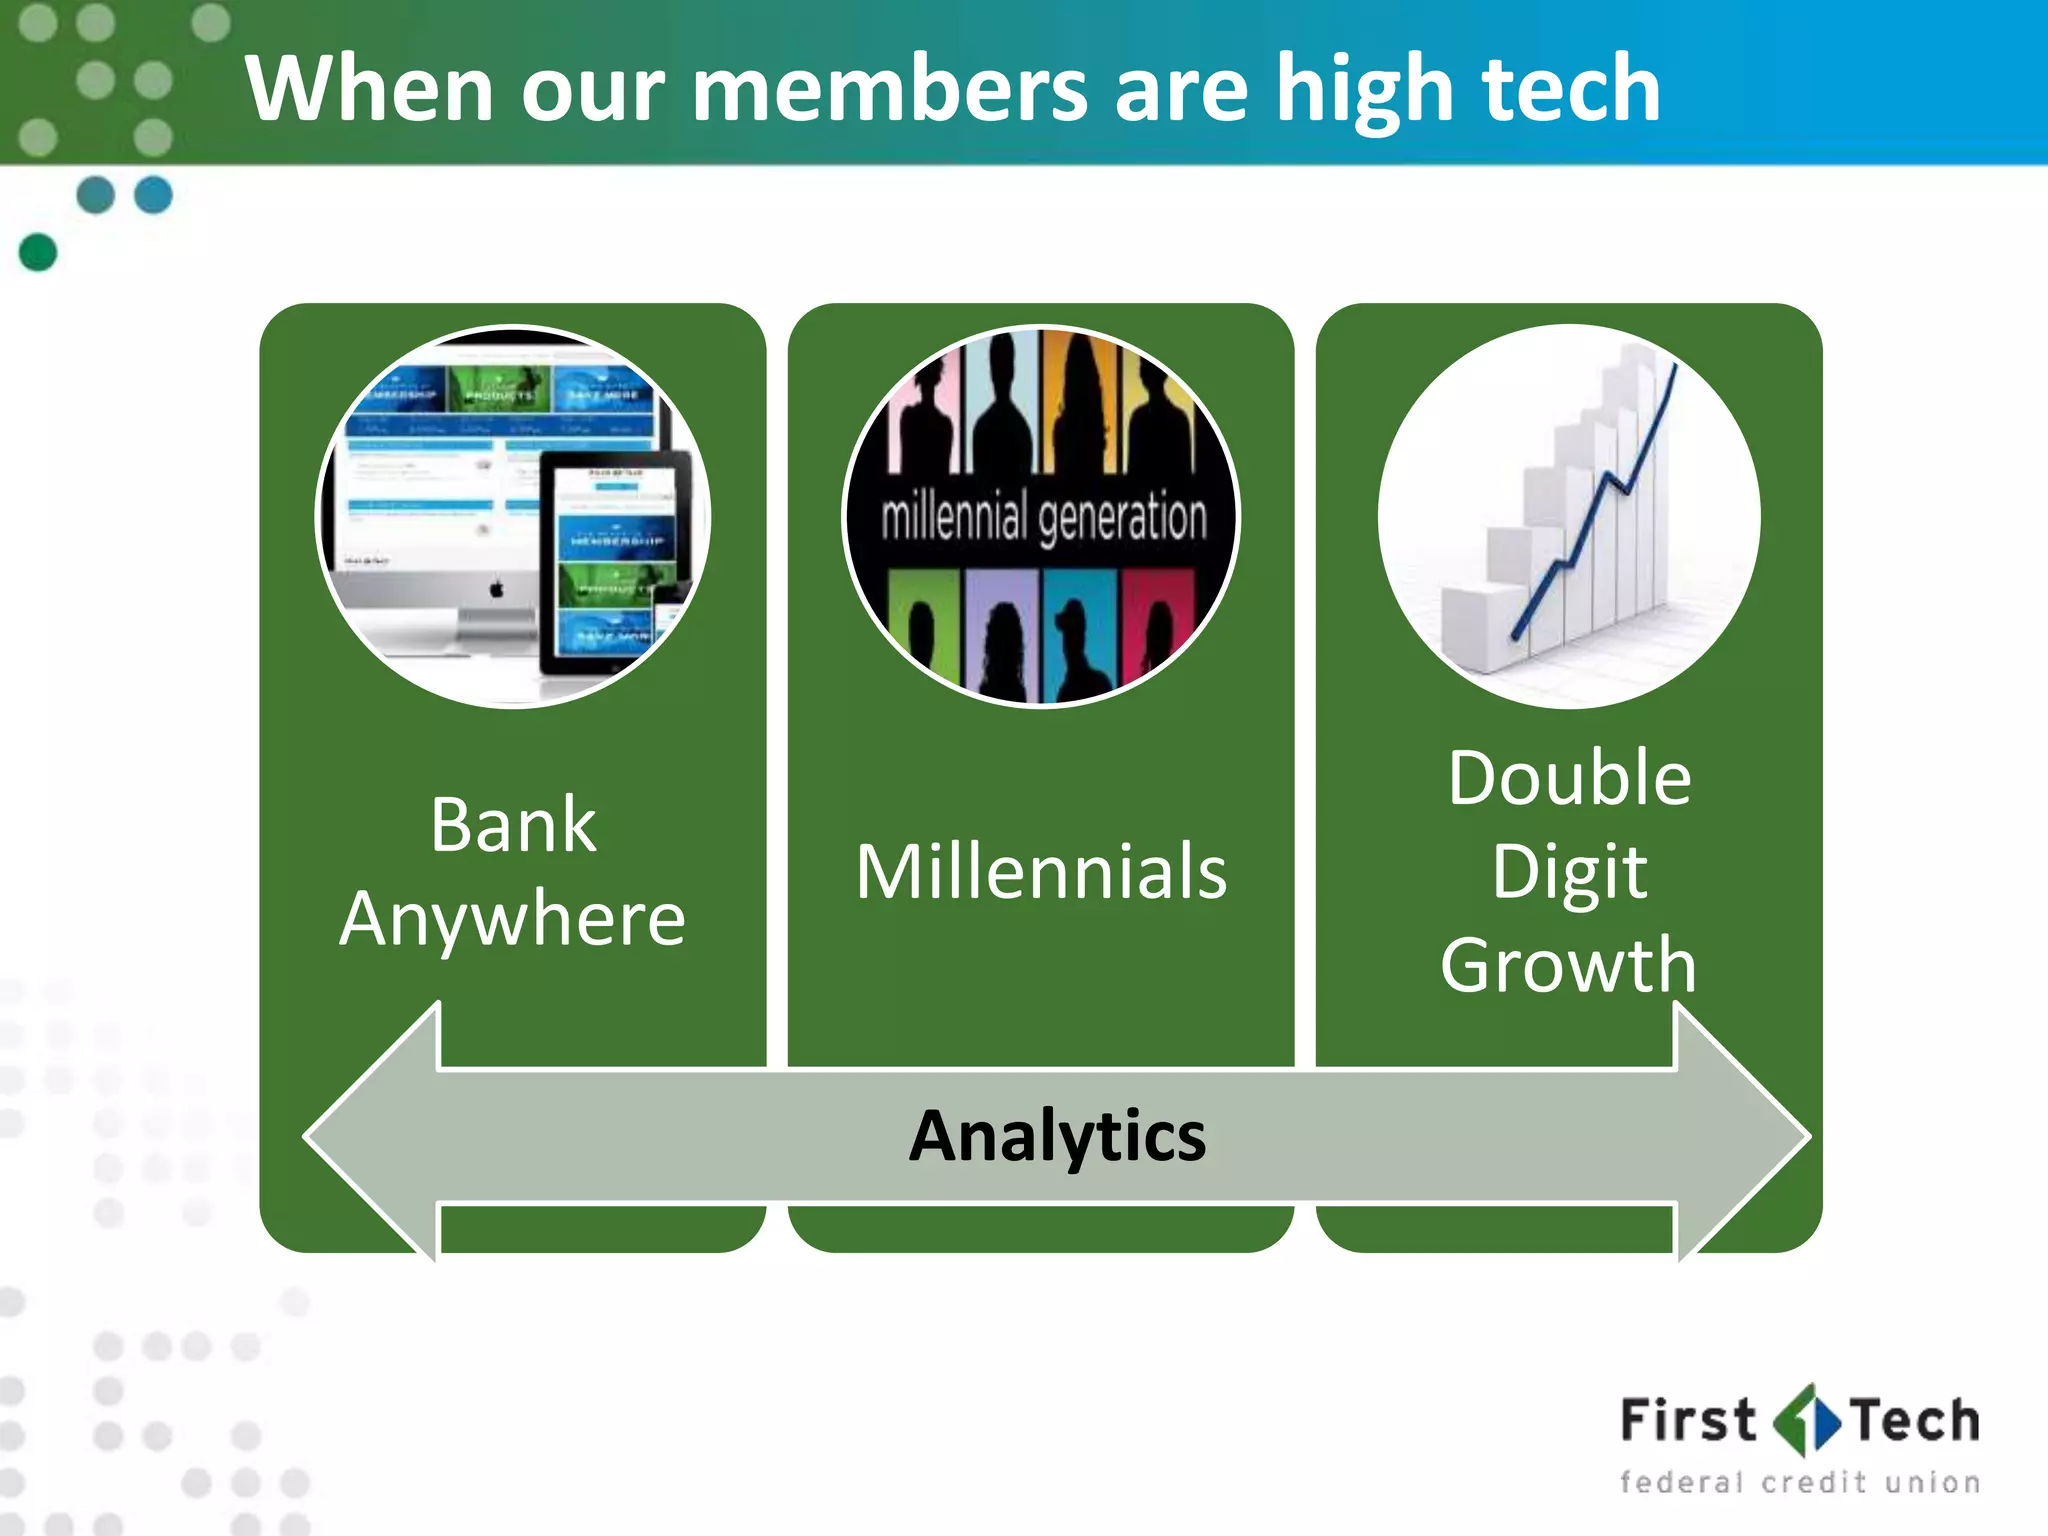
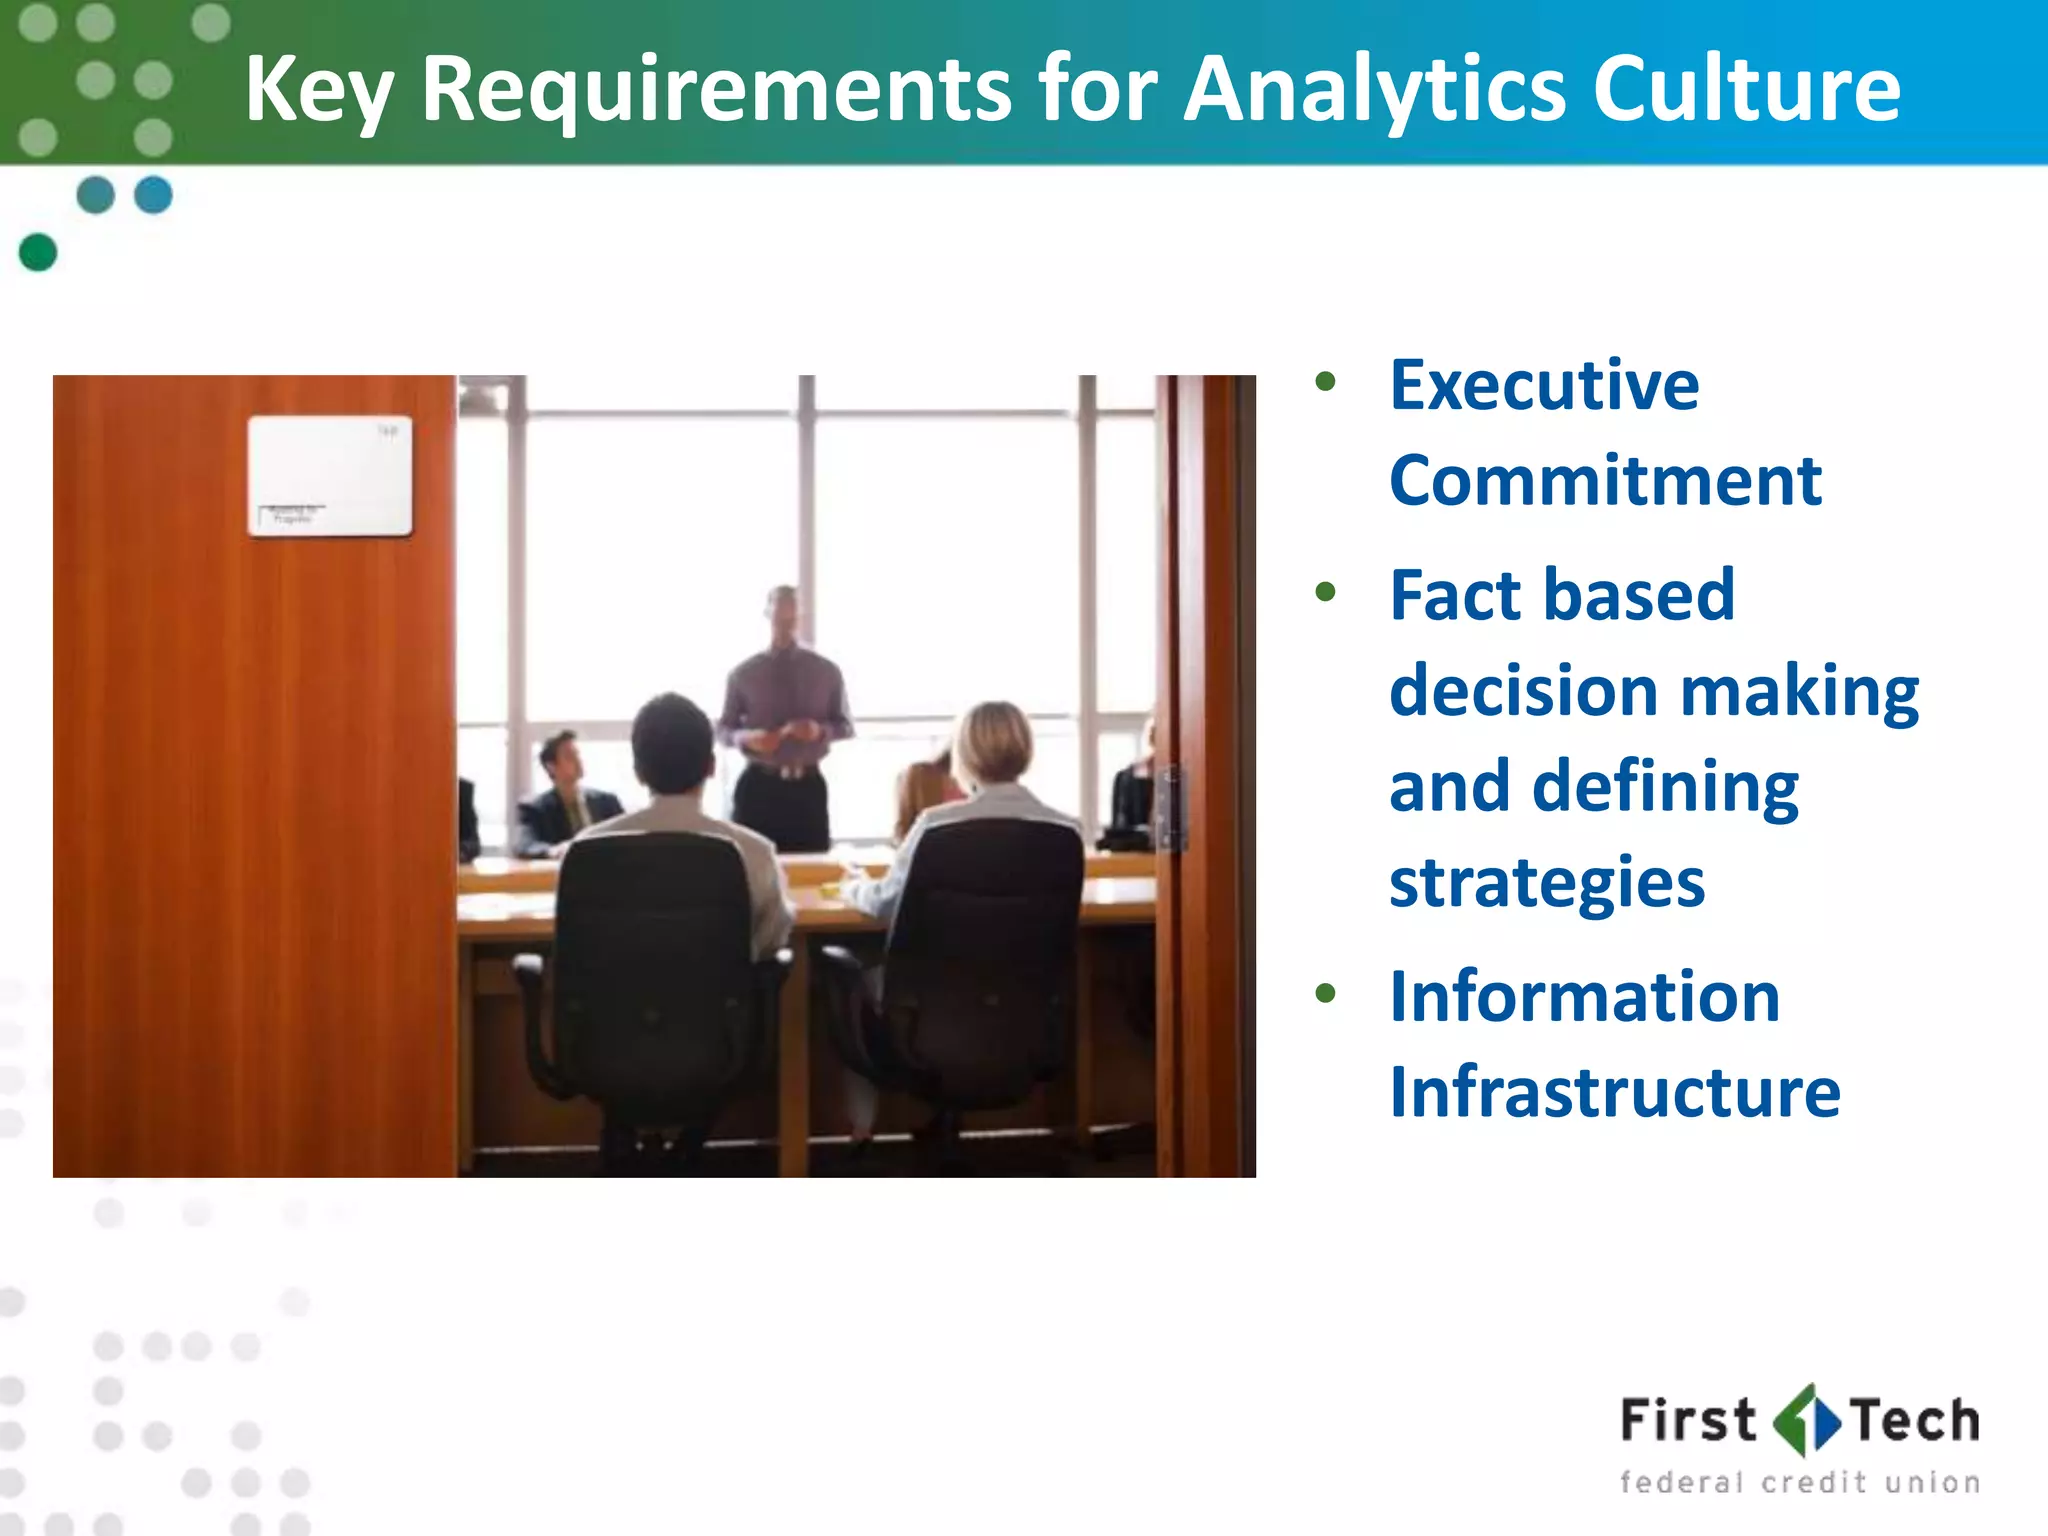
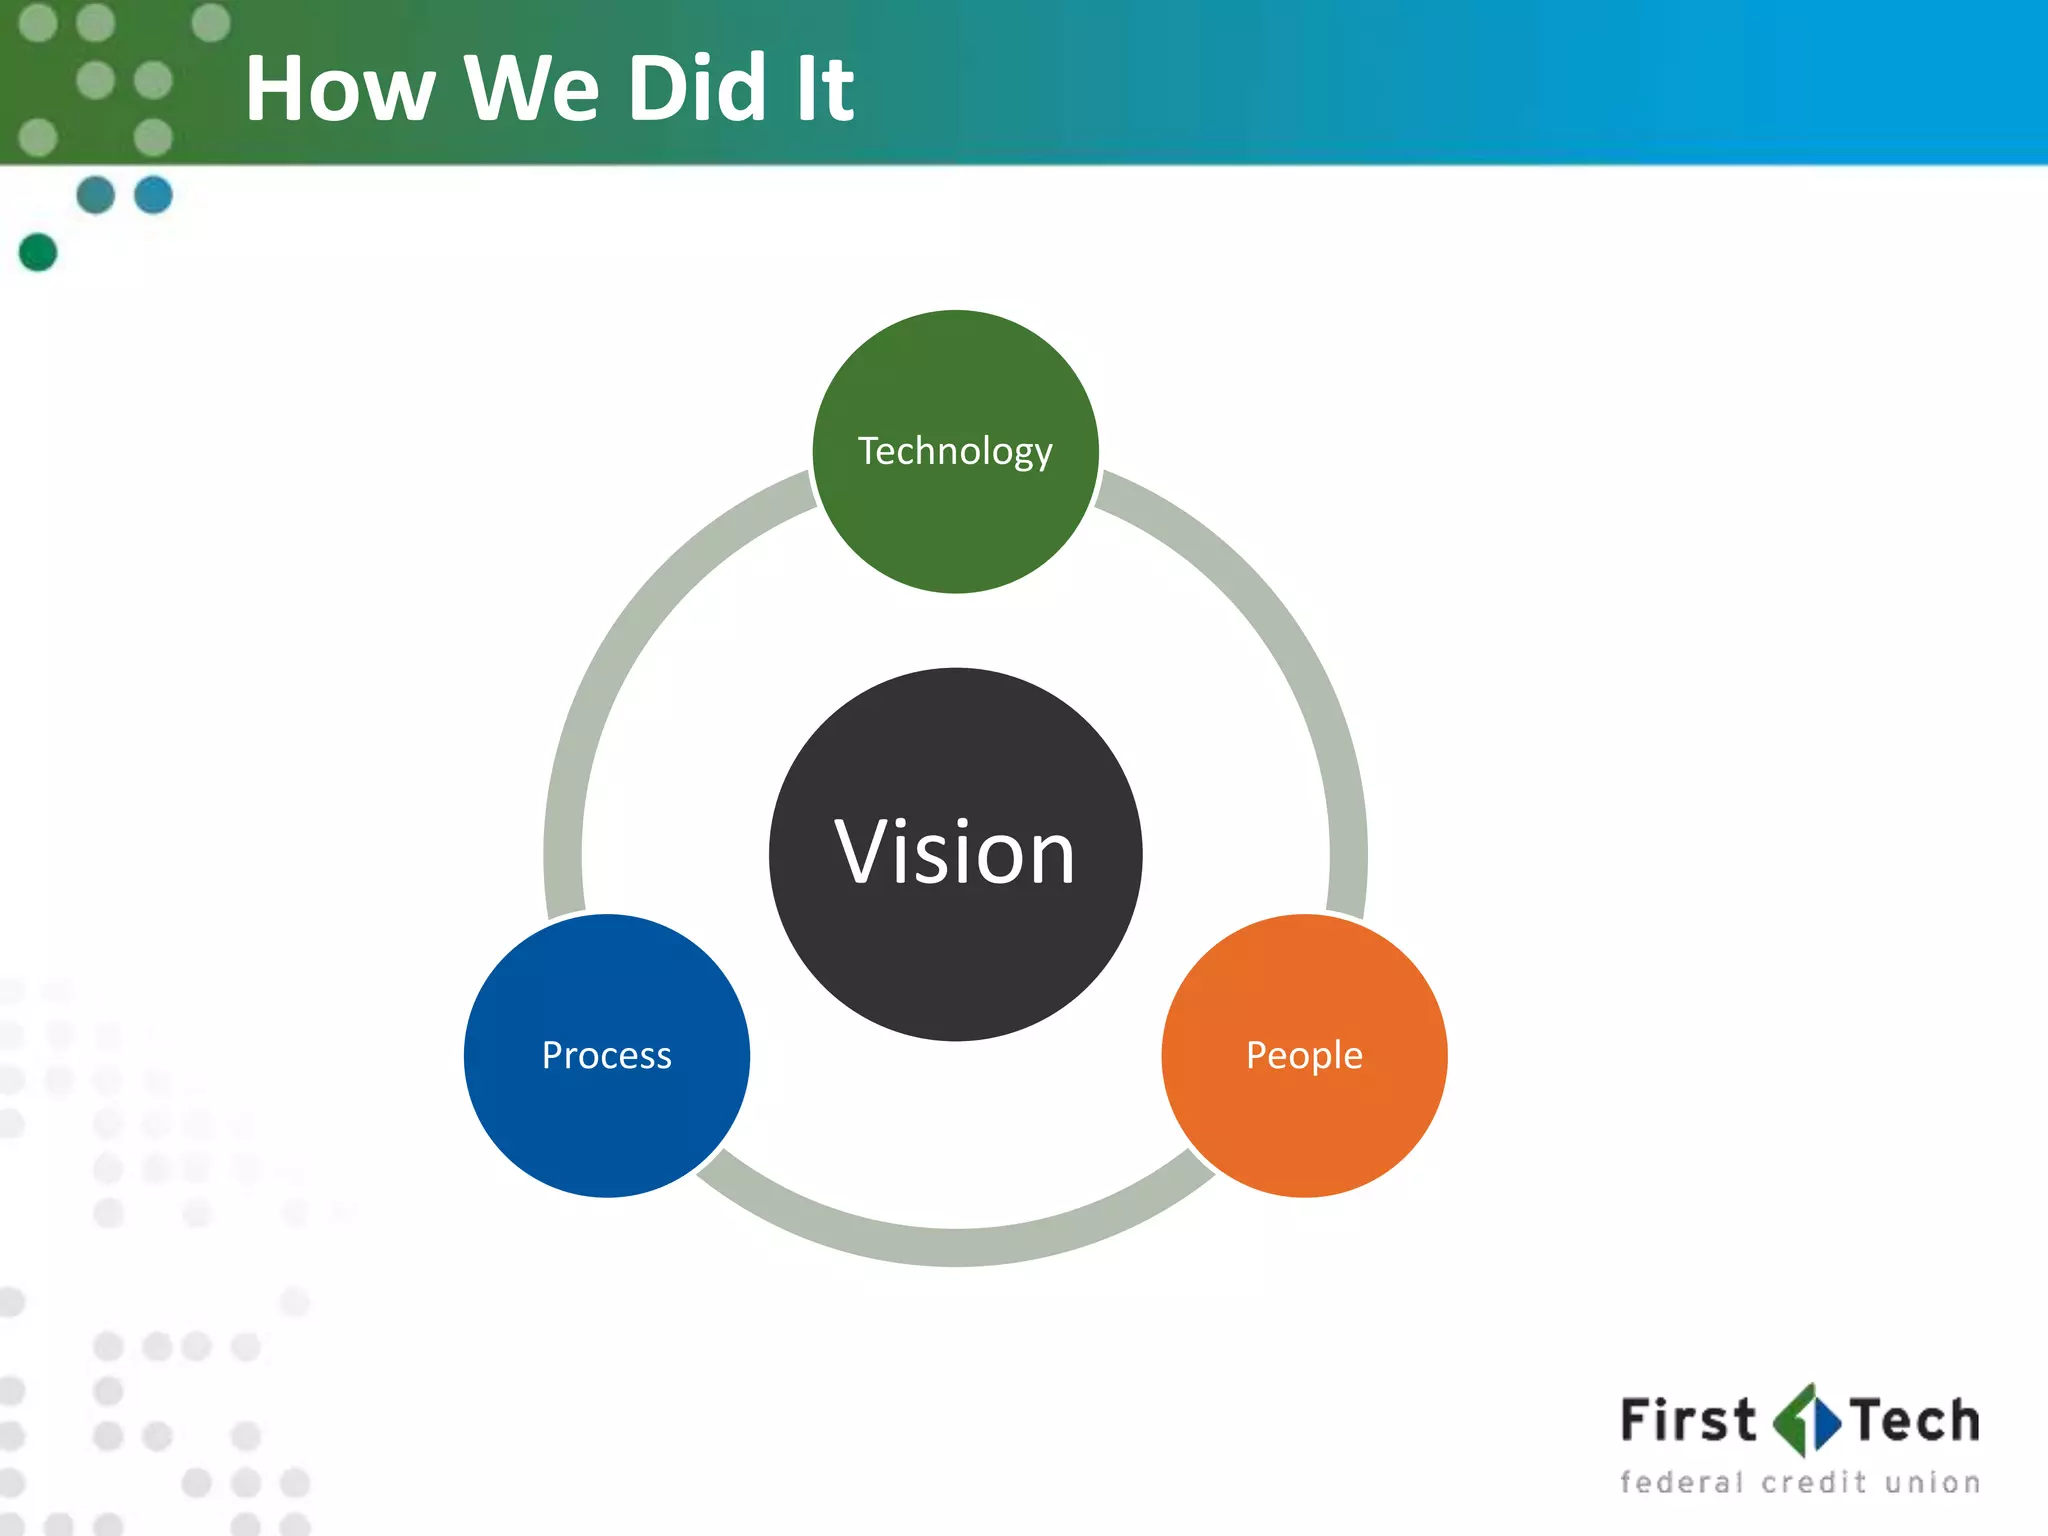
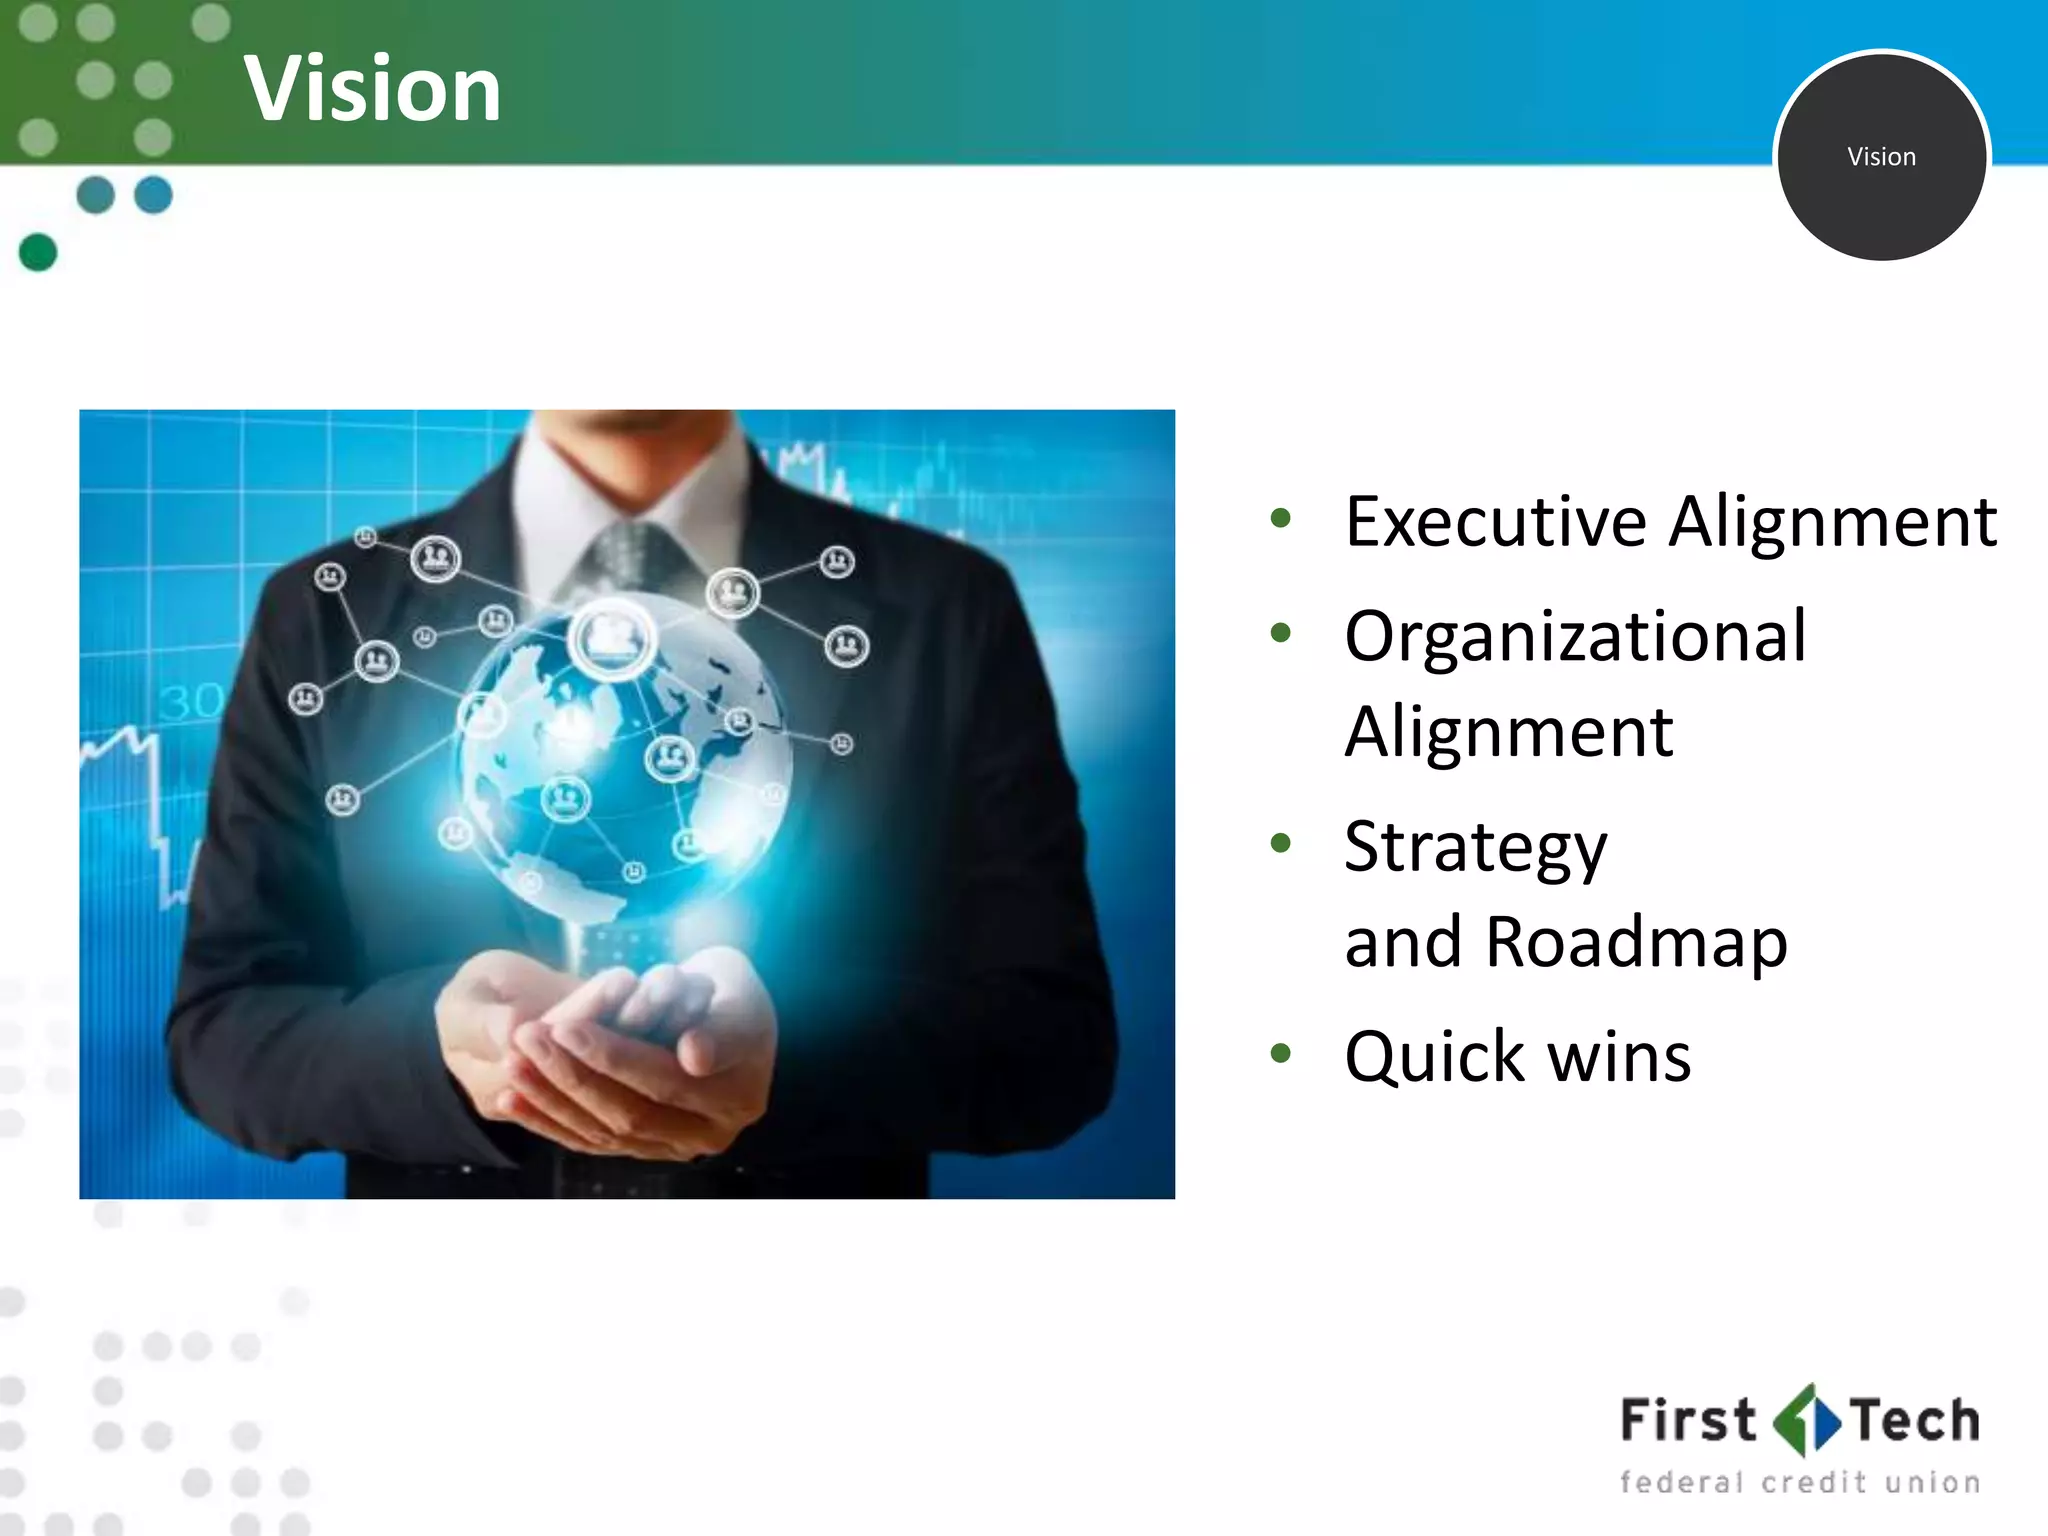
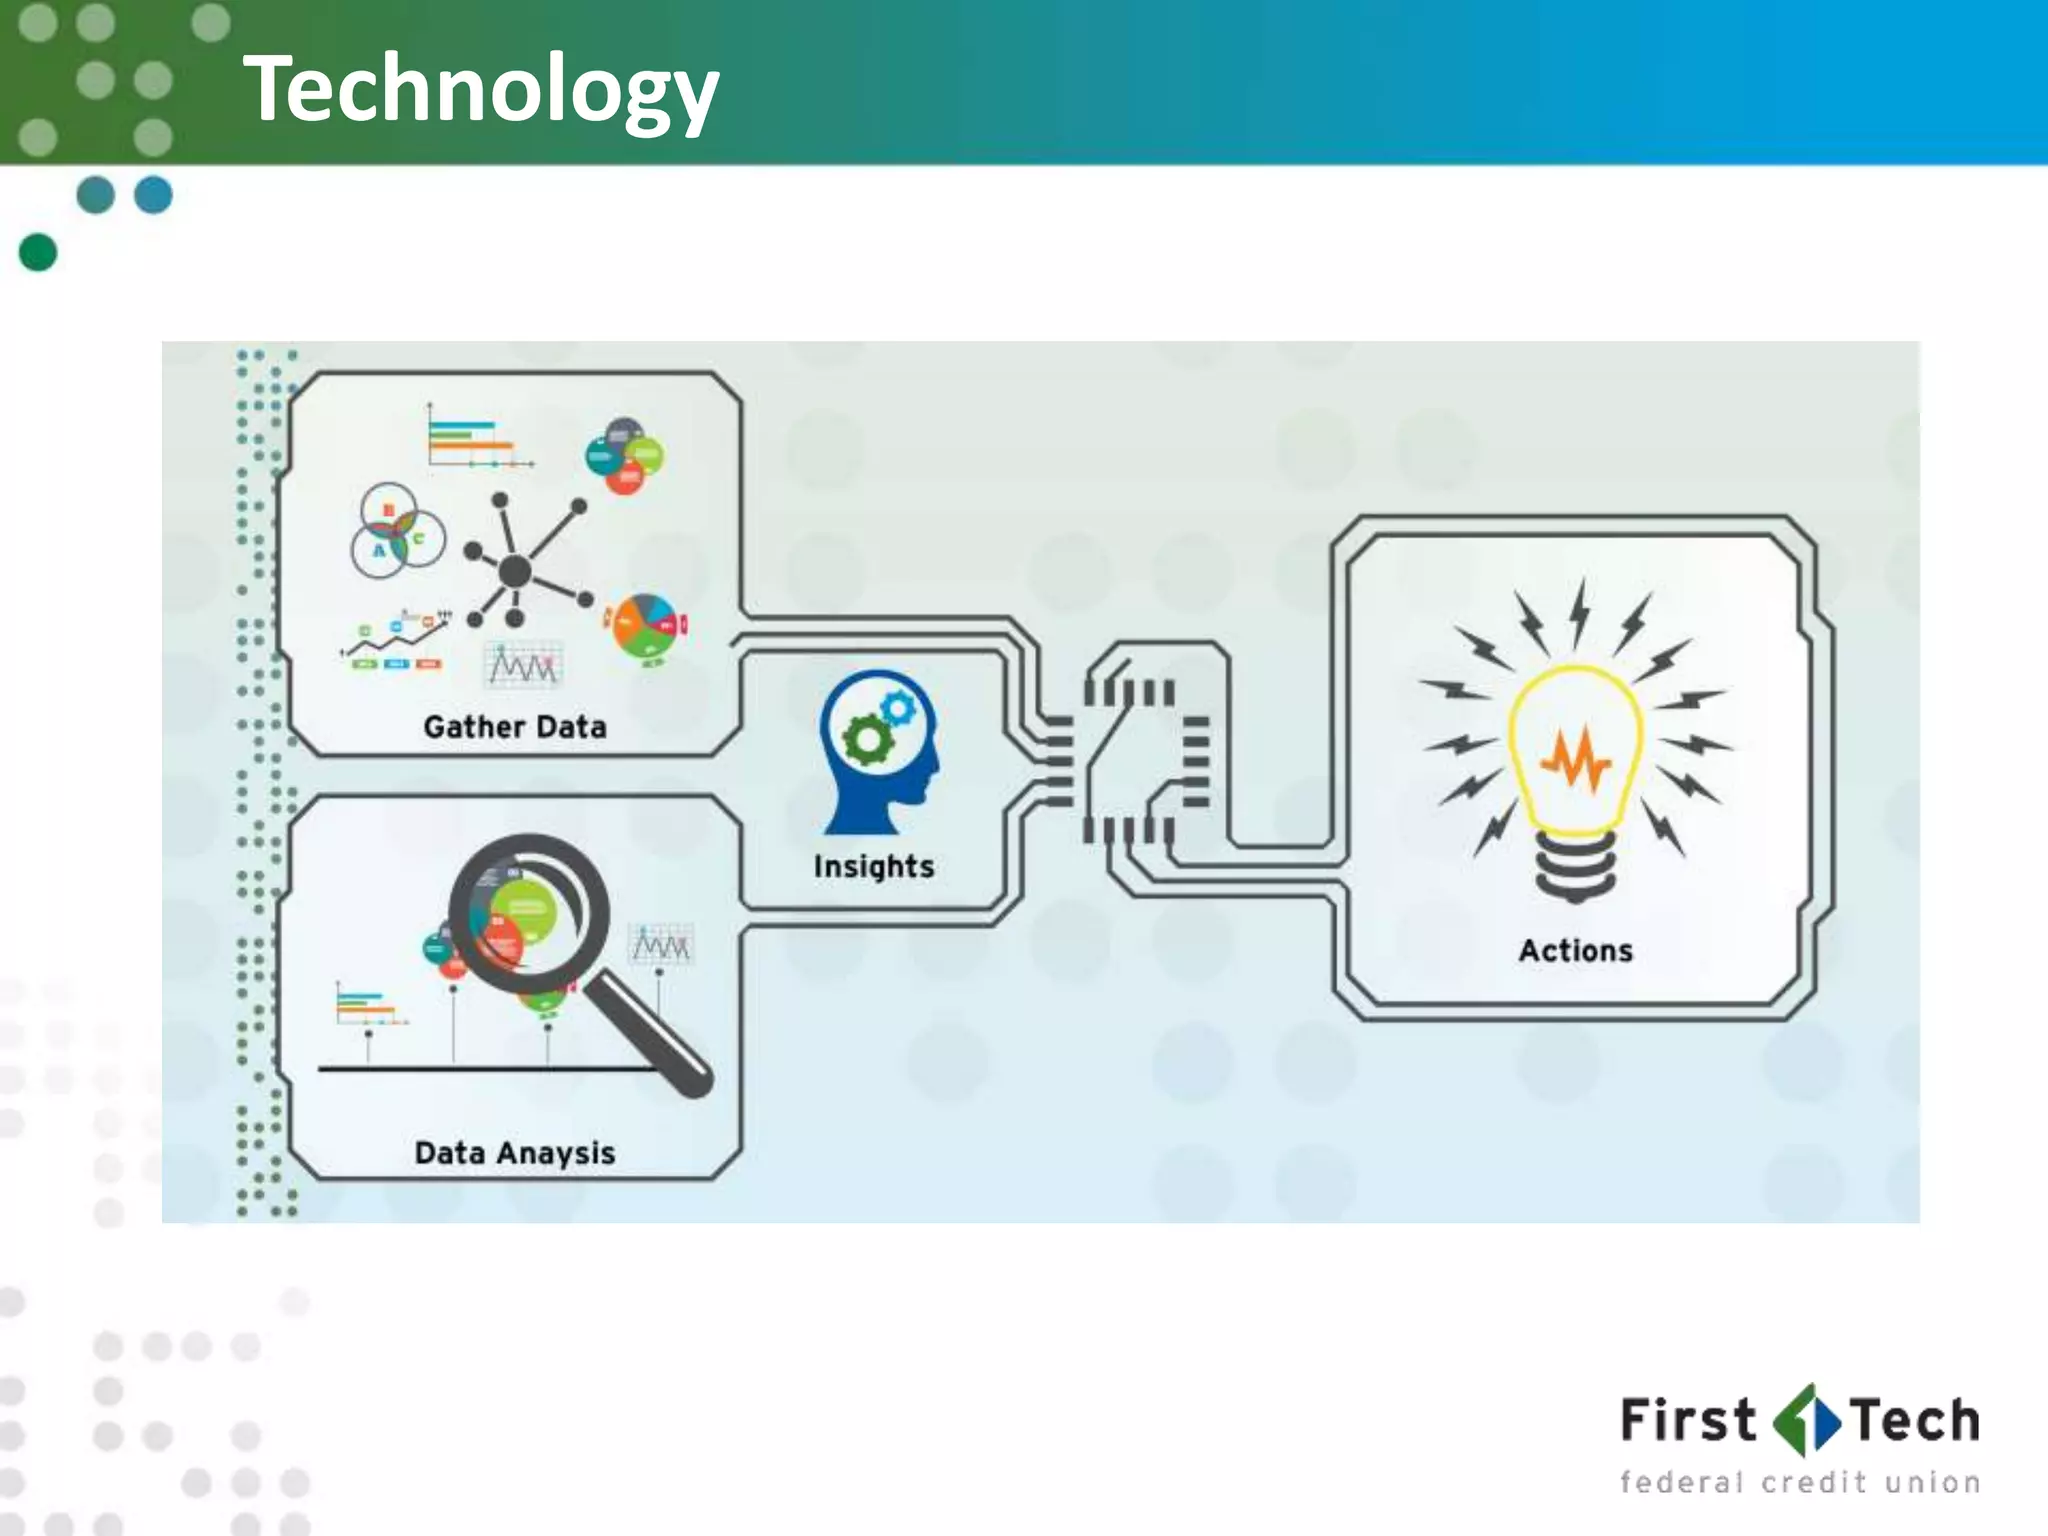
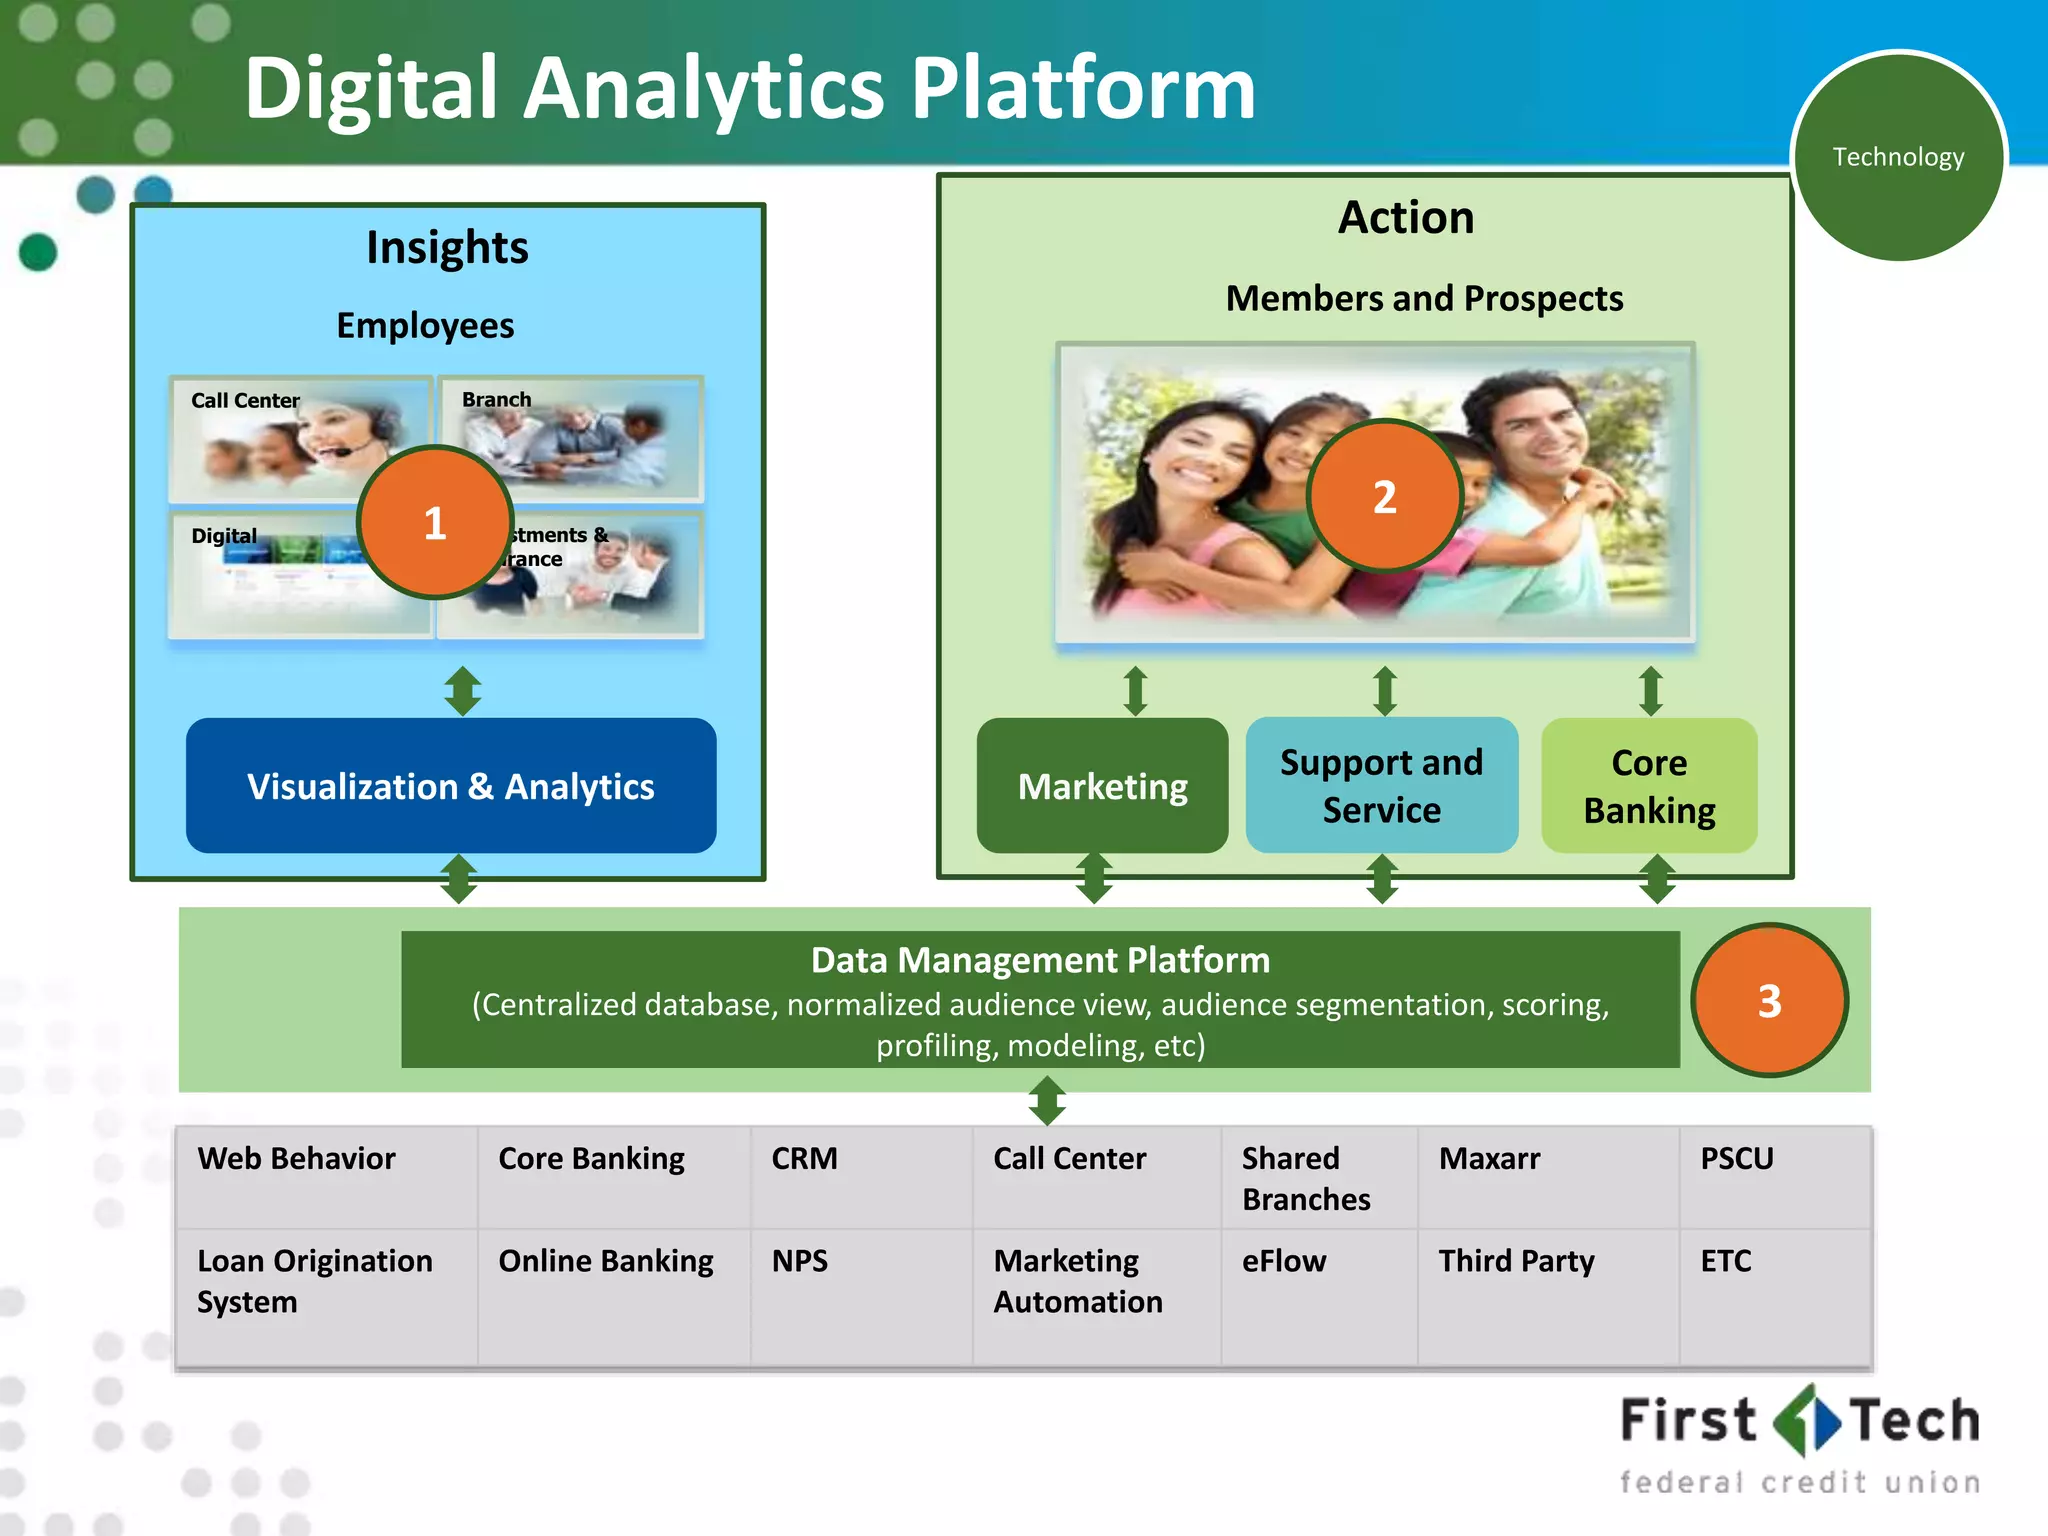
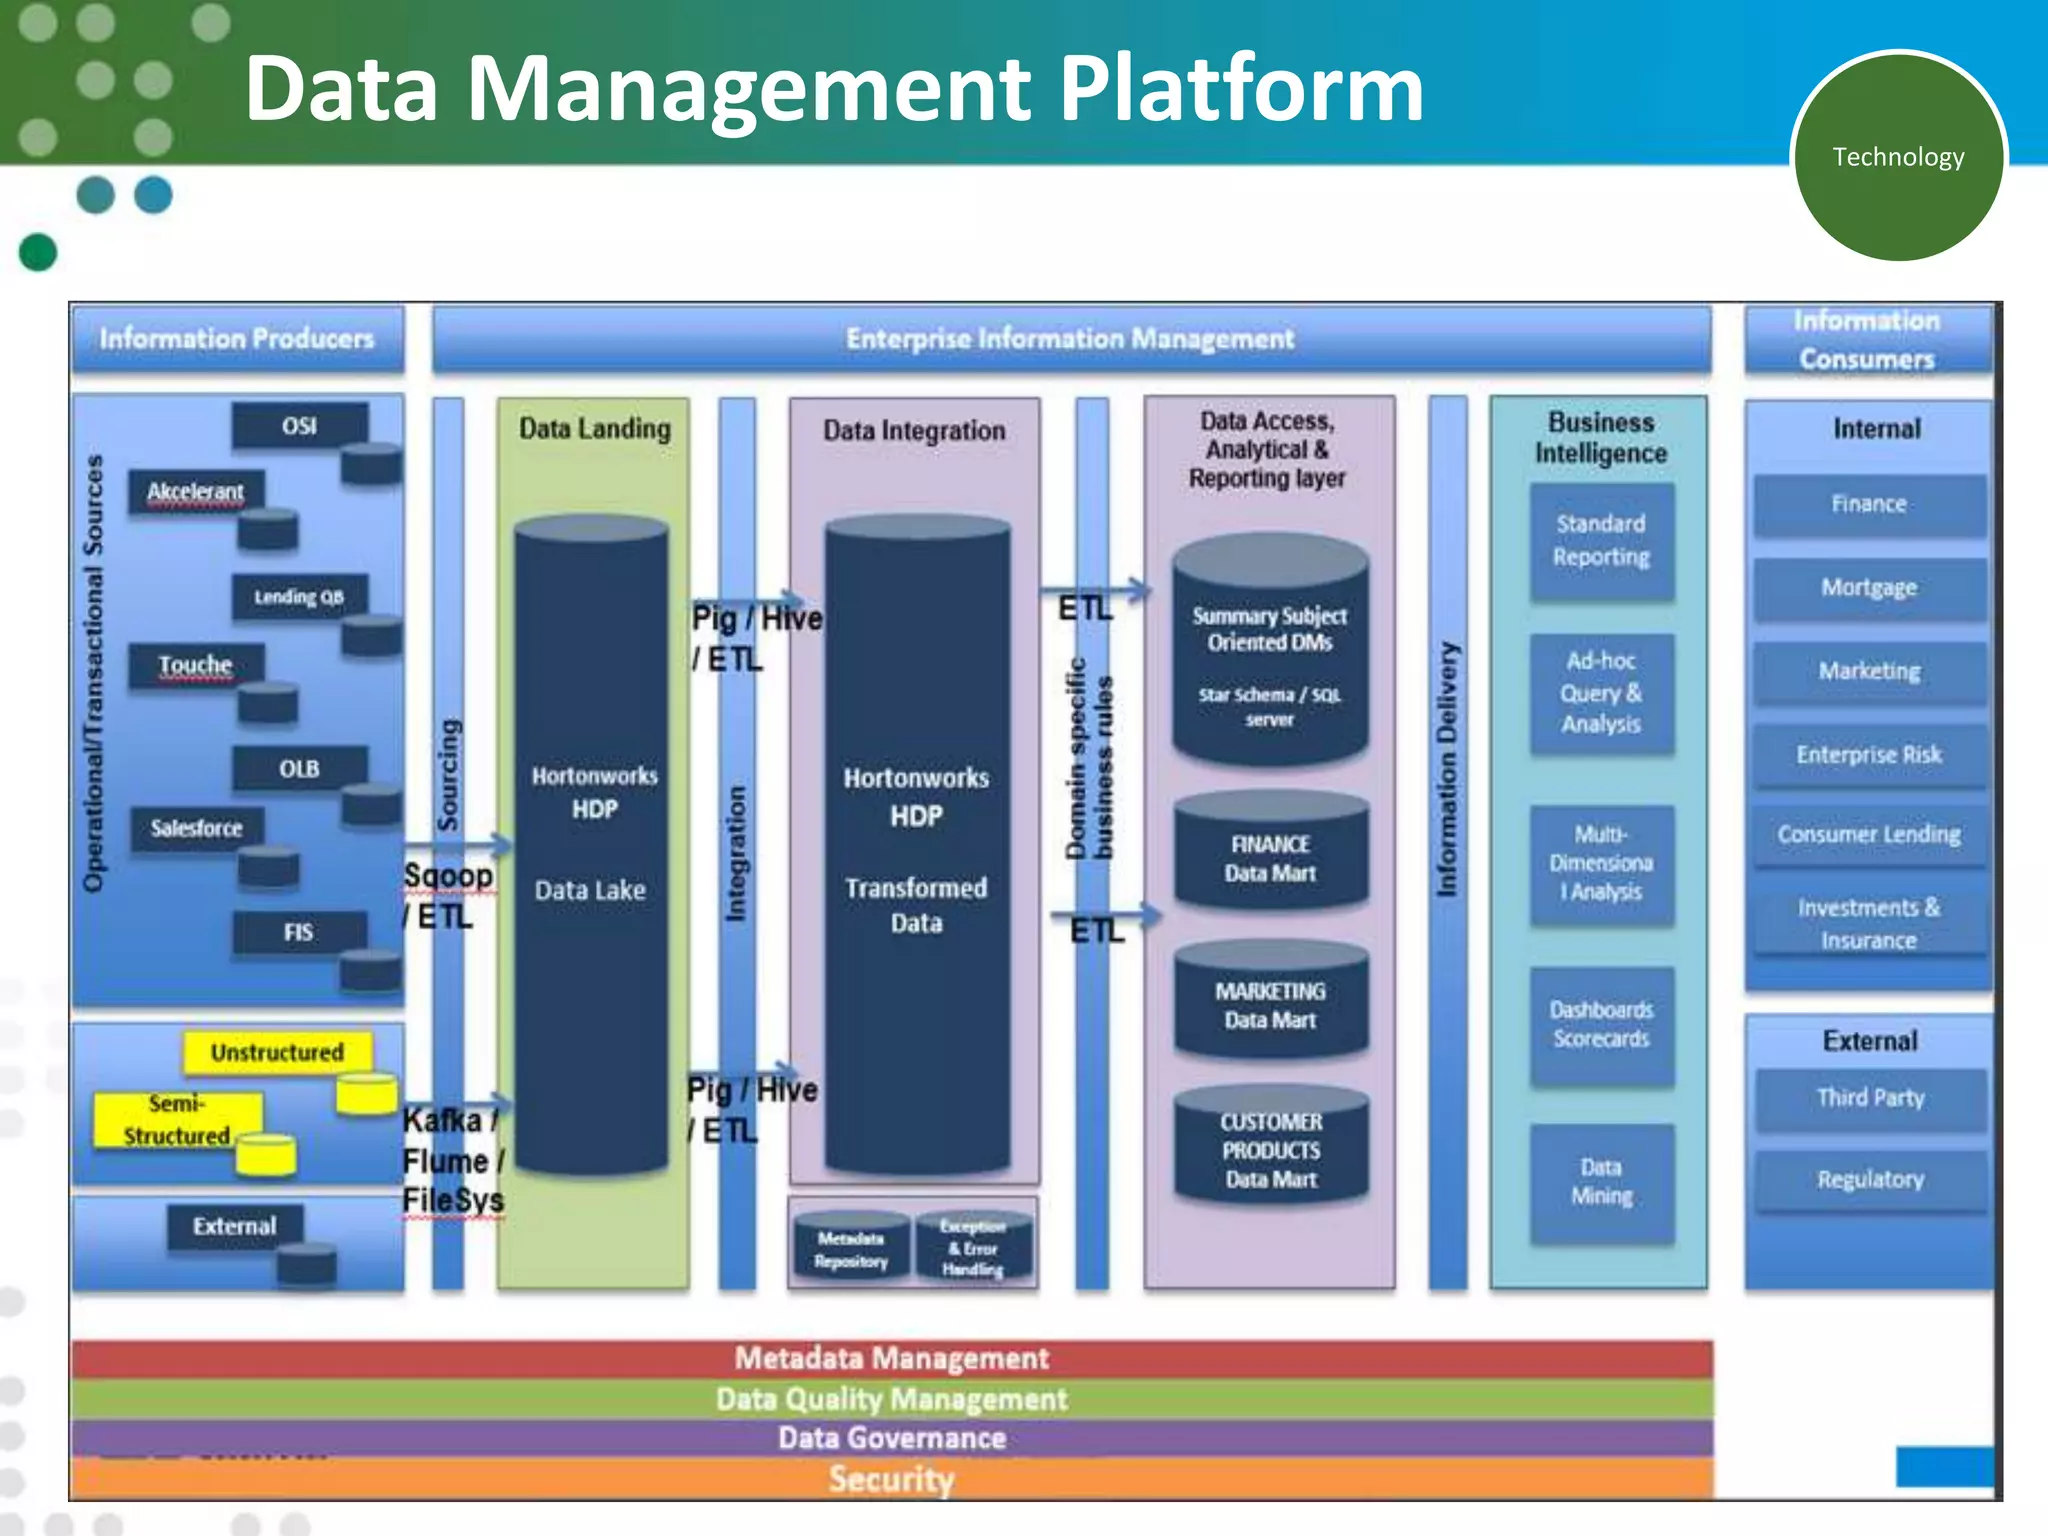
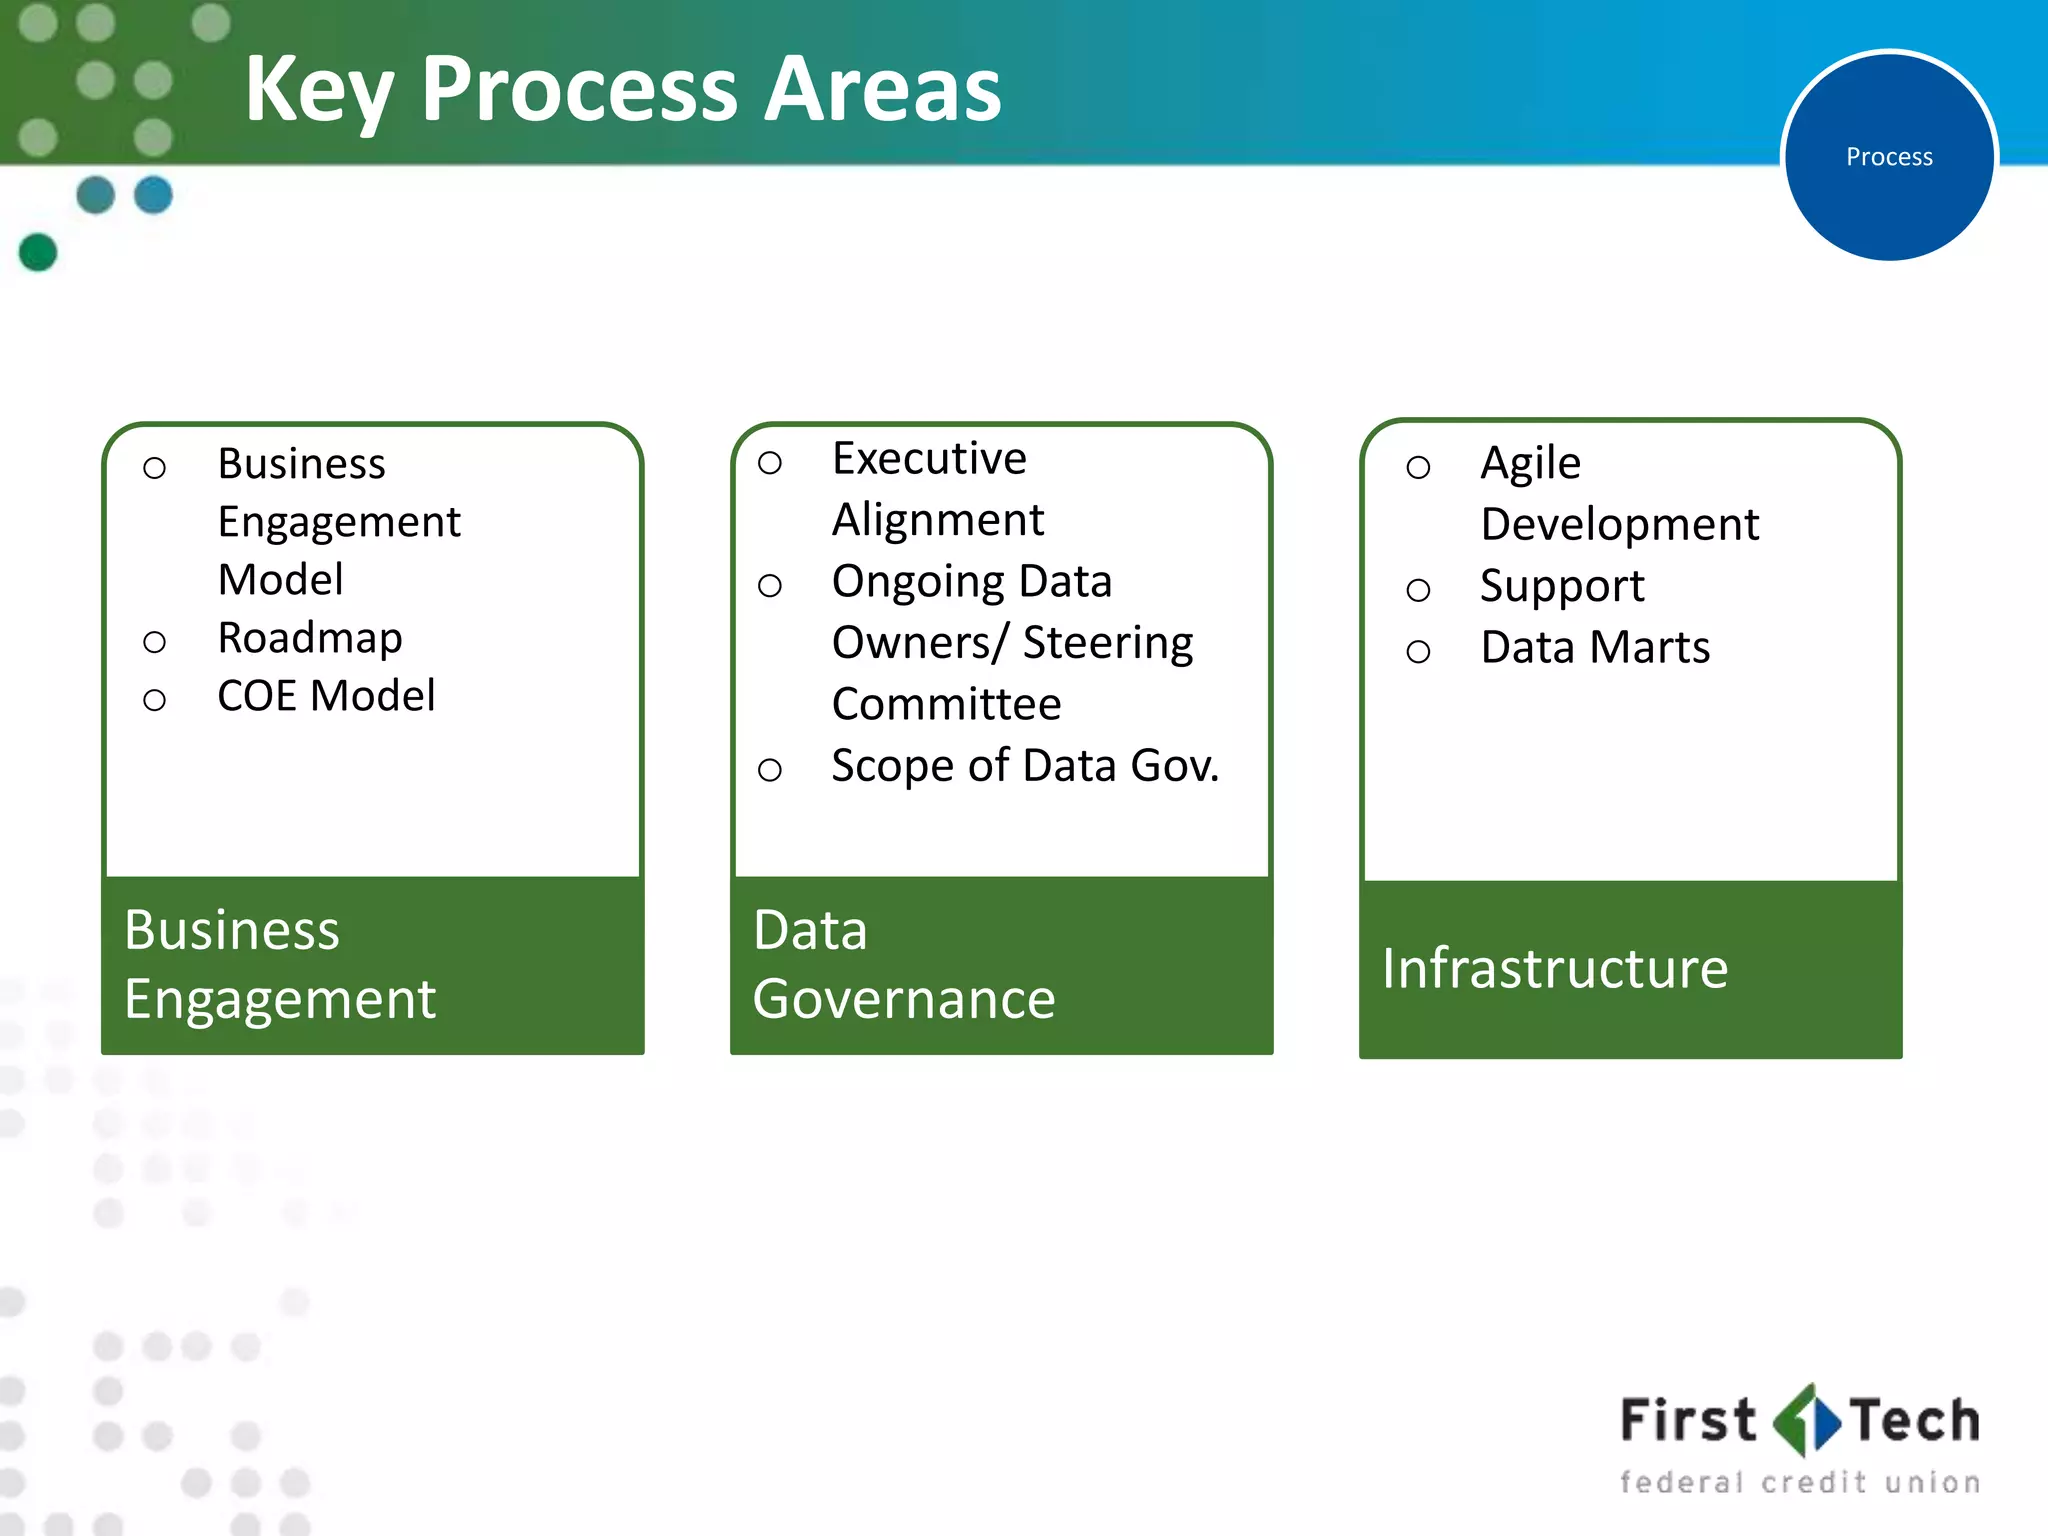
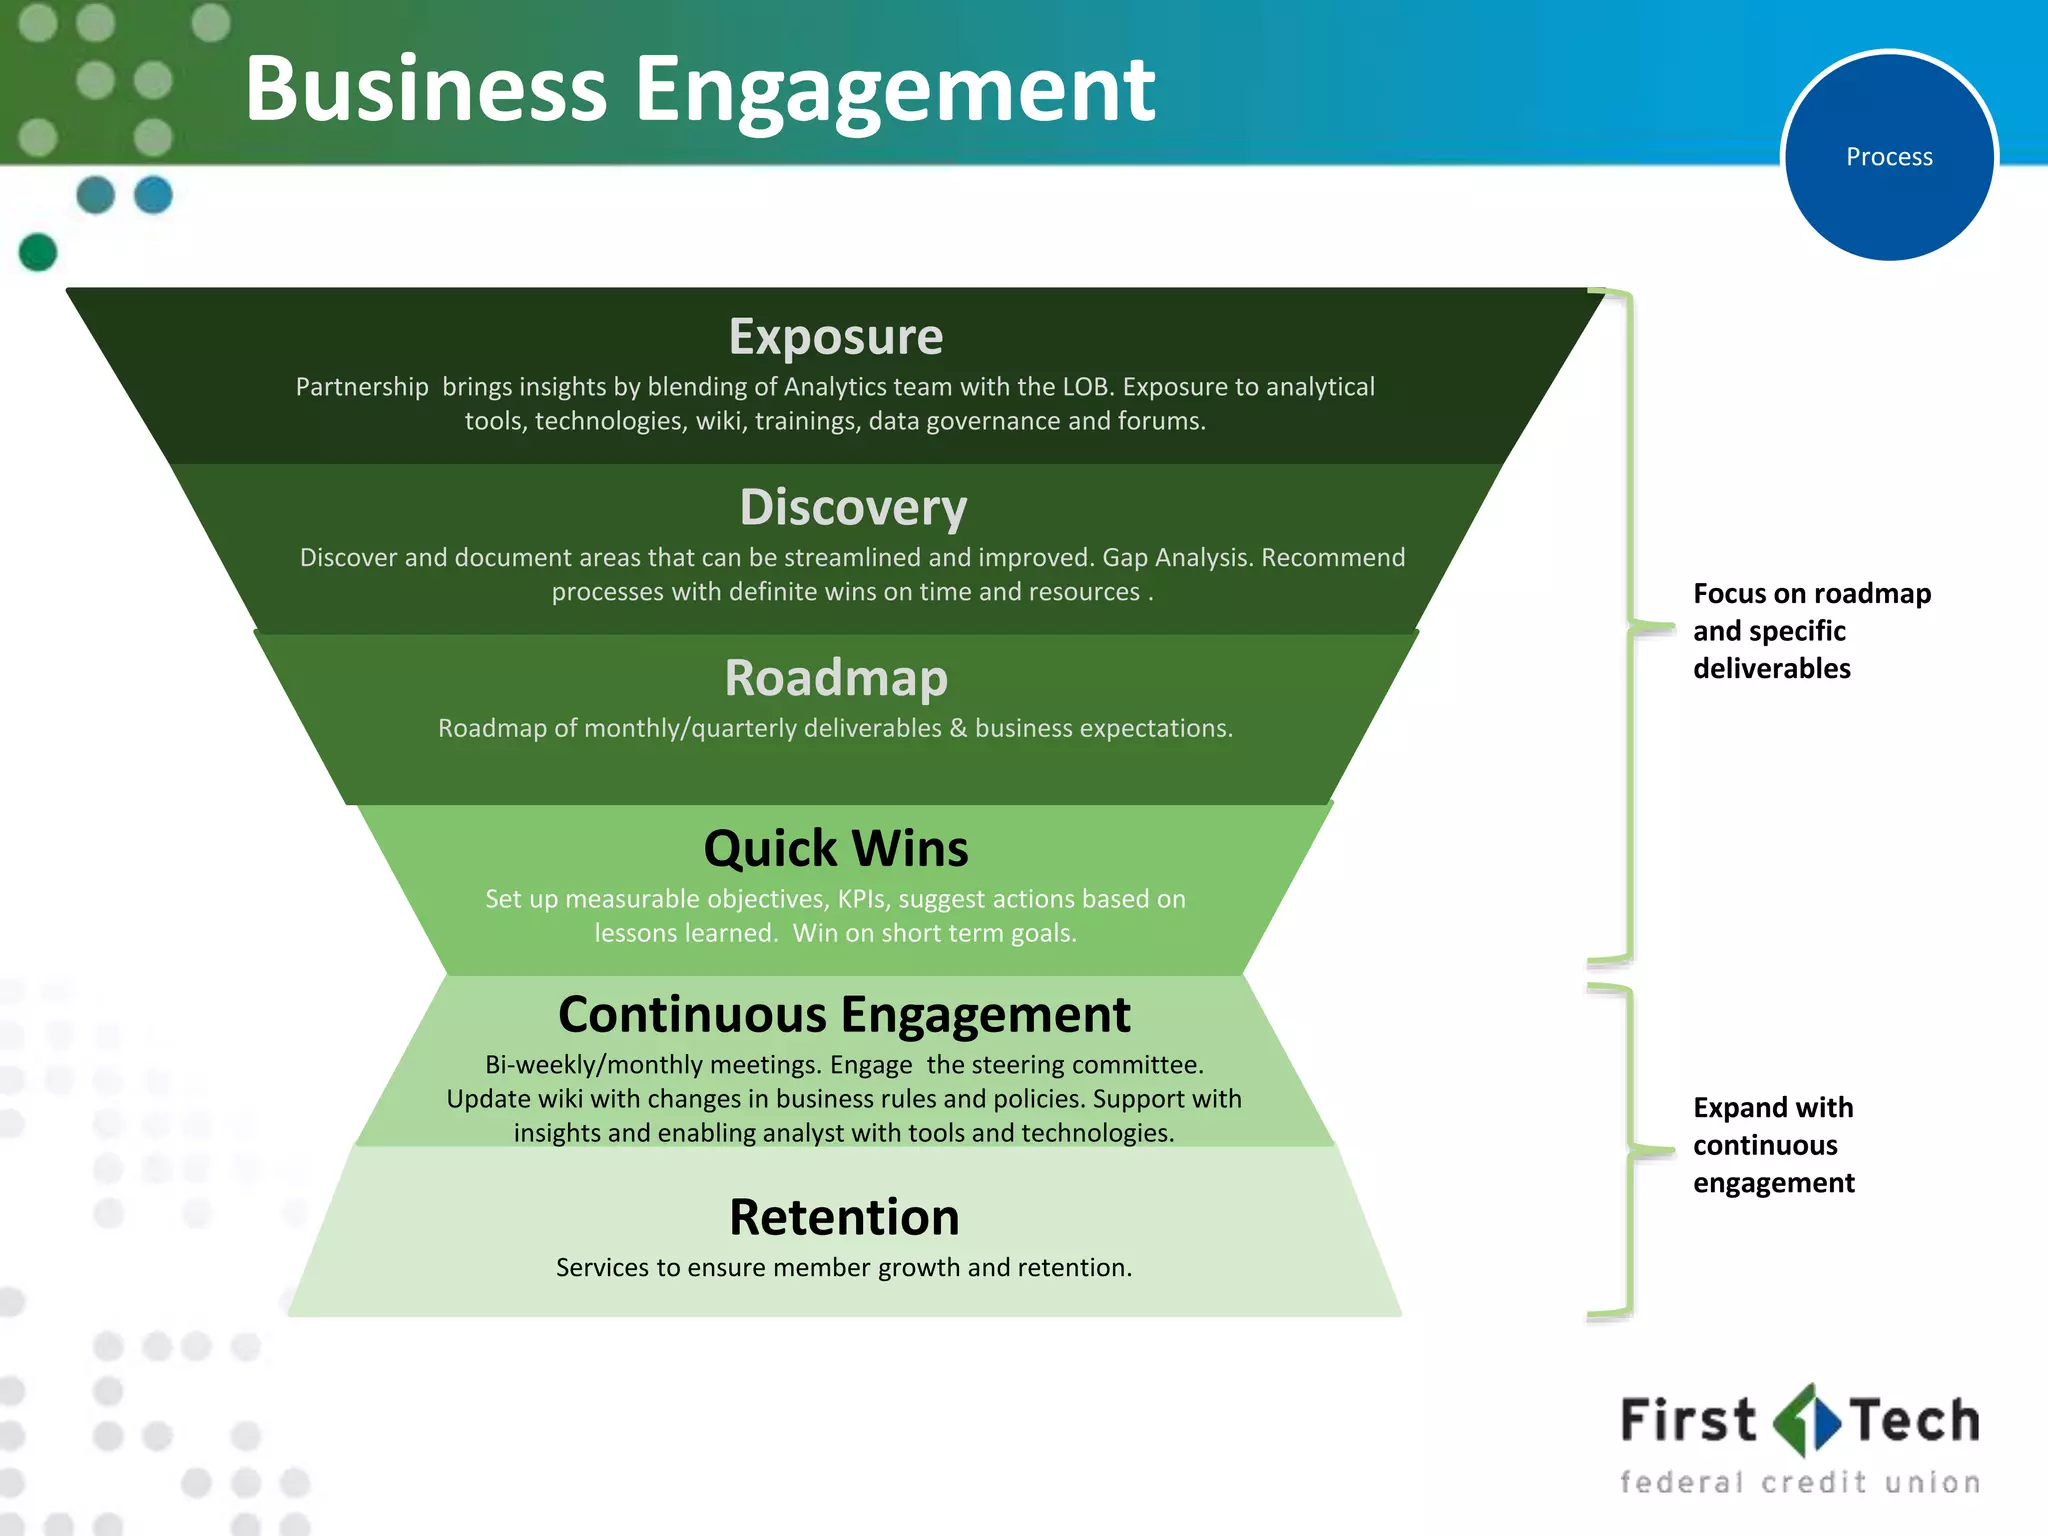
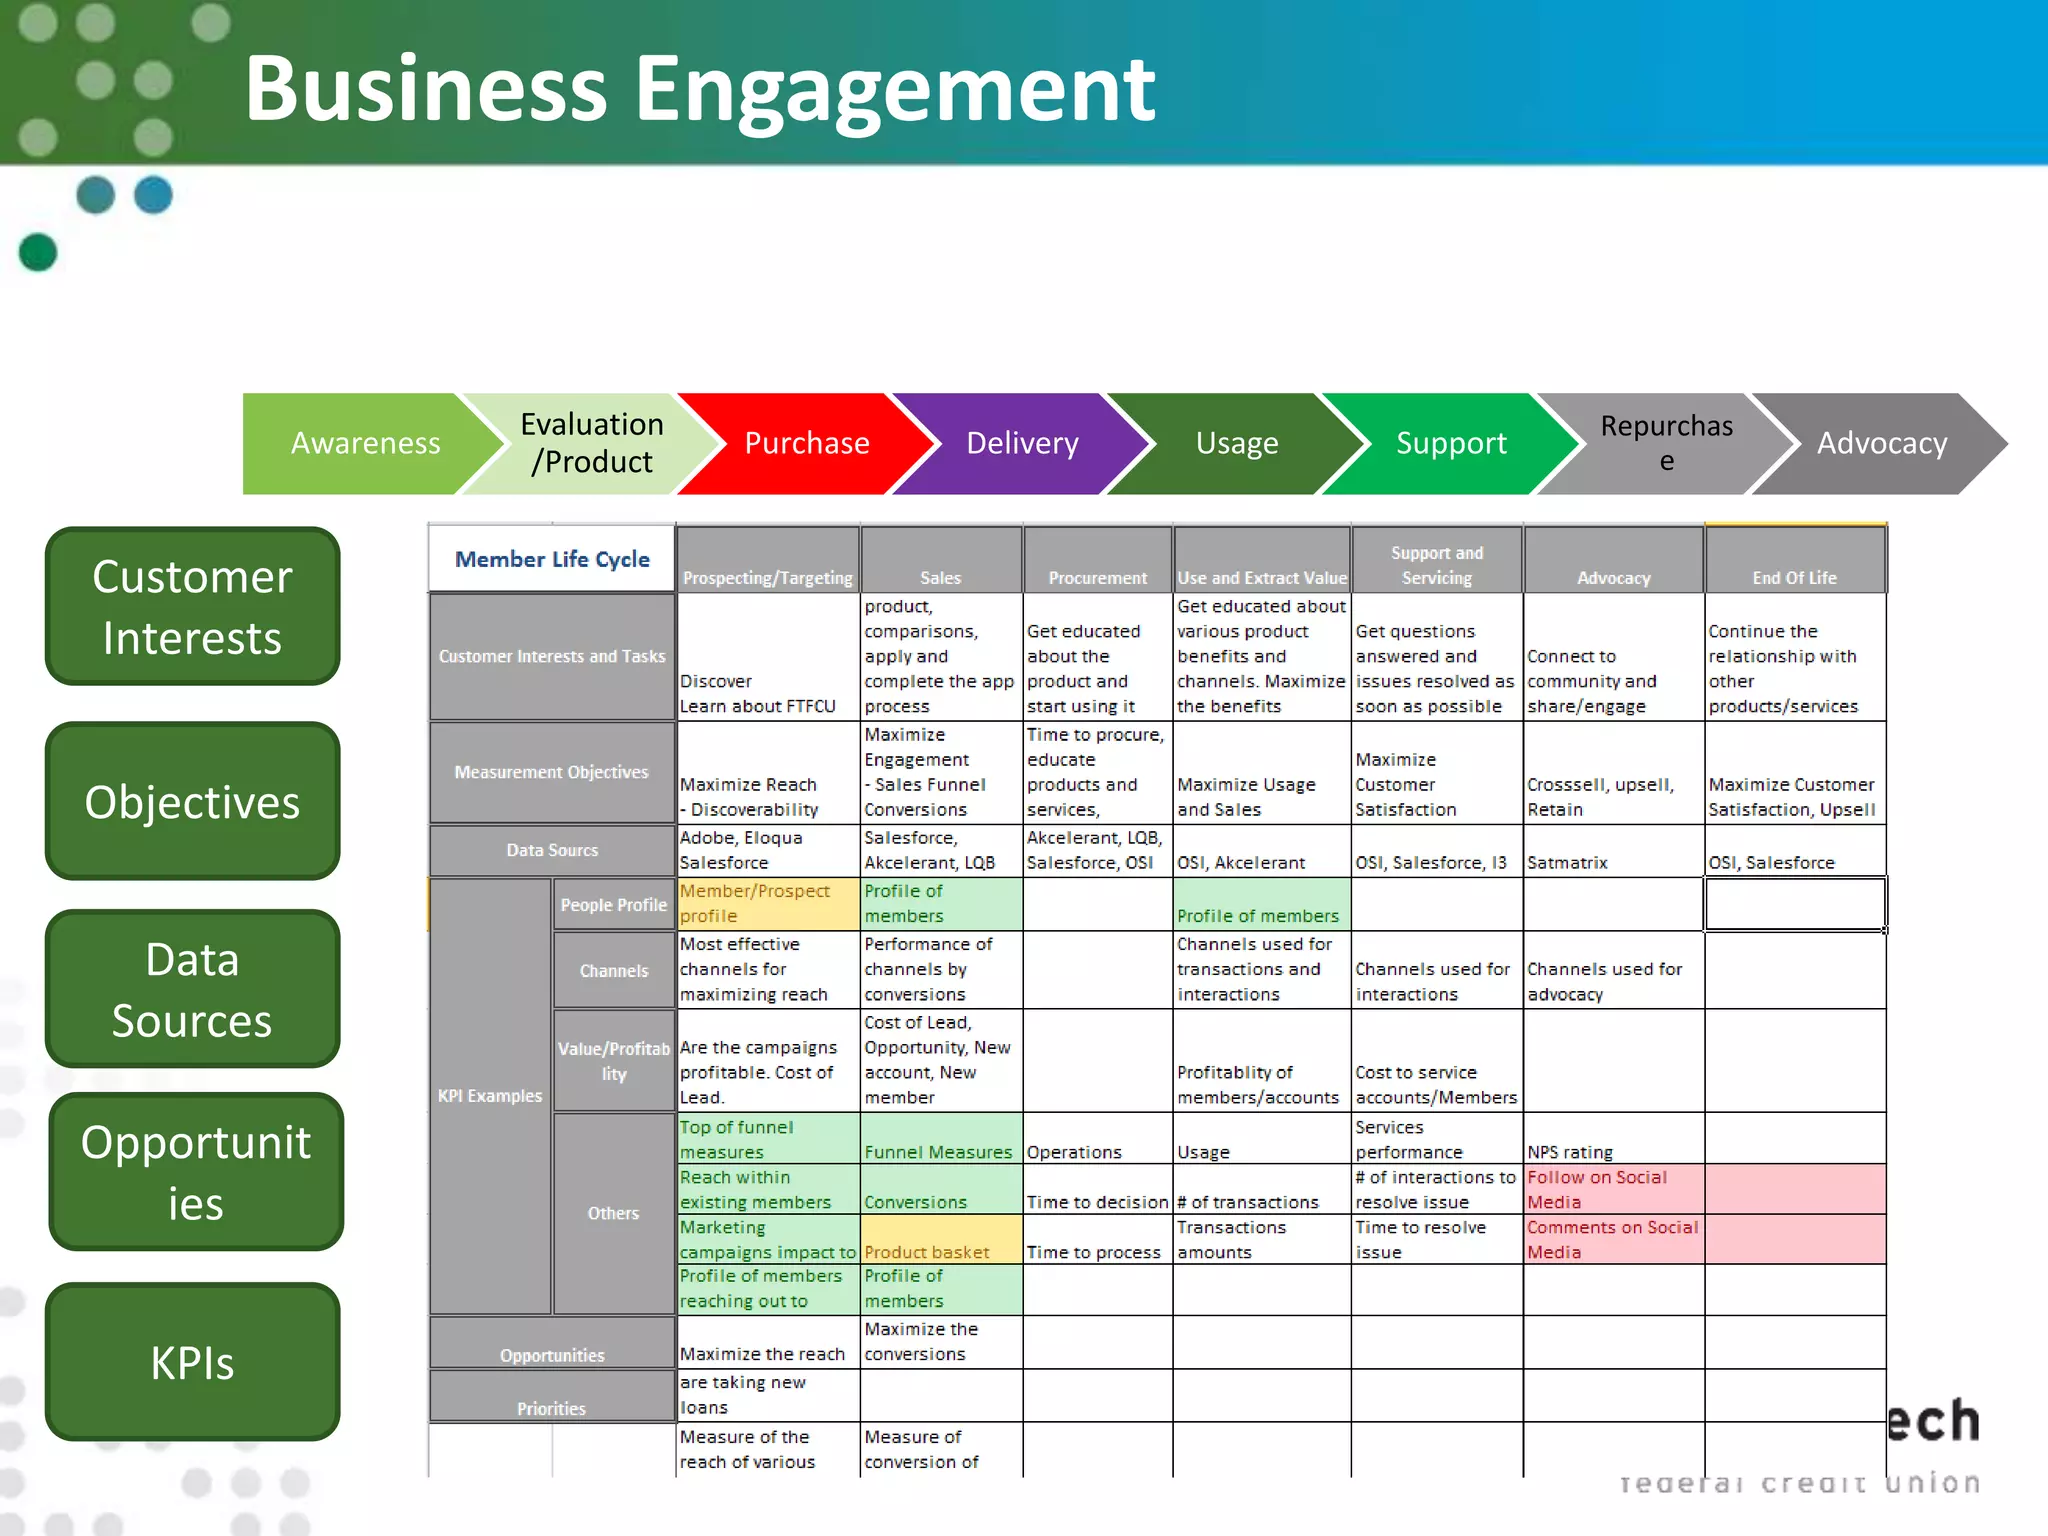
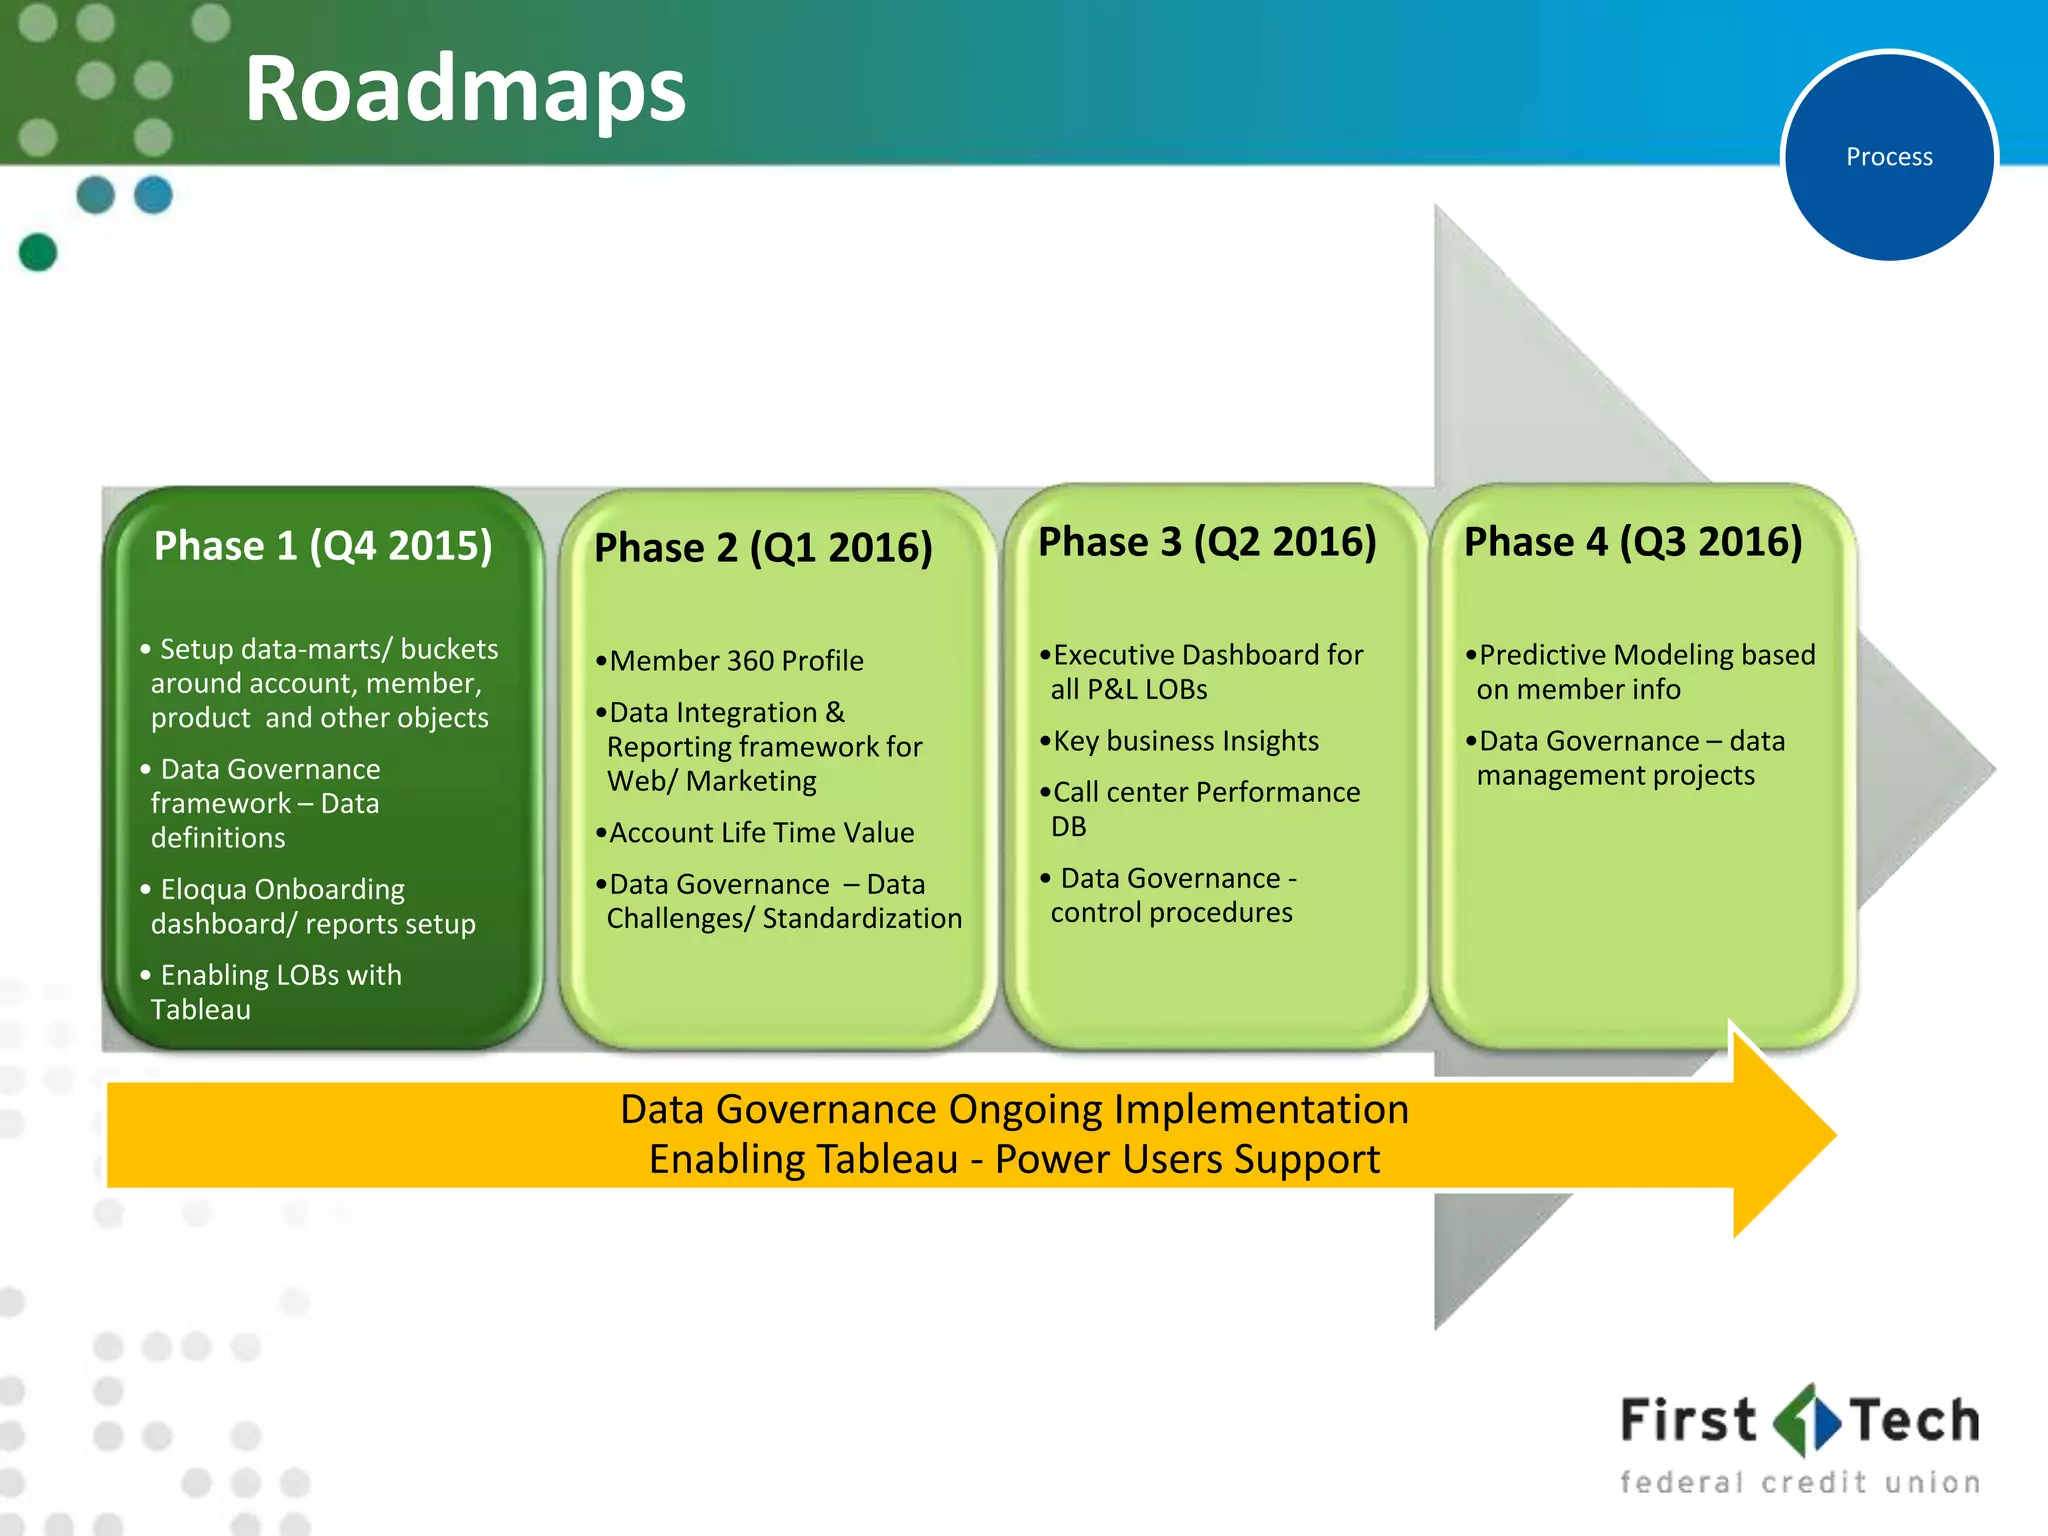
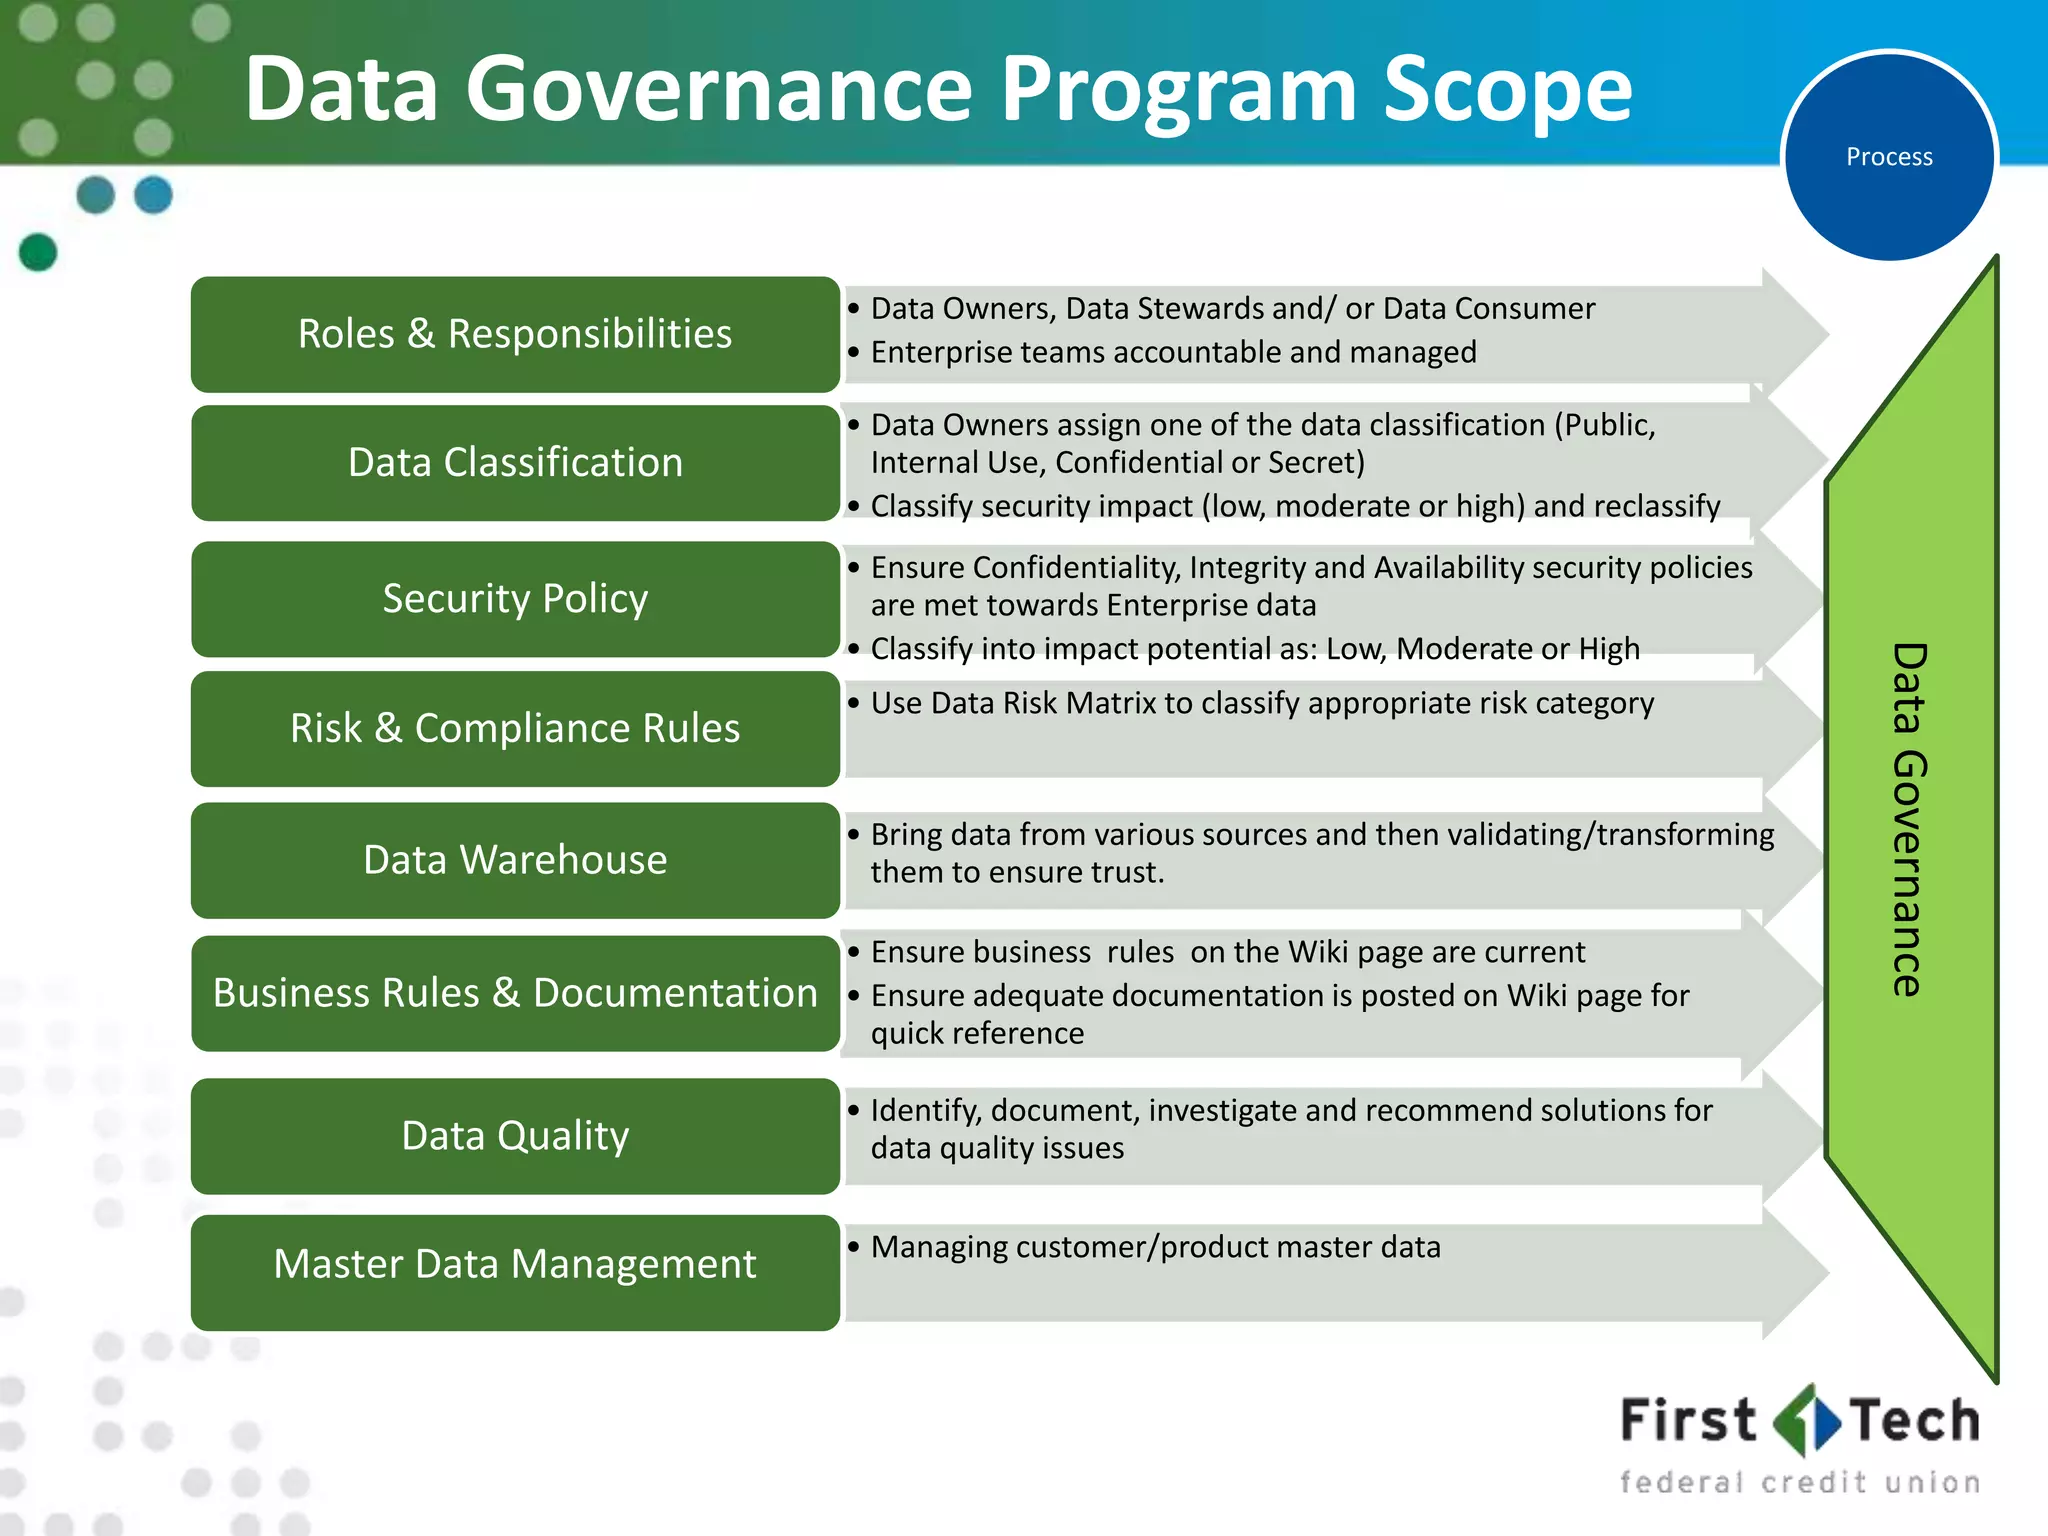
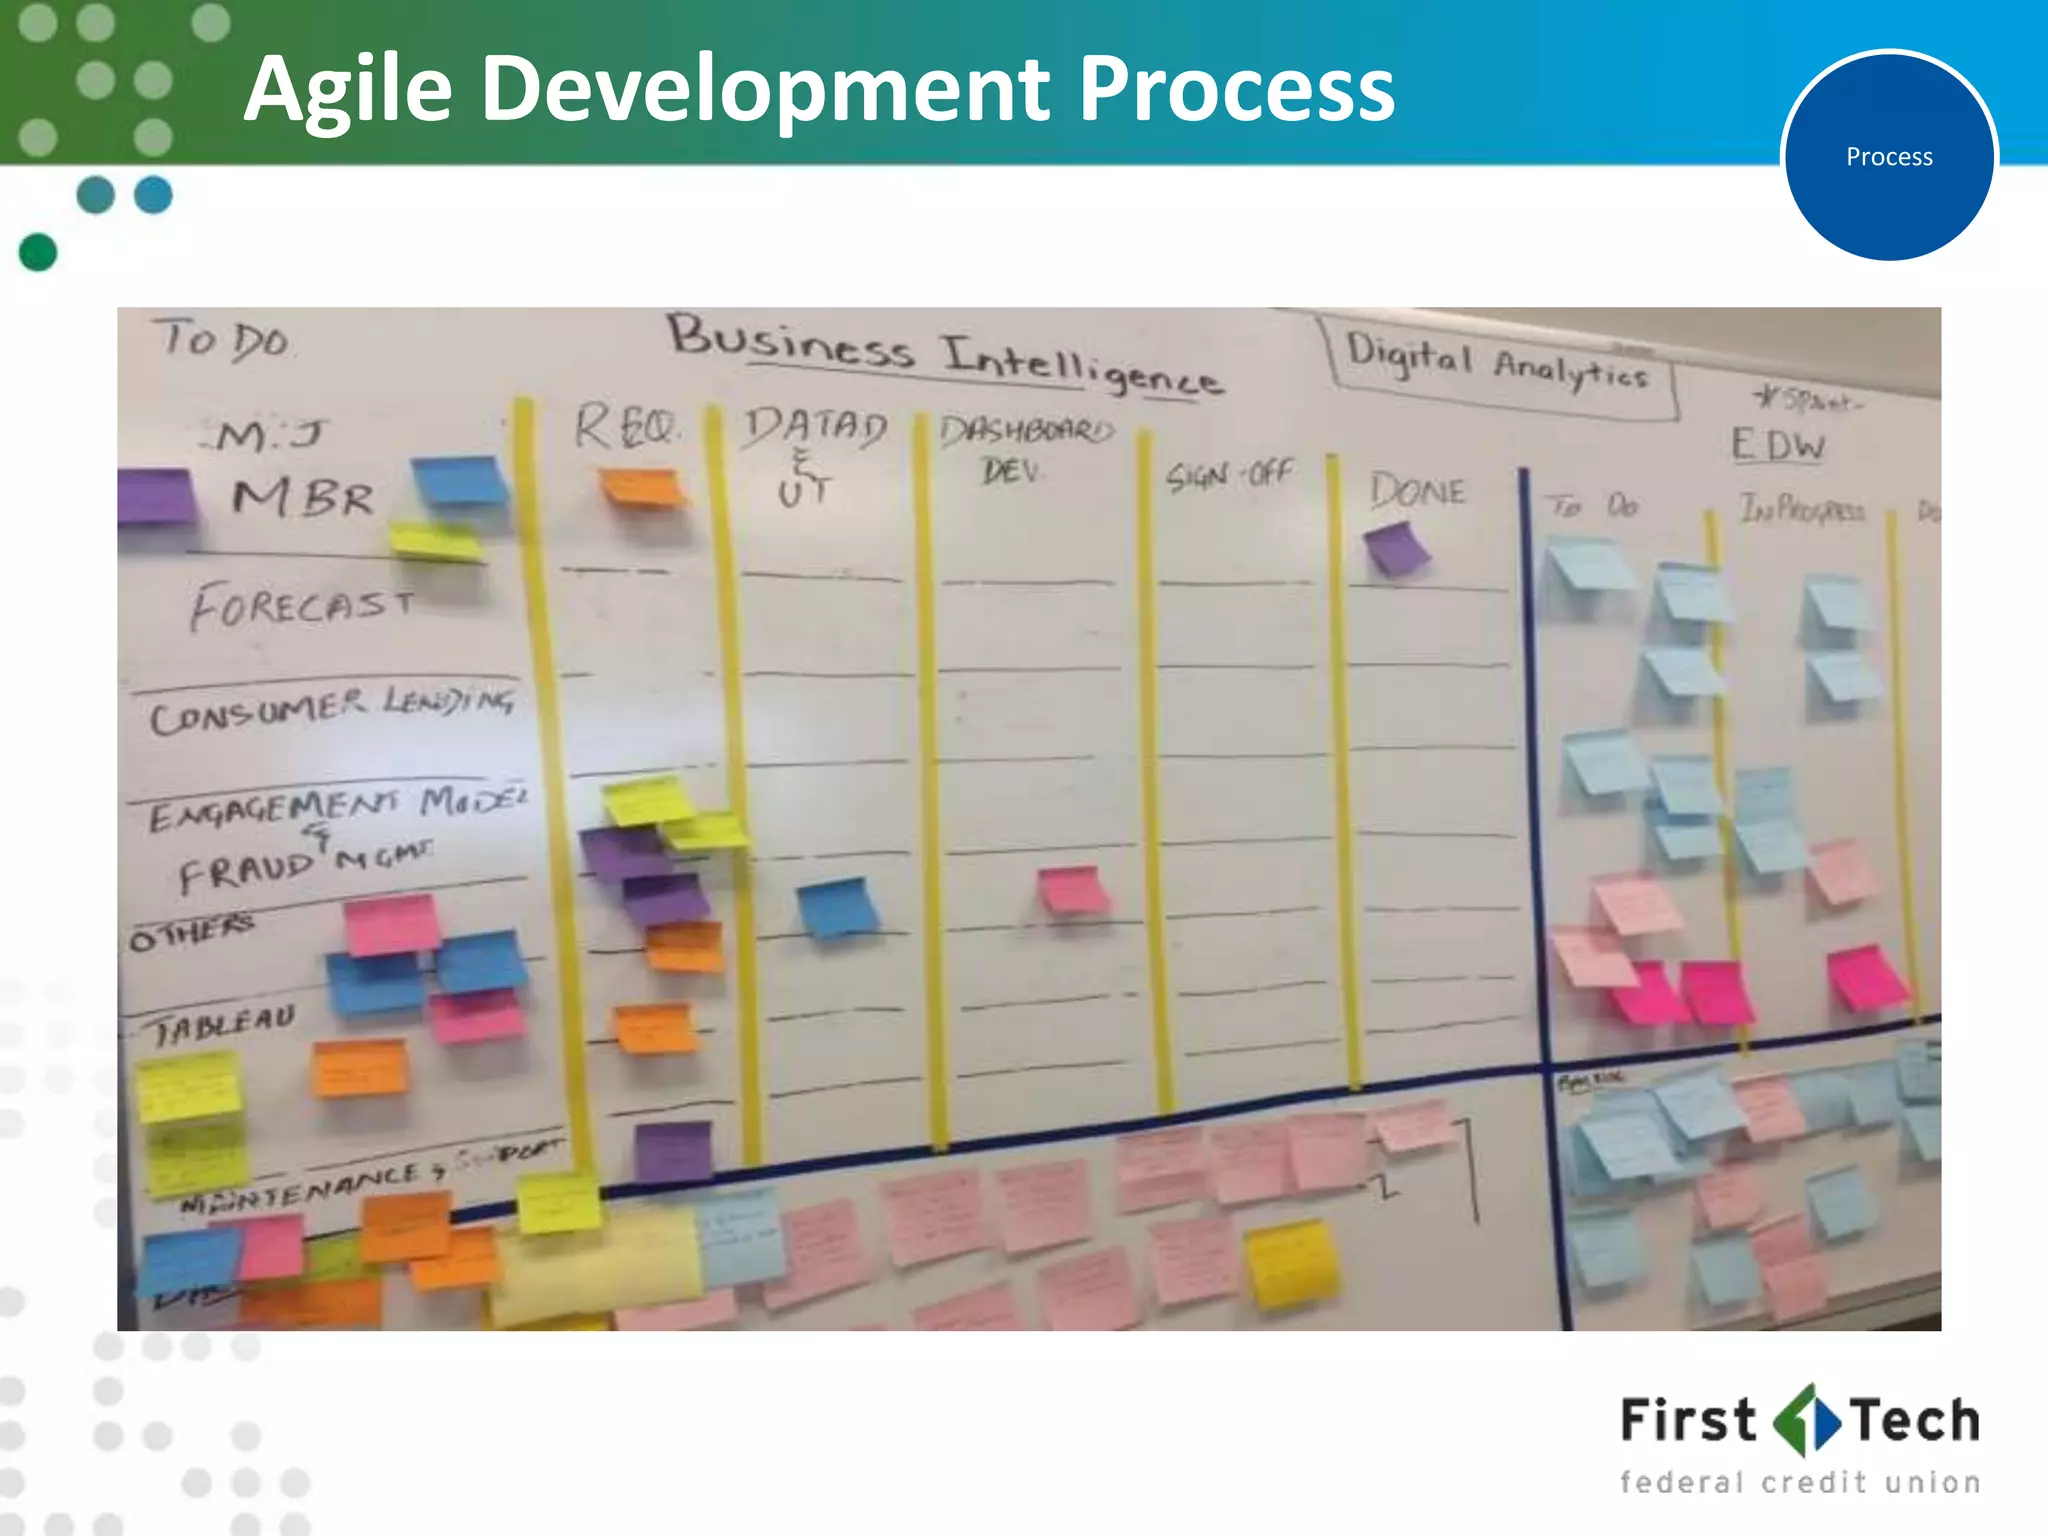
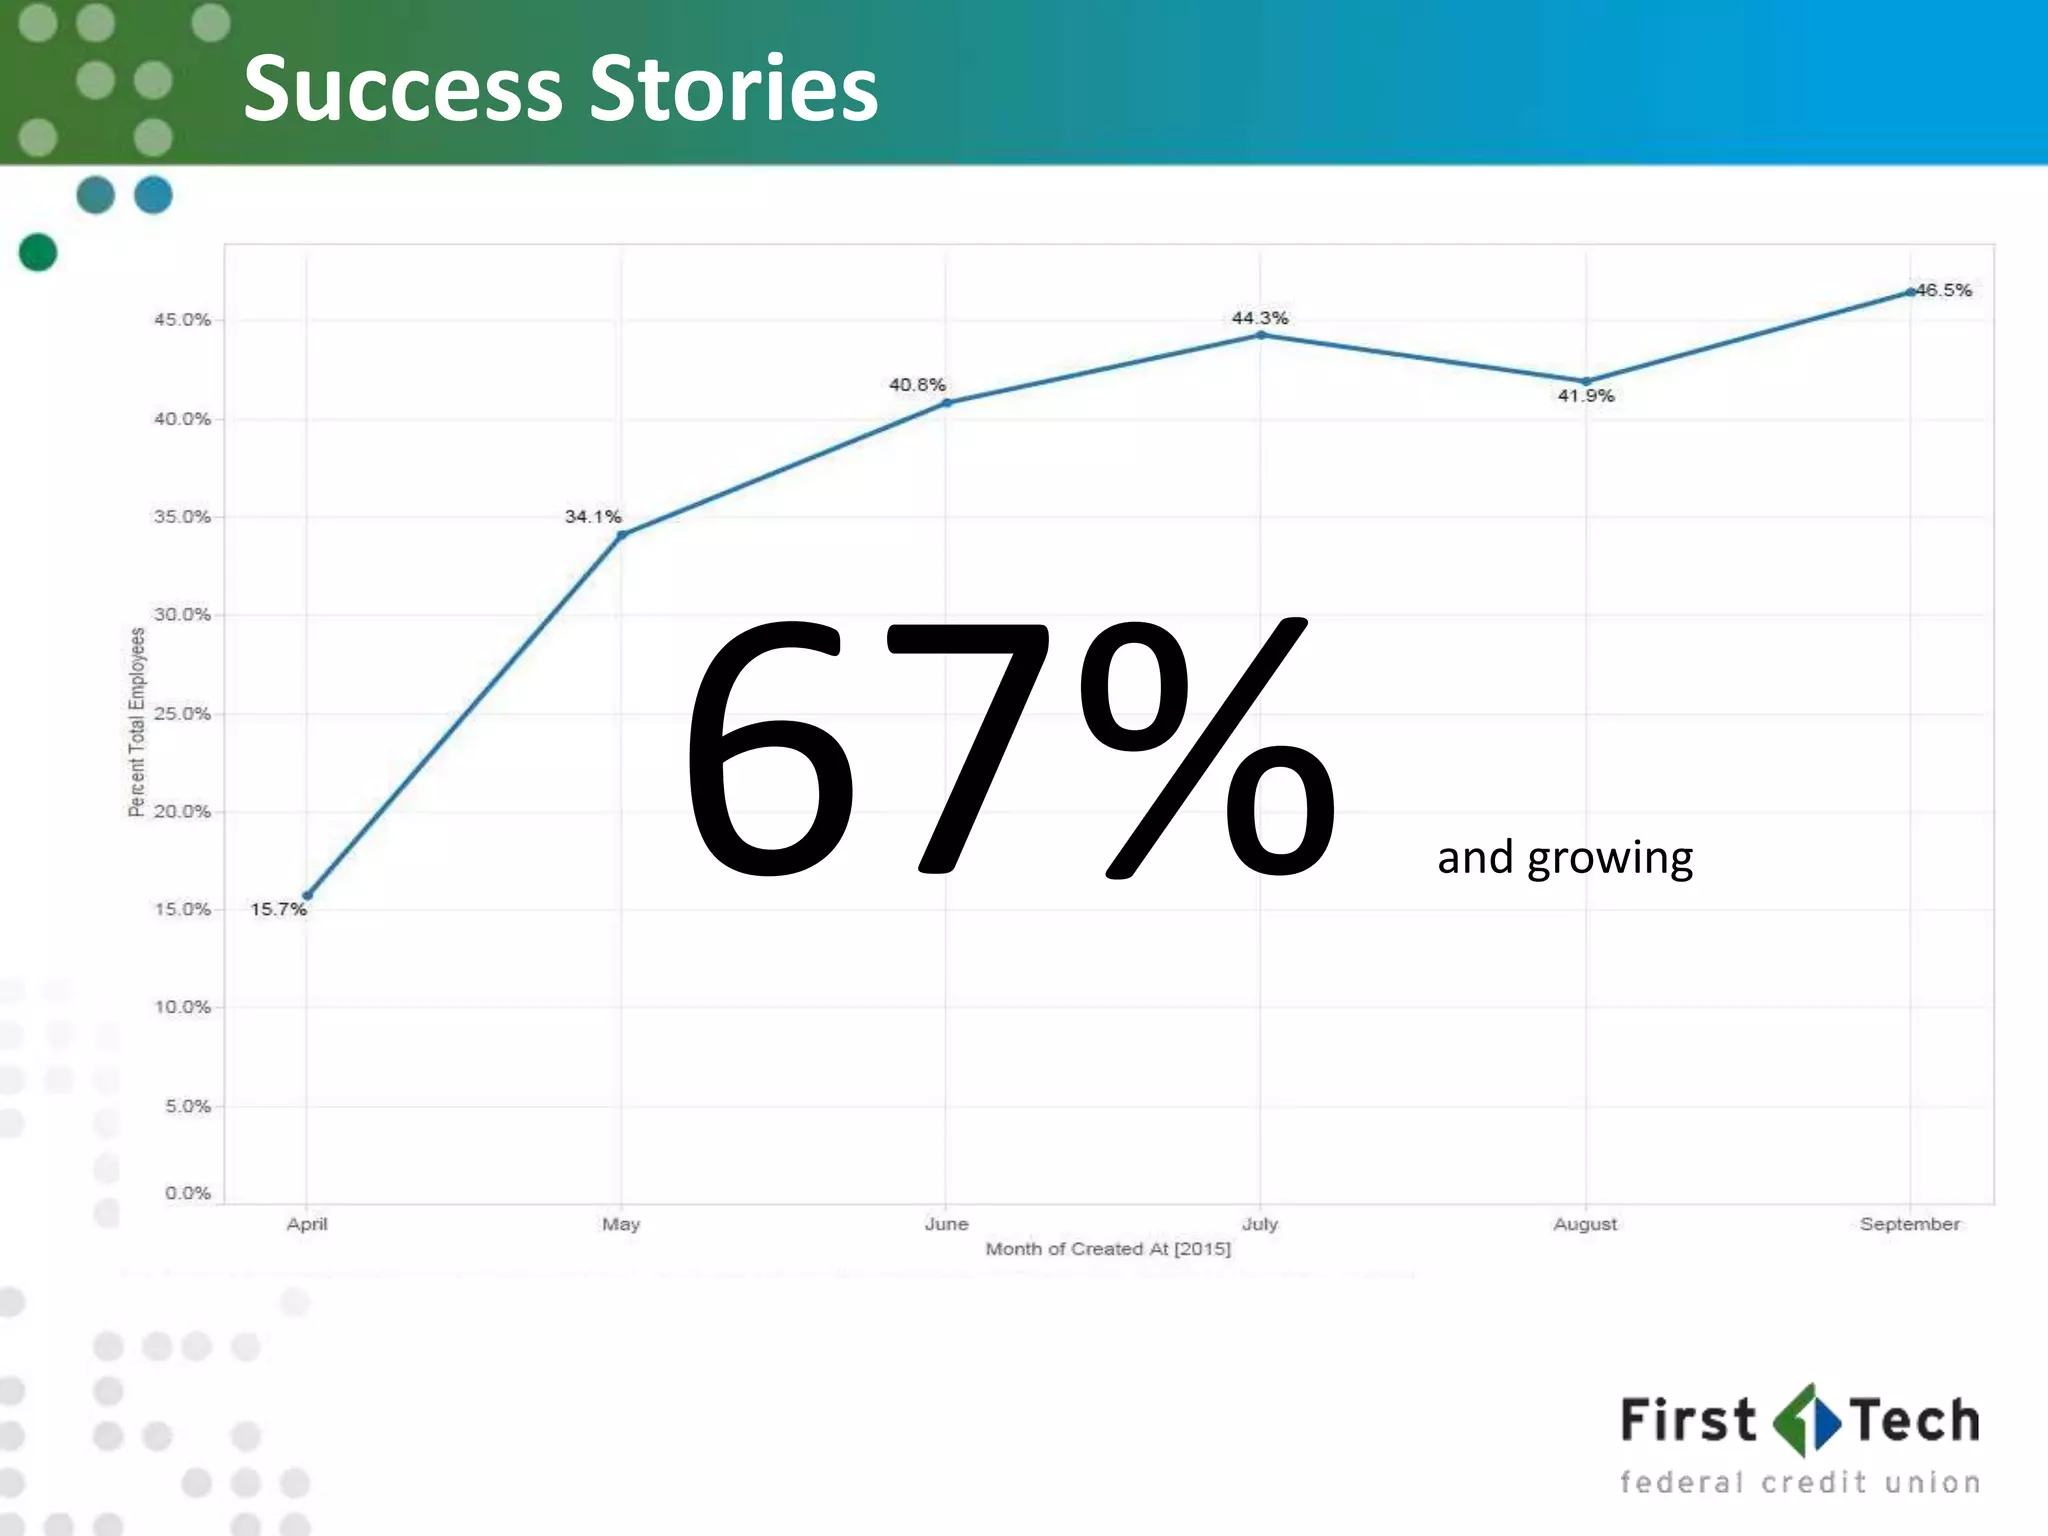
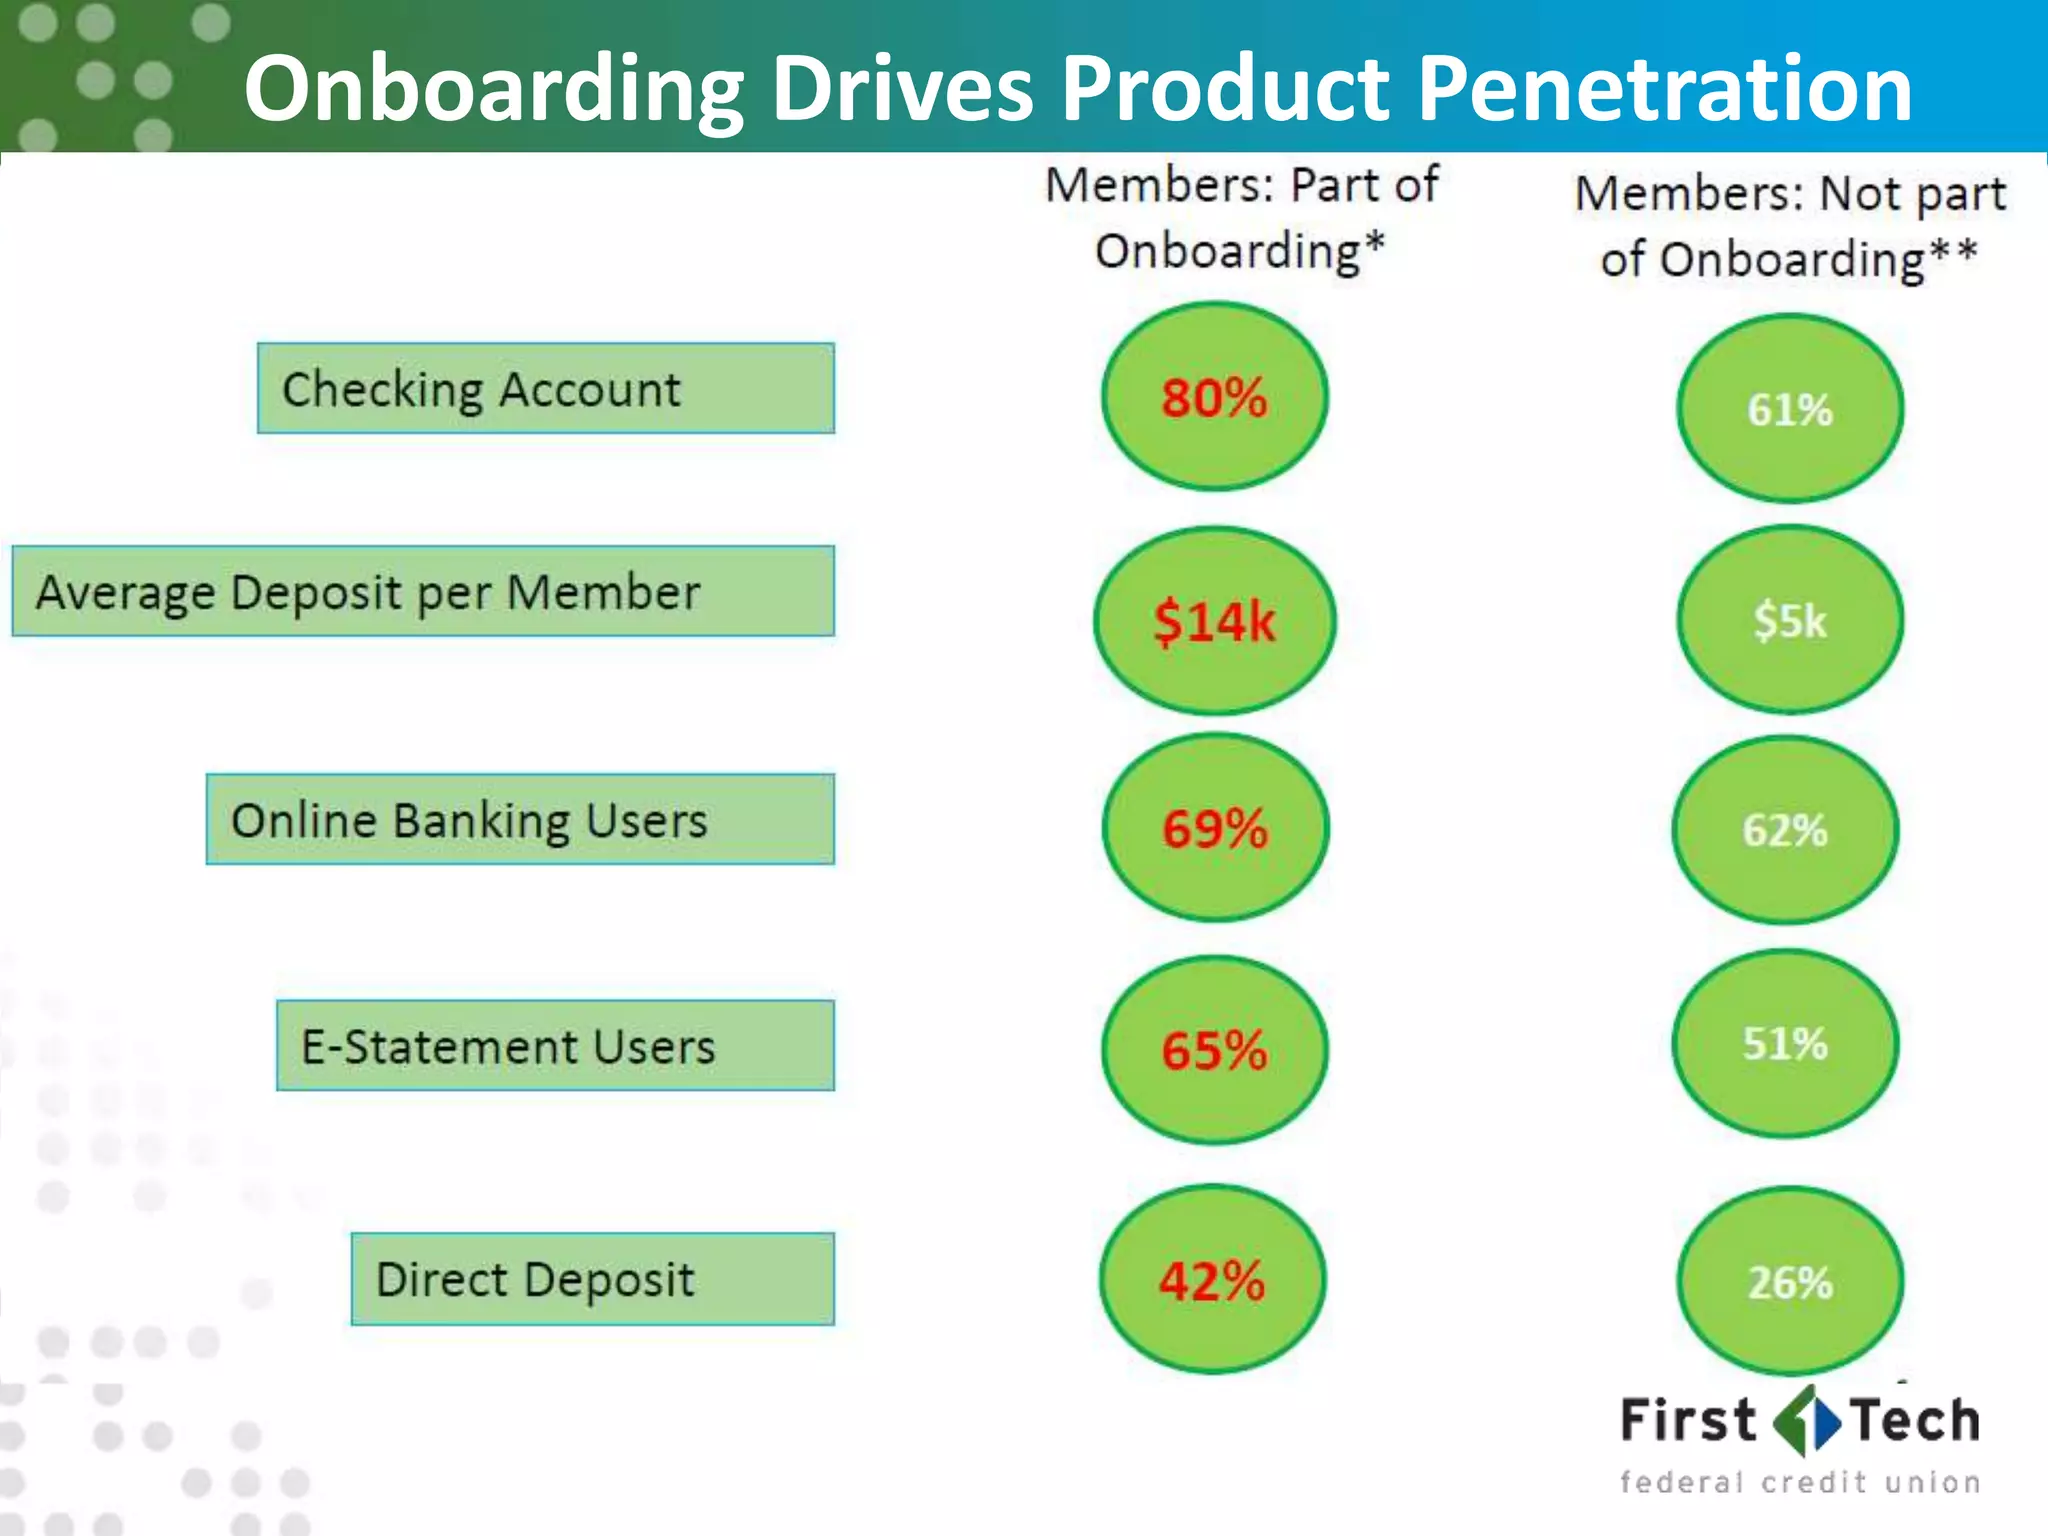
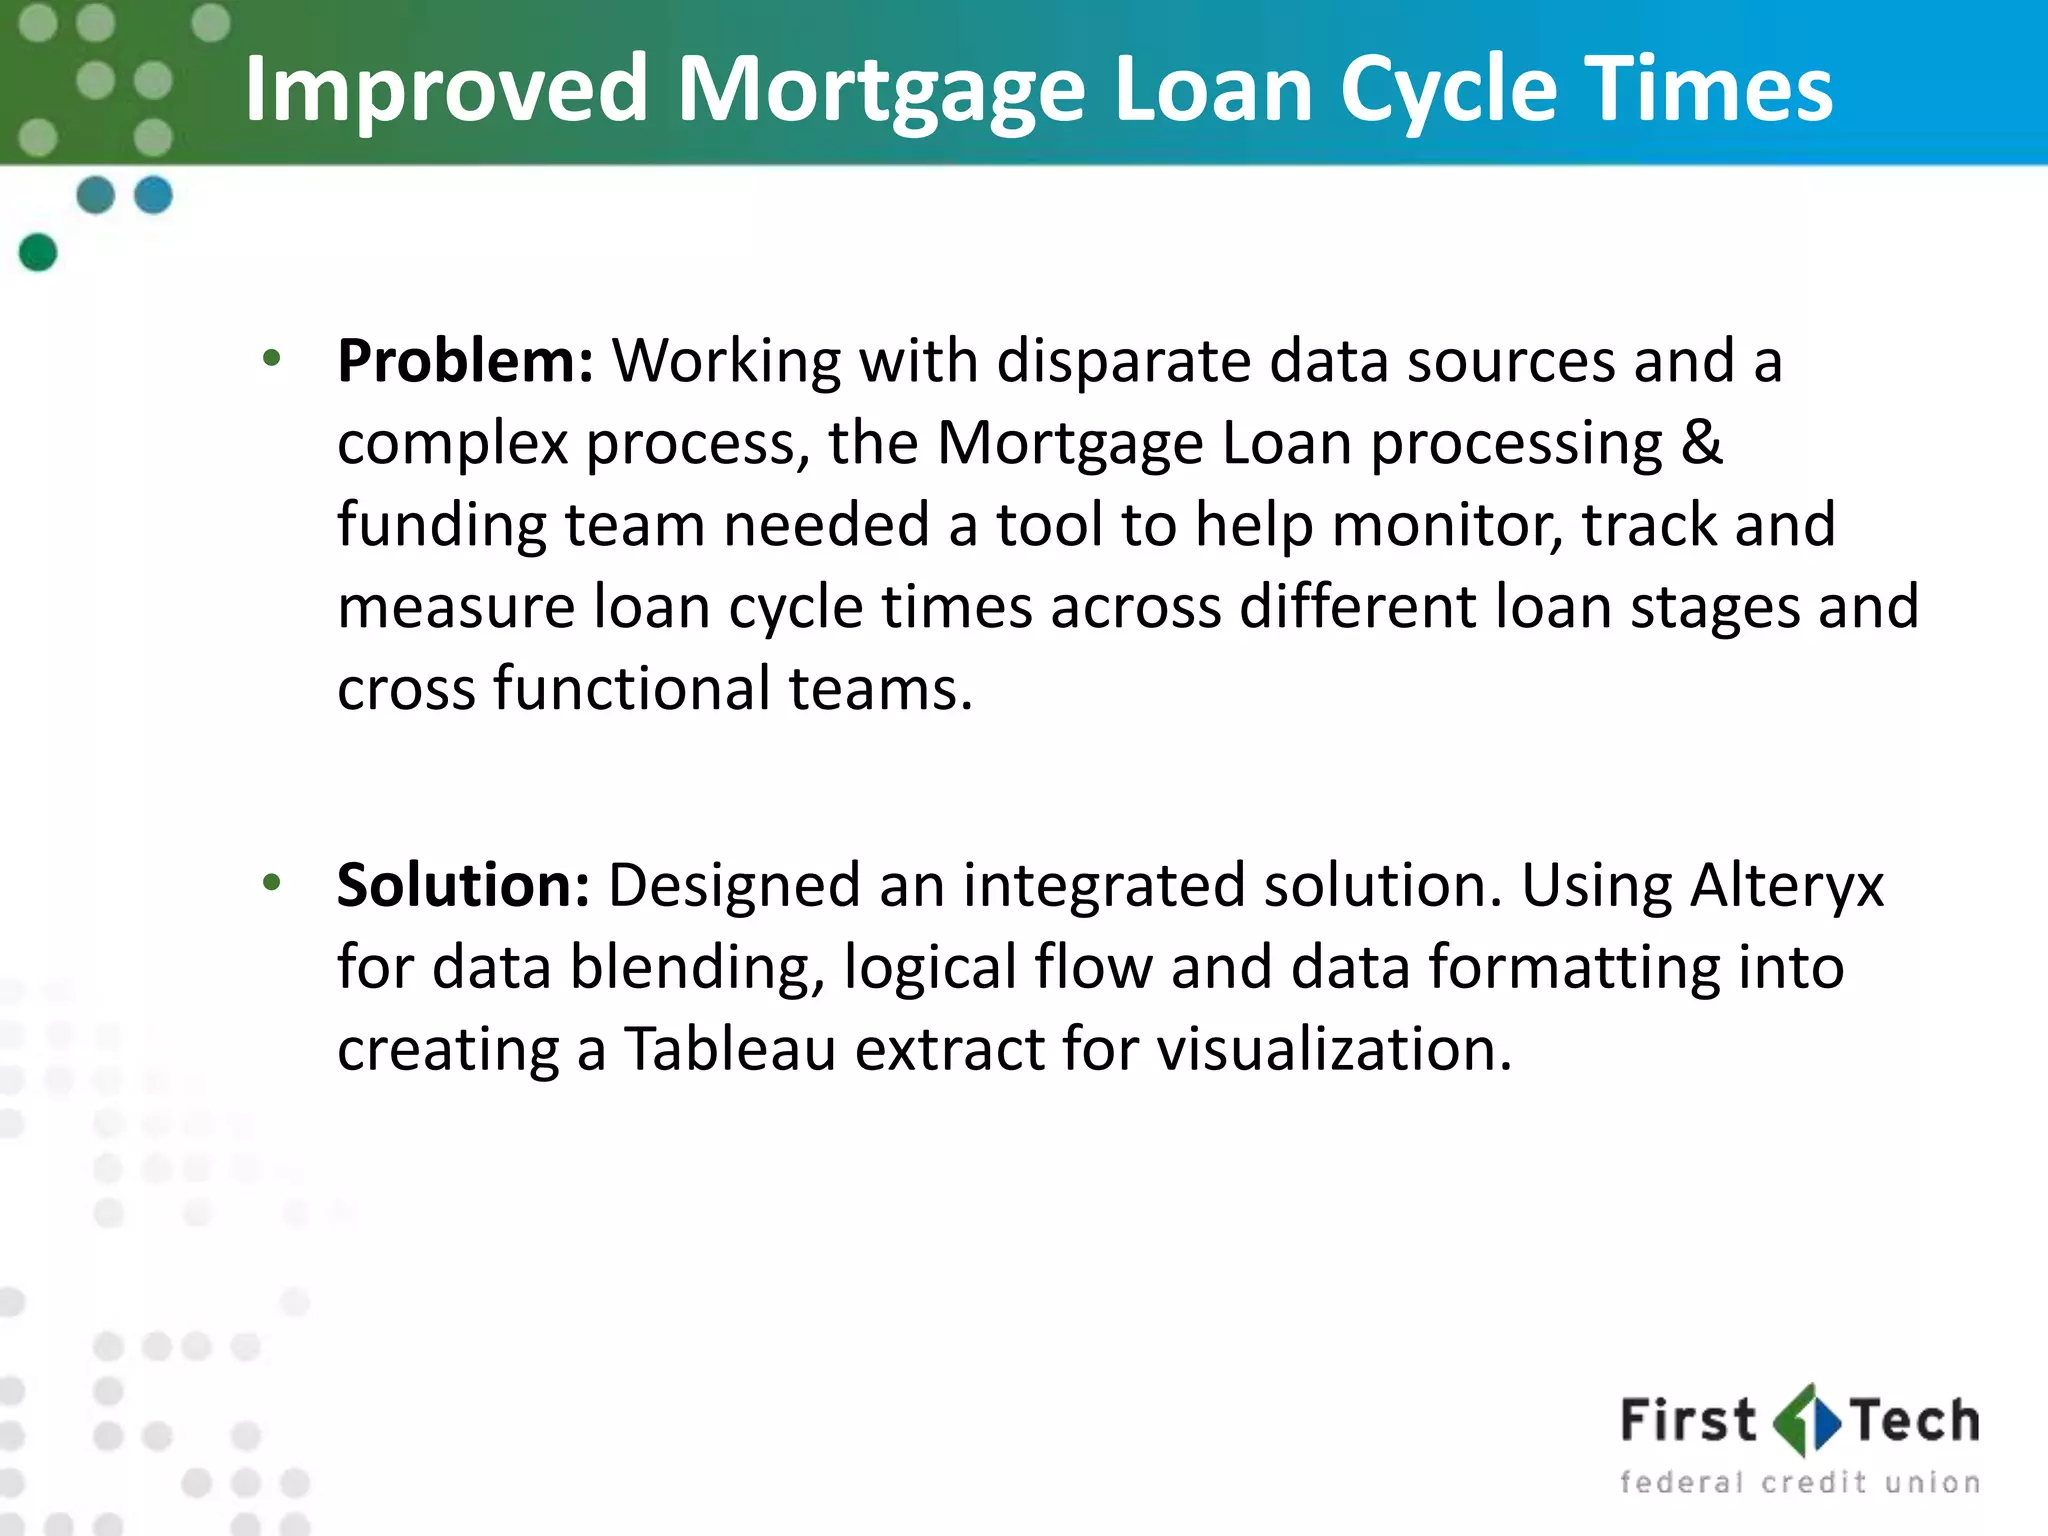
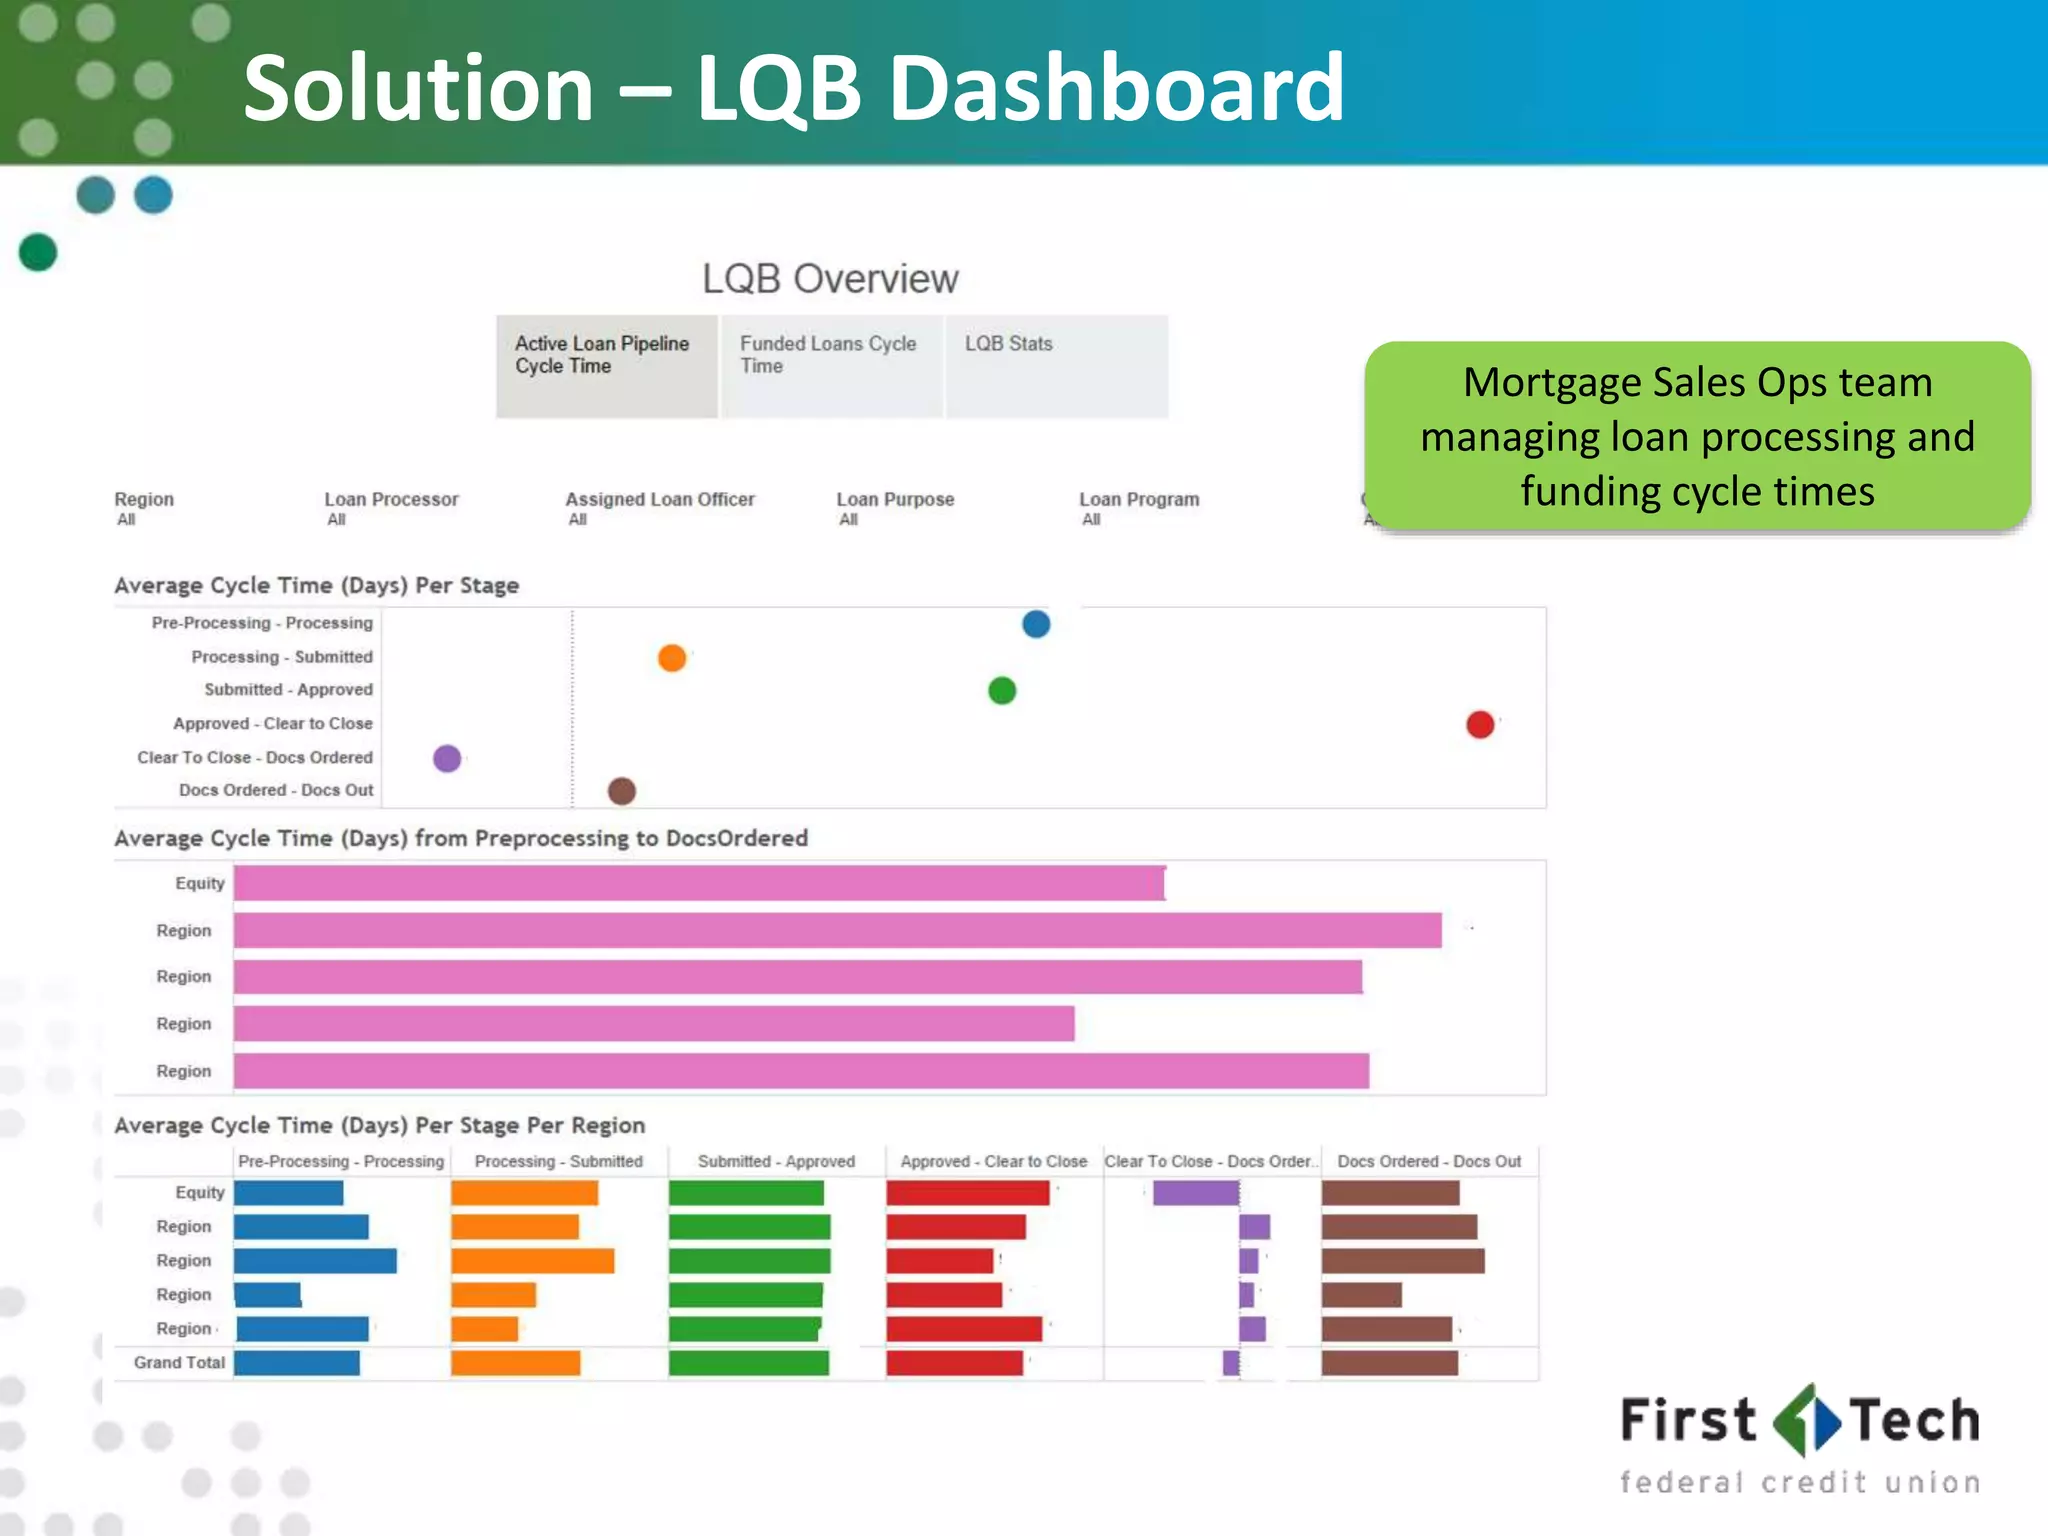
1. Building a Culture of Analytics at
First Tech Federal Credit Union
Naveen Jain
Director, Digital Analytics
2. Focused on Delivering a Different Banking Experience
• We proudly offer a complete suite of financial services
including Insurance and Investment Services1
• The NCUA rates us among the safest credit unions in the
country2
60
years of service.
Established by
Tektronix and HP
employees.
400Kmembers
nationwide
40branches
$8
billion in assets
1Securities offered through Raymond James Financial Services, Inc., member FINRA/SIPC, which is not affiliated with Addison Avenue
Investment Services or First Tech Federal Credit Union. Investment advisory services offered through Raymond James Financial Services Advisors,
Inc. Securities are not guaranteed by the Credit Union, not NCUA/NCUSIF insured, not a deposit, not insured by any government agency, are subject
to risk and may lose value.
First Tech Insurance Services is a wholly owned subsidiary of First Tech Federal Credit Union.
2Source: www.ncua.gov.
8th
largest credit union in
the nation
3. Adobe Hewlett
Packard
Enterprise
HP, Inc. Yahoo
Nike
CH2M
Intuit
Intel
Cisco
Amazon
Philips
We Serve Innovators
Microsoft
Hewlett
Packard Intel
Microsoft
Keysight
Technologies
Twitter
Tektronix
GoogleAgilent
Technologies
5. What we will be discussing today
1. What does analytics culture mean
2. Business challenge
3. Key requirements of analytics culture
4. How did we do it
5. Early wins
6. Learnings recap
6. Mindful Decision Making
• Respond and
not react
• Fact based decisions
across
all levels
• Trusted information
to the right people
at the right time
13. Digital Analytics Platform
Employees
Members and Prospects
Marketing
BranchCall Center
Digital Investments &
Insurance
Web Behavior Core Banking CRM Call Center Shared
Branches
Maxarr PSCU
Loan Origination
System
Online Banking NPS Marketing
Automation
eFlow Third Party ETC
Data Management Platform
(Centralized database, normalized audience view, audience segmentation, scoring,
profiling, modeling, etc)
Core
Banking
Visualization & Analytics
Technology
Support and
Service
Insights
Action
1
2
3
16. Key Process Areas Process
Business
Engagement
Data
Governance Infrastructure
o Business
Engagement
Model
o Roadmap
o COE Model
o Executive
Alignment
o Ongoing Data
Owners/ Steering
Committee
o Scope of Data Gov.
o Agile
Development
o Support
o Data Marts
17. Business Engagement
Retention
Services to ensure member growth and retention.
Continuous Engagement
Bi-weekly/monthly meetings. Engage the steering committee.
Update wiki with changes in business rules and policies. Support with
insights and enabling analyst with tools and technologies.
Exposure
Partnership brings insights by blending of Analytics team with the LOB. Exposure to analytical
tools, technologies, wiki, trainings, data governance and forums.
Discovery
Discover and document areas that can be streamlined and improved. Gap Analysis. Recommend
processes with definite wins on time and resources .
Roadmap
Roadmap of monthly/quarterly deliverables & business expectations.
Quick Wins
Set up measurable objectives, KPIs, suggest actions based on
lessons learned. Win on short term goals.
Expand with
continuous
engagement
Focus on roadmap
and specific
deliverables
Process
19. Roadmaps
Phase 1 (Q4 2015)
• Setup data-marts/ buckets
around account, member,
product and other objects
• Data Governance
framework – Data
definitions
• Eloqua Onboarding
dashboard/ reports setup
• Enabling LOBs with
Tableau
Phase 2 (Q1 2016)
•Member 360 Profile
•Data Integration &
Reporting framework for
Web/ Marketing
•Account Life Time Value
•Data Governance – Data
Challenges/ Standardization
Phase 3 (Q2 2016)
•Executive Dashboard for
all P&L LOBs
•Key business Insights
•Call center Performance
DB
• Data Governance -
control procedures
Phase 4 (Q3 2016)
•Predictive Modeling based
on member info
•Data Governance – data
management projects
Data Governance Ongoing Implementation
Enabling Tableau - Power Users Support
Process
20. Data Governance Program Scope Process
• Data Owners, Data Stewards and/ or Data Consumer
• Enterprise teams accountable and managedRoles & Responsibilities
• Data Owners assign one of the data classification (Public,
Internal Use, Confidential or Secret)
• Classify security impact (low, moderate or high) and reclassify
Data Classification
• Ensure Confidentiality, Integrity and Availability security policies
are met towards Enterprise data
• Classify into impact potential as: Low, Moderate or High
Security Policy
• Use Data Risk Matrix to classify appropriate risk category
Risk & Compliance Rules
• Bring data from various sources and then validating/transforming
them to ensure trust.Data Warehouse
• Ensure business rules on the Wiki page are current
• Ensure adequate documentation is posted on Wiki page for
quick reference
Business Rules & Documentation
• Identify, document, investigate and recommend solutions for
data quality issuesData Quality
• Managing customer/product master data
Master Data Management
DataGovernance
24. Improved Mortgage Loan Cycle Times
• Problem: Working with disparate data sources and a
complex process, the Mortgage Loan processing &
funding team needed a tool to help monitor, track and
measure loan cycle times across different loan stages and
cross functional teams.
• Solution: Designed an integrated solution. Using Alteryx
for data blending, logical flow and data formatting into
creating a Tableau extract for visualization.
25. Solution – LQB Dashboard
Mortgage Sales Ops team
managing loan processing and
funding cycle times
26. Sales Funnel
• Problem: Various leads originating from different
marketing channels. Need to analyze and help Marketing
team to focus on right channel to help member growth.
• Solution: Designed a solution using Tableau and Sales
Force that allowed complete view of end-to-end Sales
funnel in tracking and following up lead generations.
28. Learnings From Our Journey So Far…
Learnings
• Executive Alignment
• Business engagement and alignment
• Fail fast and quick wins (Agile Development)
Our strategic partners include HP, Microsoft, Amazon, Cisco, and Genentech.
With 40 branches in 8 states and another 6,500 branches & 30,000 ATMs through our CU Services Network, we provide a convenient, nation-wide solution. In fact, members who relocate internationally still maintain their relationship with First Tech (members in 21 countries).
The banking marketplace is tough. It’s fiercely competitive with consumers shopping around for the best rates possible and little differentiation among products. Financial institutions struggle to find the right balance between improving profitability and providing competitive pricing and an unmatched customer experience. Activities that focus on the customer experience – like lower fees, concierge services and enhanced agent support – can run counter to goals like lowering operational expenses and reducing labor costs. The key to achieving this balance is an enterprise wide commitment to data and analytics. Such a commitment will enable you to:
See problems coming and take steps to prevent them instead of being reactive and constantly fighting fires.
Foster a culture of fact-based decision making through all levels of the organization. Build a strategic analytic culture where analysis is part of your corporate DNA.
Deliver trusted information into the hands of decision makers in time for them to take action.
These goals, though lofty, are achievable – and necessary for organizations seeking to survive and thrive in today’s economy.
Wide spectrum of Member demographics – primarily tech savvy millenials
External & Internal members
Rapid growth rate in range of two digits, fastest in CU industry
Need to provide products and services that meets the needs of our members at right time of member life phases
Need to provide quick analytics to continue to grow, manage and sustain member
What are the Key ingredients of Analytics Culture
A strategic analytic culture starts and ends with executive management commitment. When executives are fully bought in to the concept of an analytic culture, they set goals, priorities and expectations based on the use of analytics. They invest in technology, people and processes that will continue to foster this culture.
Analytics Commitment - Companies with a strategic analytic culture set their business strategies based on what the analytics tell them. Every department needs to actively use analytics as appropriate for the responsibility and maturity of its function. Organizations with a strategic analytic culture are motivated to back up conclusions with data. It isn’t about instinct, but solid proof. Colleagues across the organization ask “why,” and demand data in response.
Commitment to Data management - Good analytics are pointless without good data. The foundation of a strategic analytic culture requires an organizational commitment to creating, cleansing, storing and accessing information from across the enterprise. And that means more than just being able to get to the data. It also means building common, agreed-upon definitions of key metrics, so that when executives review information they can spend their time making decisions rather than arguing about definitions.
Vision – People/ Process/ Technology === Combination of these three along with executive alignment all within a Data Governance framework from process standpoint.
Analytics Culture starts with creating a vision. This should include very clear benefits to the business and includes specific ROI. Just doing analytics for the sake of doing is not enough. It should be actionable and tied to the business value. In our case when we created the ROI, we lead with the marketing impact and how the investment will lead to increase in new membership as well as cross-sell and up-sell opportunities.
Roadmap – There should be a SMART roadmap associated with the vision. Specific, measureable, achievable, results-focused and time bound.
Sharing with the executive team to obtain their commitment. Nothing can succeed without strong executive commitment.
Also, sharing and socializing the vision within the organization to obtain alignment and finding some quick wins that can help create the momentum. E.g. in our case, we created a sales funnel dashboard that provided a visual view of leads, opportunities, funded accounts by channel, region, etc.
Technology is complex but still the easiest of the whole initiative. People and process part are more complex, where a whole of creative goes in.
Identified data sources to pull the data from.
Having tools to analyze the data and obtain insights
Most important is the take action on the insights. E.g. if you have figured out that a certain member has higher propensity to get an auto loan, that is not enough and you need to ensure that appropriate action is taken on that insight to put the right offer in front of the member using right channel and at the right time
We started first with set of technologies that will allow us to get to the insights based on the data that we already have. Quite often, I hear from business users that we want this data and that data before we can do anything. This did two things.
We were able to engage with the business in agile manner. Today we see quite some penetration in our business users of Tableau. Before most of the analysis was done using Excel and Access.
It allowed us to take start getting insights from the data that we already have in more or less pure form.
Then we started with the technologies that will allow us to take action based on the insights. This is where we invested in Marketing Automation and Website Personalization tools. Using Marketing Automation, we started automated onboarding program that sends out educational emails to our members educating them about our products and services. We are already starting to see the higher engagement with these members.
Architecture diagram
Organization
COE (Center of Excellence Model)
Enablement
Individual LOB scheduled / adhoc engagements
Initial Workflow Design & Scheduling
Adoption
Active Tableau Power User Community
Collaboration tool – Wiki Confluence
Evangelized Analytical Tools
Monthly Events/ Weekly Tableau User Group
Evangelized at Executive Level
Empowerment
Showcase advanced users workbook
Publish to Production
Organization
Assembling the passionate people
COE Model
Business Engagement
COE model
Dashboard Process Workflow
Engagement Model
Roadmap
Data Governance
Alignment at the highest level
Monthly Data Owners/Steering committee
Scope of Data Governance
Infrastructure
Agile Development
Support
Data Marts
Having a very pretty quick win dashboard that people can take as template
COE picture
Business Roadmap
Multiple business definitions for a member triggered need to establish Data Governance for standardizing definitions, business terminology and processes. In early stages, DG team has;
Established Data Governance Steering Council identifying CFO and CIO (Chief Investment Officer) as key stakeholders
Identified 35+ different data sources and assigned data owners, data stewards and data specialists
Formation of Data Stewards Council & engaging periodically to educate, train and prioritize with engaging key business units
Defined a practical Data Governance Road Map to ensure program sustainability and participation from key data stewards.
Daily 20 min stand up meeting to track daily progress, impediments and information associated to planned sprint stories. Colored sticky notes help identify the owner of the story and product.
Defined process for flow of data processing and managing project tasks
Designed Enterprise level dashboard that all BU’s could relate and consume.
Weekly Tableau Power Users group meetup internally
Tableau training day at multiple user locations for onboarding
Support engaged advanced users.
Tableau adoption trend since beginning of year 2015 has phenomenally increased from initial 10% in Feb to over 46% of total employees ending September.
Failures
Data marts
Executive Alignment (Marito and Hank sooner)
Engagement with the business
Setting expectations
Successes
Quick Prototyping
Agile approach