Download as PDF, PPTX


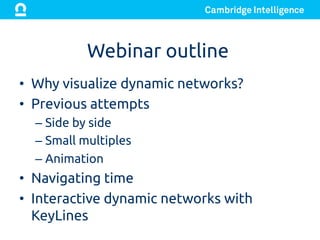

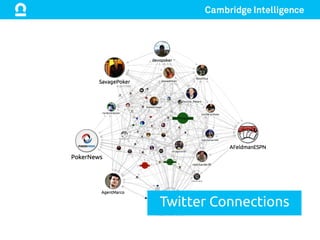

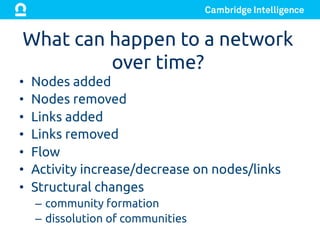

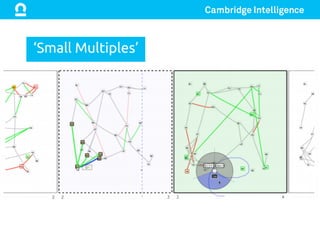

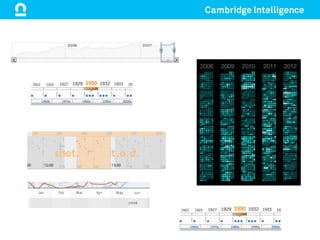
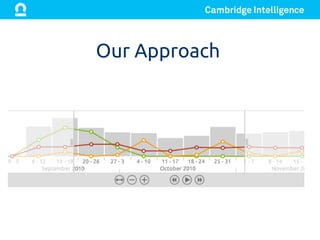
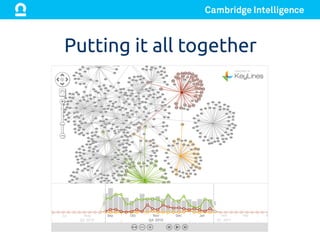


The document discusses Cambridge Intelligence's Keylines, a network visualization tool designed for dynamic networks. It highlights the importance of visualizing changes in networks over time, such as node and link alterations, and the benefits of using Keylines to navigate temporal data effectively. The presentation emphasizes overcoming static visualization limitations and enabling users to identify trends and patterns more dynamically.