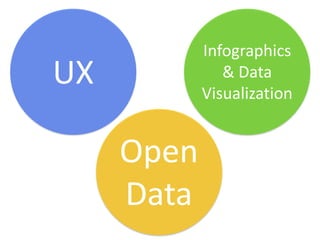
This document discusses infographics, data visualization, and their relationship to user experience (UX) processes. It notes that while infographics and data visualization involve telling stories with data, they do not always follow standard UX processes. The document explores why audiences seem to have an easier time learning about information from infographics compared to more technical UX topics. It also references open data and open data portals.