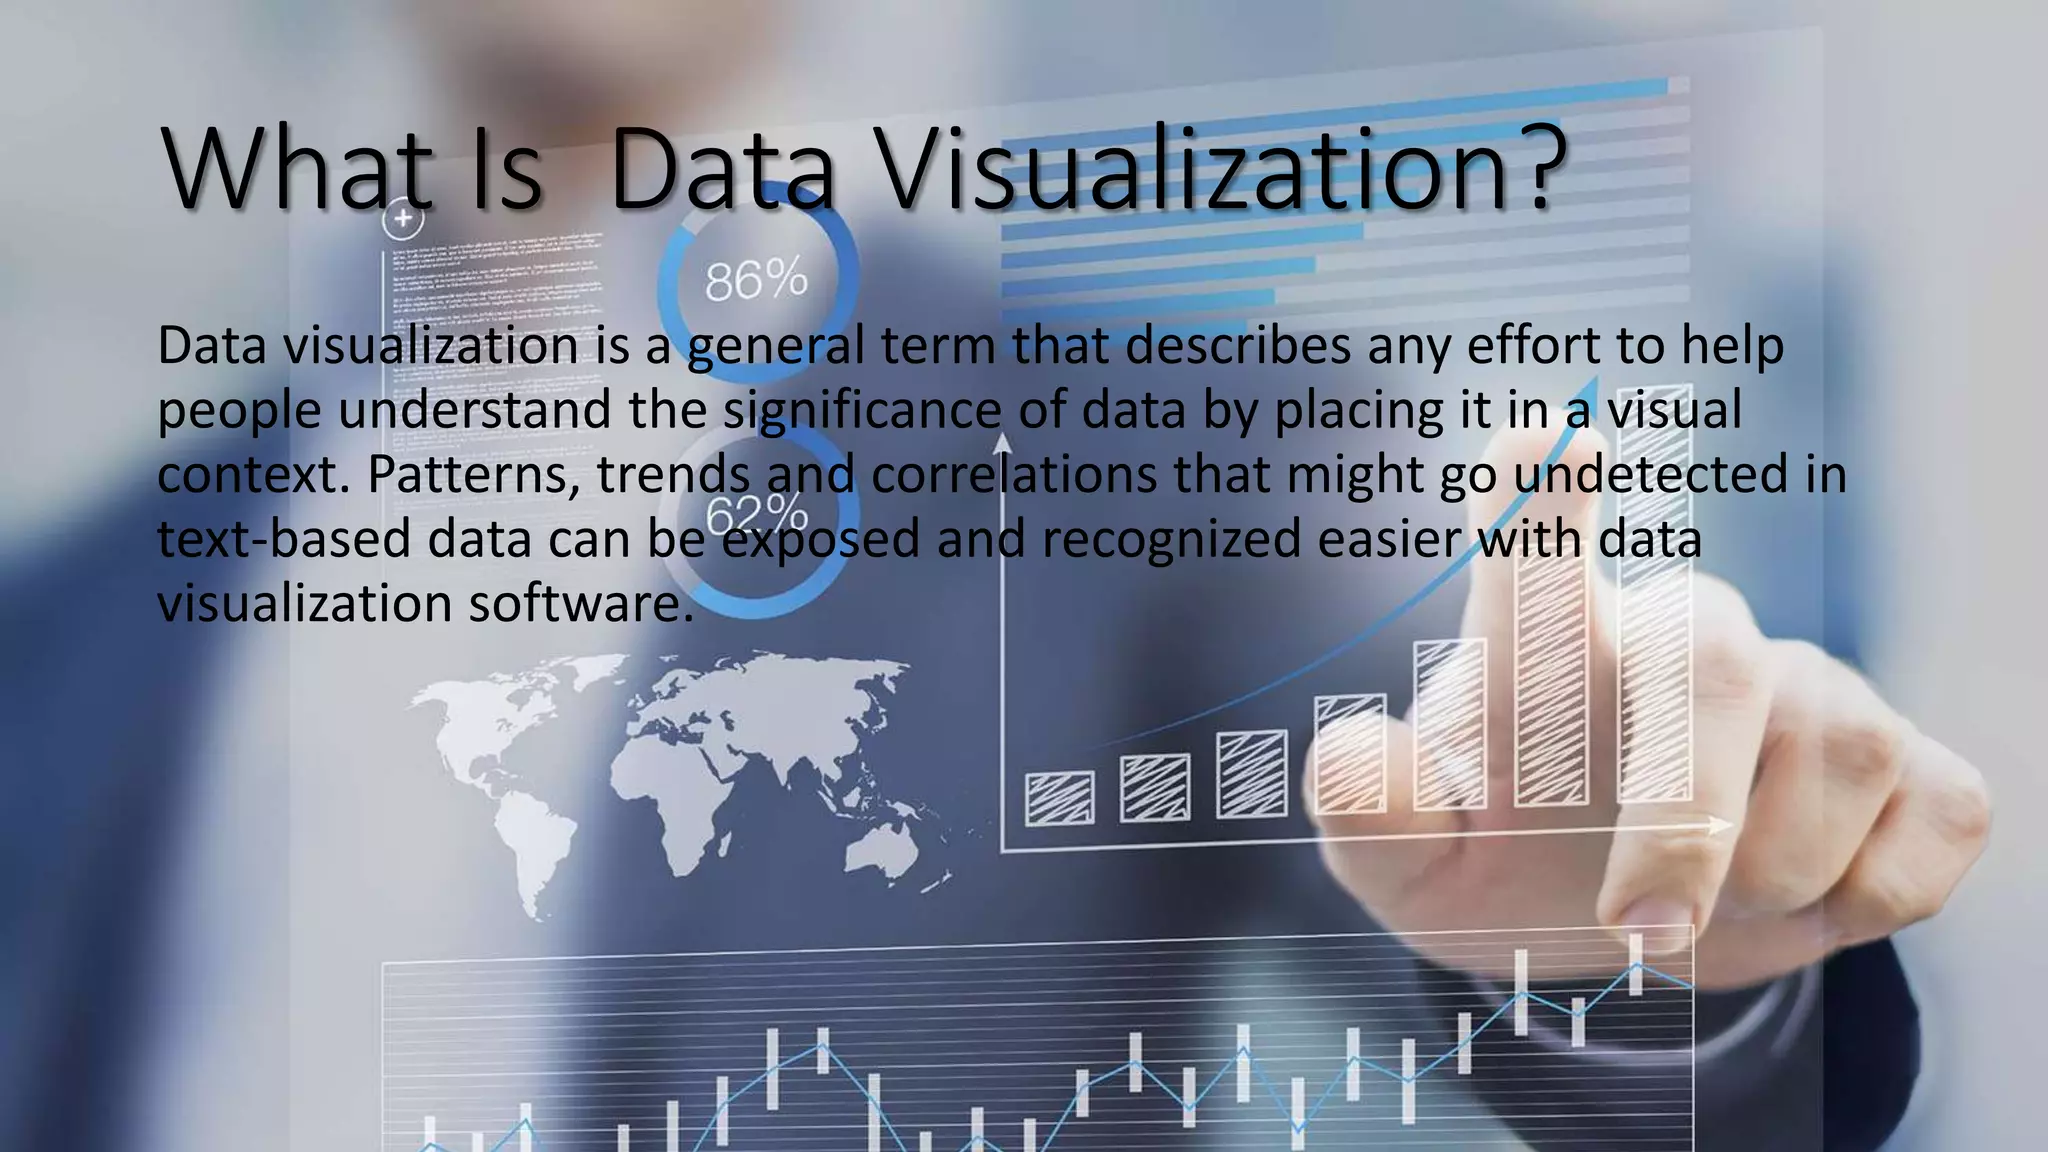
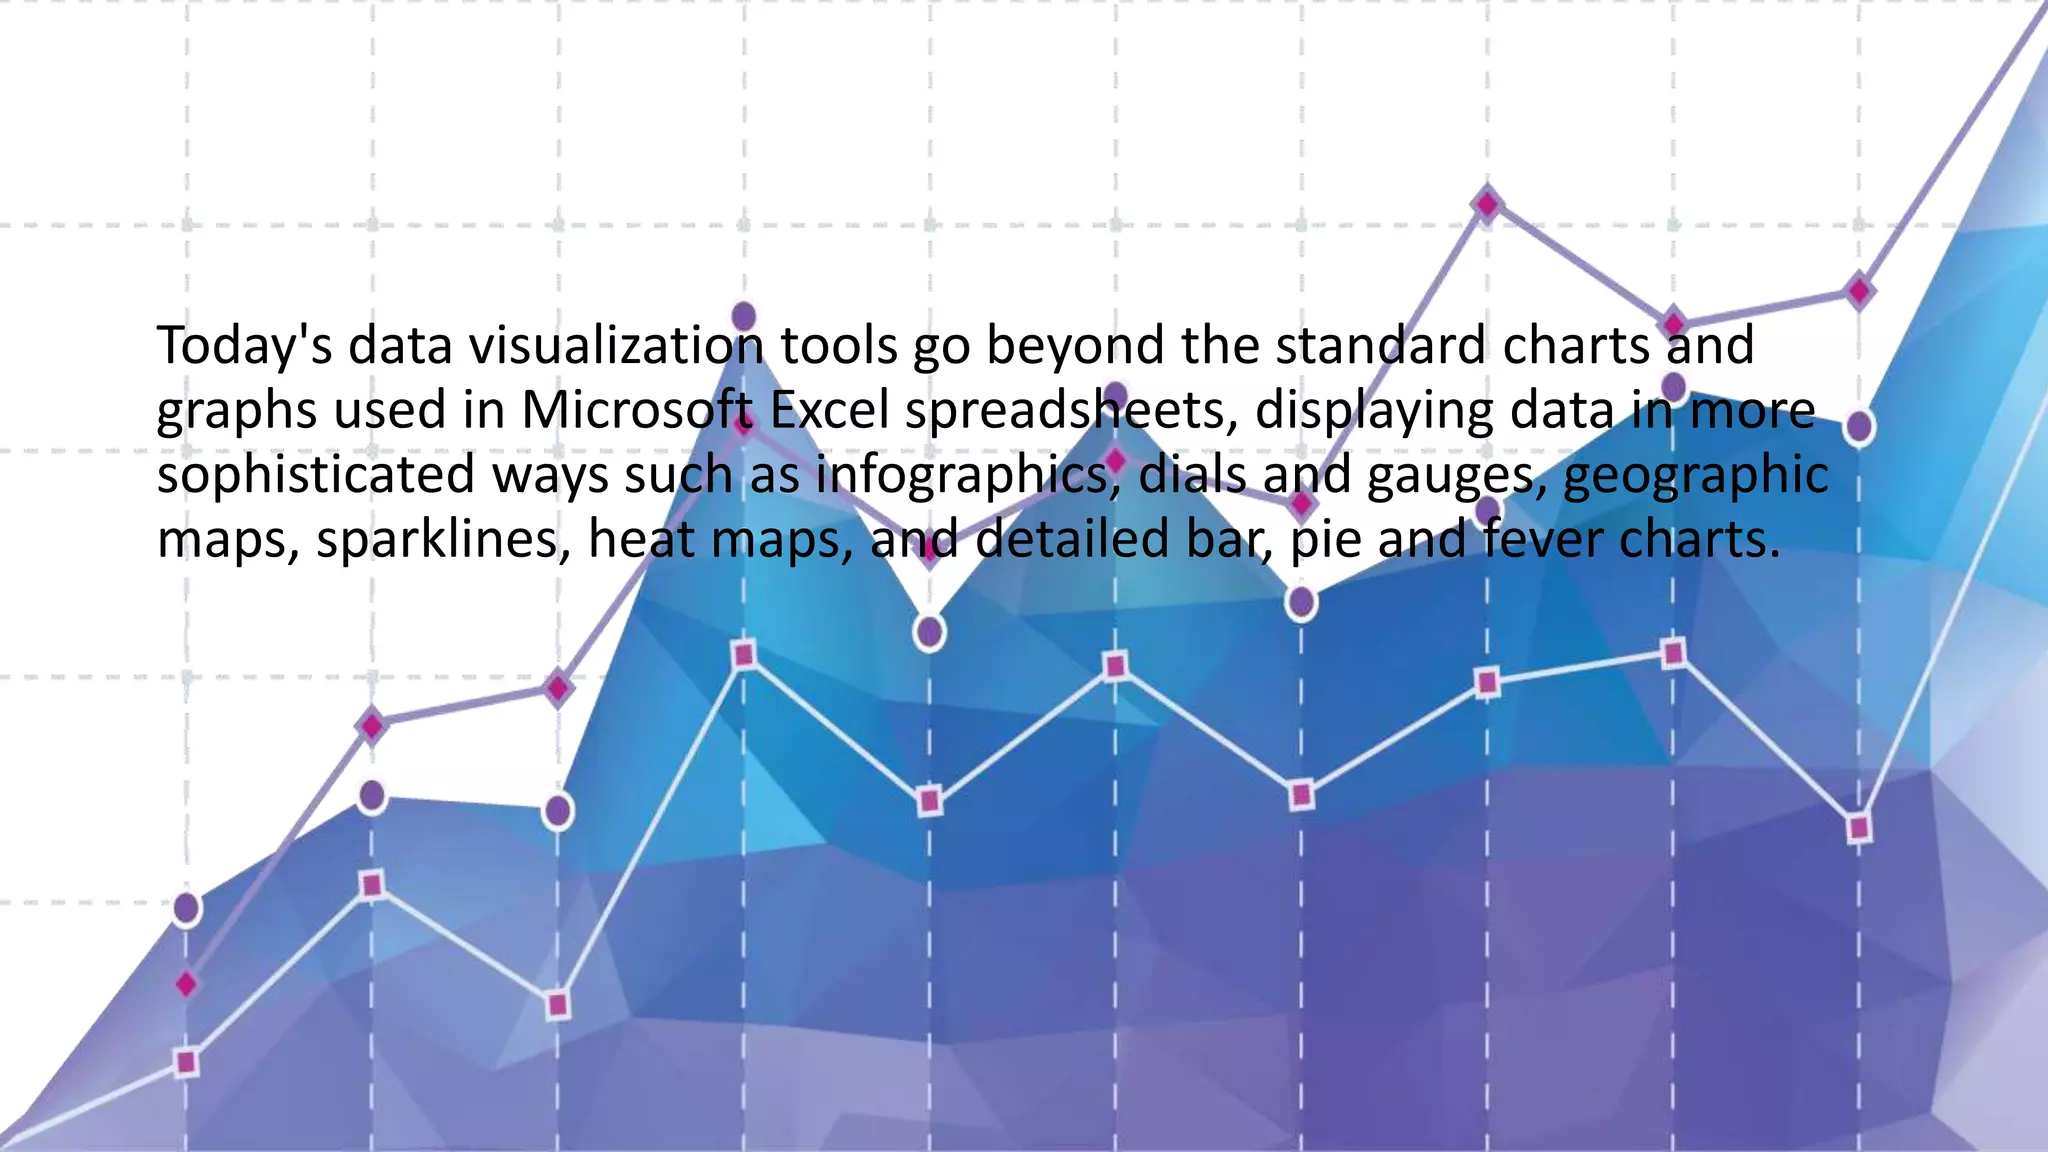
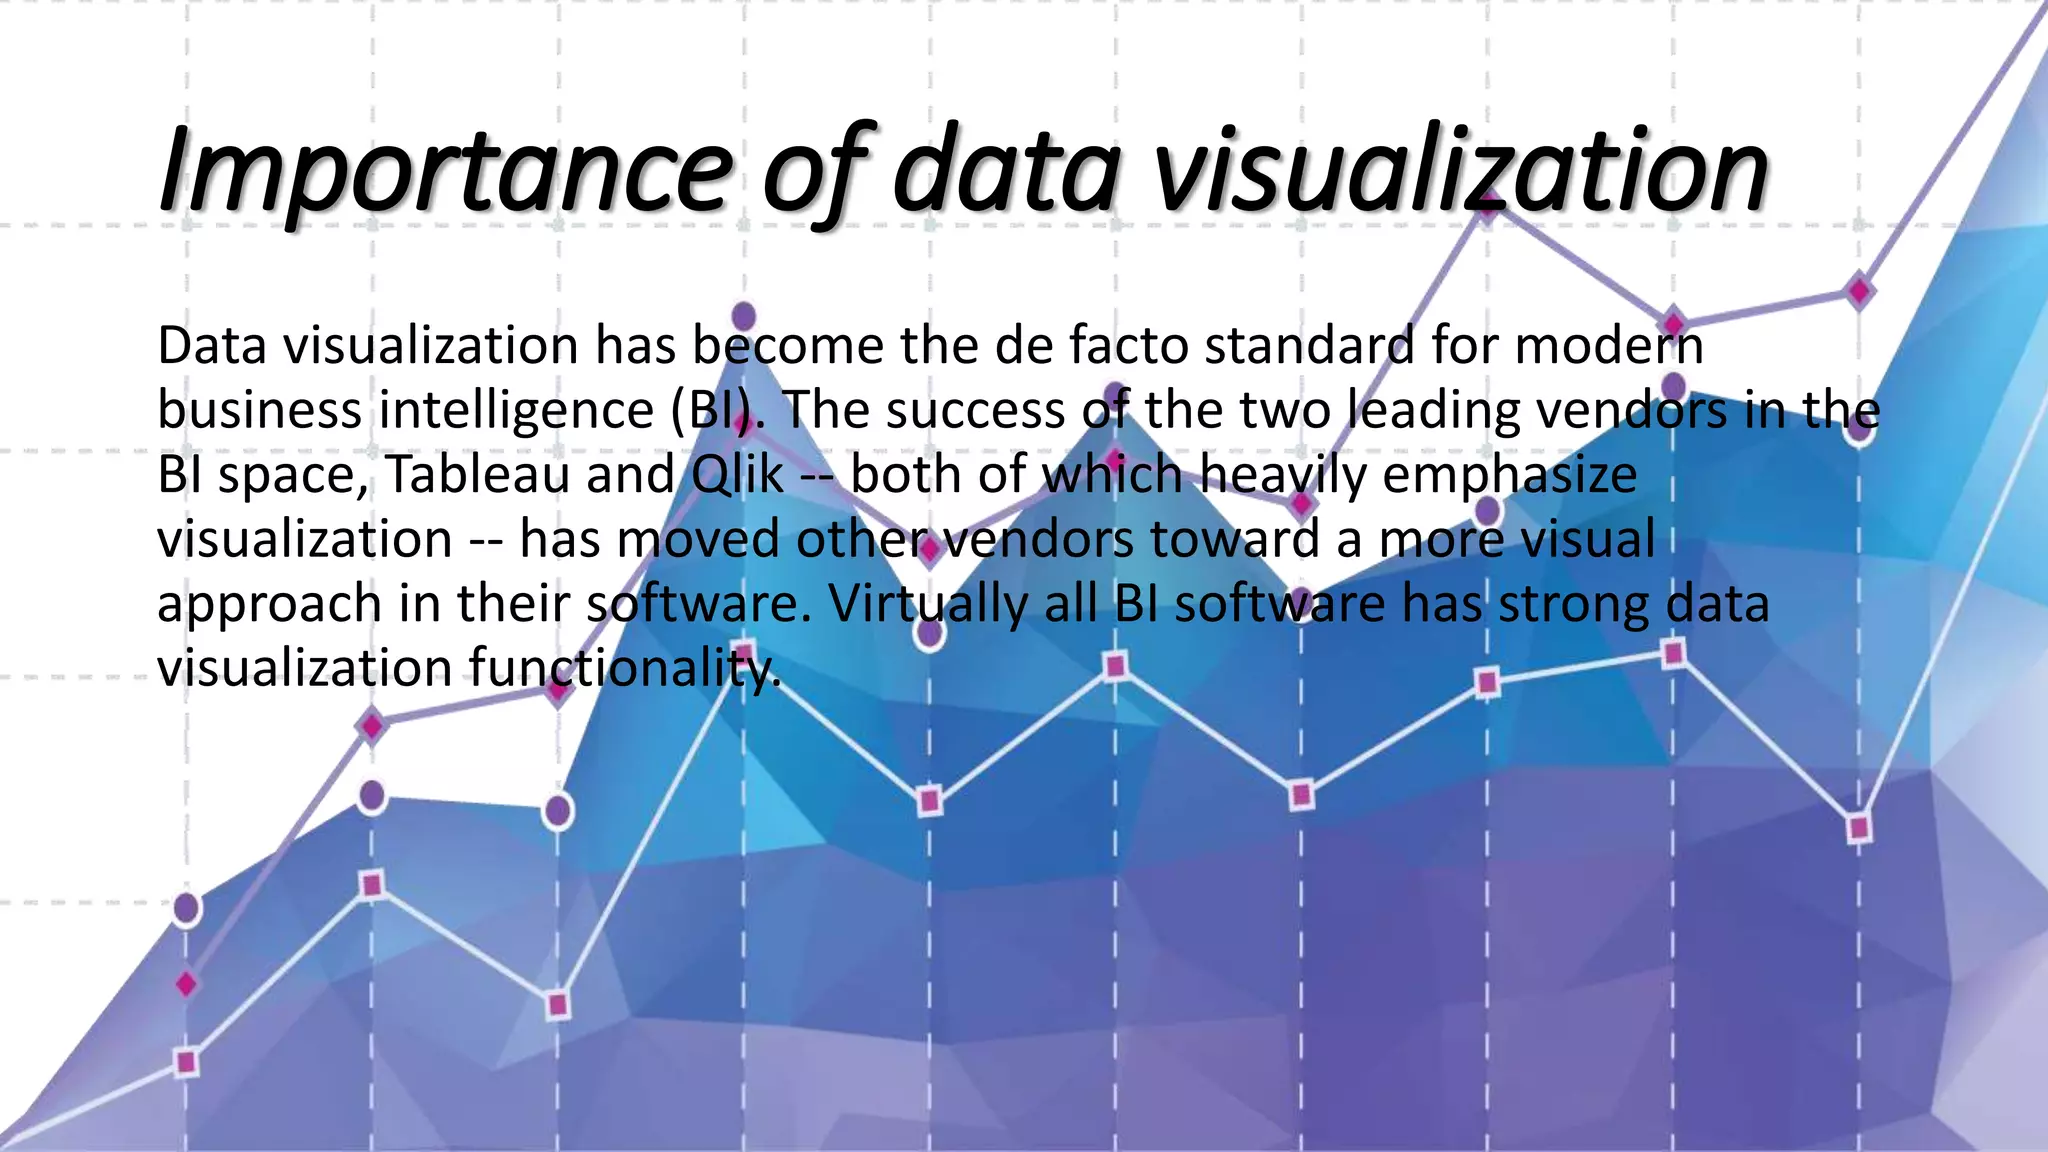
SlideShare a Scribd company logo
1 of 14
The beauty of data
visualization
Debashish Jana
What Is Data Visualization?
Data visualization is a general term that describes any effort to help
people understand the significance of data by placing it in a visual
context. Patterns, trends and correlations that might go undetected in
text-based data can be exposed and recognized easier with data
visualization software.
Today's data visualization tools go beyond the standard charts and
graphs used in Microsoft Excel spreadsheets, displaying data in more
sophisticated ways such as infographics, dials and gauges, geographic
maps, sparklines, heat maps, and detailed bar, pie and fever charts.
Importance of data visualization
Data visualization has become the de facto standard for modern
business intelligence (BI). The success of the two leading vendors in the
BI space, Tableau and Qlik -- both of which heavily emphasize
visualization -- has moved other vendors toward a more visual
approach in their software. Virtually all BI software has strong data
visualization functionality.
Data visualization tools have been important in democratizing data and
analytics and making data-driven insights available to workers
throughout an organization. They are typically easier to operate than
traditional statistical analysis software or earlier versions of BI
software. This has led to a rise in lines of business implementing data
visualization tools on their own, without support from IT.
History of Data Visualization
The concept of using pictures to understand data has been around for
centuries, from maps and graphs in the 17th century to the invention
of the pie chart in the early 1800s. Several decades later, one of the
most cited examples of statistical graphics occurred when Charles
Minard mapped Napoleon’s invasion of Russia. The map depicted the
size of the army as well as the path of Napoleon’s retreat from Moscow
– and tied that information to temperature and time scales for a more
in-depth understanding of the event.
Examples of data visualization
Many business departments implement data visualization software to
track their own initiatives. For example, a marketing team might
implement the software to monitor the performance of an email
campaign, tracking metrics like open rate, click-through rate and
conversion rate.
How data visualization works
Data visualization software allows the user to select the best way of
presenting the data, but, increasingly, software automates this step.
Some tools automatically interpret the shape of the data and detect
correlations between certain variables and then place these discoveries
into the chart type that the software determines is optimal.
Informative: The most basic function of a report is to inform the
consumer of something and a picture can do this in a universal way.
Efficient: Perhaps the biggest benefit of utilizing data visualizations is
the efficiency gained through proper execution. A well designed visual
will save the data analyst precious time as it can communicate the
message of the data concisely and without ambiguity.
Appealing: Much like a masterpiece draws the viewer in and captivates
their thoughts as they gaze at the picture, properly designed data
visualizations will draw you in and lead you to the intended conclusion
in a visually pleasing way.
Why data visualization and reporting tools
are important for business users?
Visualized data reporting help to effectively research on customer
profile such as age, behaviors, landing page, actions and many other
things that improve digital marketing efforts. And it’s really important
for any size business to compare, analyze and boost business growth
pattern with data visualization.
Know the following benefits and you will
understand why data visualization is
needed?
Data visualization tools are effective to understand complex data and
multi-dimensional data. Data visualization helps to visualize trending
data in application and website on the internet. And anyone can use
data visualization techniques to discover insights and new conclusions.
The Beauty of Data Visualization: Understanding Complex Data

More Related Content

What's hot

Data visualisation
Data visualisationData visualisation
Data visualisationDivek Bhatia
 
Data Mining Services in various types
Data Mining Services in various typesData Mining Services in various types
Data Mining Services in various typesloginworks software
 
Simplify your analytics strategy
Simplify your analytics strategy Simplify your analytics strategy
Simplify your analytics strategy GURJOT SINGH
 
Acem cse data analytics (1)
Acem cse data analytics (1)Acem cse data analytics (1)
Acem cse data analytics (1)Aastha Kohli
 
The Beauty Of Data visualisation
The Beauty Of Data visualisationThe Beauty Of Data visualisation
The Beauty Of Data visualisationTanayKarnik1
 
Enterprise 2.0 & Deloitte Webinar
Enterprise 2.0 & Deloitte WebinarEnterprise 2.0 & Deloitte Webinar
Enterprise 2.0 & Deloitte WebinarRoss Mayfield
 
New White Paper by Jim Sterne and Anametrix - From Data Scientist to Data Artist
New White Paper by Jim Sterne and Anametrix - From Data Scientist to Data ArtistNew White Paper by Jim Sterne and Anametrix - From Data Scientist to Data Artist
New White Paper by Jim Sterne and Anametrix - From Data Scientist to Data ArtistAnametrix
 
Esri Maps for Dynamics CRM
Esri Maps for Dynamics CRMEsri Maps for Dynamics CRM
Esri Maps for Dynamics CRMEsri
 
Driving the future of big data | PromptCloud
Driving the future of big data | PromptCloudDriving the future of big data | PromptCloud
Driving the future of big data | PromptCloudPromptCloud
 
Building the Cognitive Era : Big Data Strategies
Building the Cognitive Era : Big Data StrategiesBuilding the Cognitive Era : Big Data Strategies
Building the Cognitive Era : Big Data StrategiesKevin Sigliano
 
Anastasiya Kochepasova's program manager
Anastasiya Kochepasova's program managerAnastasiya Kochepasova's program manager
Anastasiya Kochepasova's program managerAnastasiya Kochepasova
 
Jason Greenwood - Digital Transformation NZ Conference 2018 Presentation
Jason Greenwood - Digital Transformation NZ Conference 2018 PresentationJason Greenwood - Digital Transformation NZ Conference 2018 Presentation
Jason Greenwood - Digital Transformation NZ Conference 2018 PresentationJason Greenwood
 
How to identify the Return on Investment of Big Data
How to identify the Return on Investment of Big DataHow to identify the Return on Investment of Big Data
How to identify the Return on Investment of Big DataJose Pablo Fernandez
 

What's hot (20)

Data visualisation
Data visualisationData visualisation
Data visualisation
 
Data analytics courses
Data analytics coursesData analytics courses
Data analytics courses
 
Mapidea
MapideaMapidea
Mapidea
 
SMAC
SMACSMAC
SMAC
 
QlikView and Location / Map Intelligence
QlikView and Location / Map IntelligenceQlikView and Location / Map Intelligence
QlikView and Location / Map Intelligence
 
Data Mining Services in various types
Data Mining Services in various typesData Mining Services in various types
Data Mining Services in various types
 
Simplify your analytics strategy
Simplify your analytics strategy Simplify your analytics strategy
Simplify your analytics strategy
 
Acem cse data analytics (1)
Acem cse data analytics (1)Acem cse data analytics (1)
Acem cse data analytics (1)
 
The Beauty Of Data visualisation
The Beauty Of Data visualisationThe Beauty Of Data visualisation
The Beauty Of Data visualisation
 
BIG DATA – Beyond the Hype
BIG DATA – Beyond the HypeBIG DATA – Beyond the Hype
BIG DATA – Beyond the Hype
 
Analytics
AnalyticsAnalytics
Analytics
 
Enterprise 2.0 & Deloitte Webinar
Enterprise 2.0 & Deloitte WebinarEnterprise 2.0 & Deloitte Webinar
Enterprise 2.0 & Deloitte Webinar
 
Contour BI
Contour BIContour BI
Contour BI
 
New White Paper by Jim Sterne and Anametrix - From Data Scientist to Data Artist
New White Paper by Jim Sterne and Anametrix - From Data Scientist to Data ArtistNew White Paper by Jim Sterne and Anametrix - From Data Scientist to Data Artist
New White Paper by Jim Sterne and Anametrix - From Data Scientist to Data Artist
 
Esri Maps for Dynamics CRM
Esri Maps for Dynamics CRMEsri Maps for Dynamics CRM
Esri Maps for Dynamics CRM
 
Driving the future of big data | PromptCloud
Driving the future of big data | PromptCloudDriving the future of big data | PromptCloud
Driving the future of big data | PromptCloud
 
Building the Cognitive Era : Big Data Strategies
Building the Cognitive Era : Big Data StrategiesBuilding the Cognitive Era : Big Data Strategies
Building the Cognitive Era : Big Data Strategies
 
Anastasiya Kochepasova's program manager
Anastasiya Kochepasova's program managerAnastasiya Kochepasova's program manager
Anastasiya Kochepasova's program manager
 
Jason Greenwood - Digital Transformation NZ Conference 2018 Presentation
Jason Greenwood - Digital Transformation NZ Conference 2018 PresentationJason Greenwood - Digital Transformation NZ Conference 2018 Presentation
Jason Greenwood - Digital Transformation NZ Conference 2018 Presentation
 
How to identify the Return on Investment of Big Data
How to identify the Return on Investment of Big DataHow to identify the Return on Investment of Big Data
How to identify the Return on Investment of Big Data
 

Similar to The Beauty of Data Visualization: Understanding Complex Data

What is data visualization
What is data visualizationWhat is data visualization
What is data visualizationintellect808
 
The Value of Data Visualization for Data Science Professionals.pdf
The Value of Data Visualization for Data Science Professionals.pdfThe Value of Data Visualization for Data Science Professionals.pdf
The Value of Data Visualization for Data Science Professionals.pdfData Science Council of America
 
Excellencein visualization
Excellencein visualizationExcellencein visualization
Excellencein visualizationamuthadeepa
 
Operational Analytics: Best Software For Sourcing Actionable Insights 2013
Operational Analytics: Best Software For Sourcing Actionable Insights 2013Operational Analytics: Best Software For Sourcing Actionable Insights 2013
Operational Analytics: Best Software For Sourcing Actionable Insights 2013Newton Day Uploads
 
Excellence in visulization
Excellence in visulizationExcellence in visulization
Excellence in visulizationArchanaMani2
 
Tableau Tutorial Complete by Rohit Dubey
Tableau Tutorial Complete by Rohit DubeyTableau Tutorial Complete by Rohit Dubey
Tableau Tutorial Complete by Rohit Dubeykiranrajat
 
Emerging Trends In Data Analysis And Visualisation
Emerging Trends In Data Analysis And VisualisationEmerging Trends In Data Analysis And Visualisation
Emerging Trends In Data Analysis And VisualisationVinay Kumar
 
ADV: Solving the data visualization dilemma
ADV: Solving the data visualization dilemmaADV: Solving the data visualization dilemma
ADV: Solving the data visualization dilemmaGrant Thornton LLP
 
Mobile Enterprise Analytics in 60 Minutes
Mobile Enterprise Analytics in 60 MinutesMobile Enterprise Analytics in 60 Minutes
Mobile Enterprise Analytics in 60 MinutesCognizant
 
The Path to Manageable Data - Going Beyond the Three V’s of Big Data
The Path to Manageable Data - Going Beyond the Three V’s of Big DataThe Path to Manageable Data - Going Beyond the Three V’s of Big Data
The Path to Manageable Data - Going Beyond the Three V’s of Big DataConnexica
 
Big Data BizViz Analytics Platform Introduction
Big Data BizViz Analytics Platform IntroductionBig Data BizViz Analytics Platform Introduction
Big Data BizViz Analytics Platform IntroductionBig Data BizViz LLC
 
Transformation of bi through ai and ml democratization
Transformation of bi through ai and ml democratizationTransformation of bi through ai and ml democratization
Transformation of bi through ai and ml democratizationajaygajjelli
 
What exactly is real-time data visualization?
What exactly is real-time data visualization?What exactly is real-time data visualization?
What exactly is real-time data visualization?Grow
 
Data Visualization & Why it is Important in Your Business
Data Visualization & Why it is Important in Your BusinessData Visualization & Why it is Important in Your Business
Data Visualization & Why it is Important in Your BusinessDigital Dialogue
 
freeDatamap presentation - data visualization BI & GIS -
freeDatamap presentation - data visualization BI & GIS -freeDatamap presentation - data visualization BI & GIS -
freeDatamap presentation - data visualization BI & GIS -free datamap
 
Business intelligence
Business intelligenceBusiness intelligence
Business intelligenceshreeuva
 

Similar to The Beauty of Data Visualization: Understanding Complex Data (20)

What is data visualization
What is data visualizationWhat is data visualization
What is data visualization
 
The Value of Data Visualization for Data Science Professionals.pdf
The Value of Data Visualization for Data Science Professionals.pdfThe Value of Data Visualization for Data Science Professionals.pdf
The Value of Data Visualization for Data Science Professionals.pdf
 
Excellencein visualization
Excellencein visualizationExcellencein visualization
Excellencein visualization
 
Operational Analytics: Best Software For Sourcing Actionable Insights 2013
Operational Analytics: Best Software For Sourcing Actionable Insights 2013Operational Analytics: Best Software For Sourcing Actionable Insights 2013
Operational Analytics: Best Software For Sourcing Actionable Insights 2013
 
Excellence in visulization
Excellence in visulizationExcellence in visulization
Excellence in visulization
 
Tableau Tutorial Complete by Rohit Dubey
Tableau Tutorial Complete by Rohit DubeyTableau Tutorial Complete by Rohit Dubey
Tableau Tutorial Complete by Rohit Dubey
 
Emerging Trends In Data Analysis And Visualisation
Emerging Trends In Data Analysis And VisualisationEmerging Trends In Data Analysis And Visualisation
Emerging Trends In Data Analysis And Visualisation
 
ADV: Solving the data visualization dilemma
ADV: Solving the data visualization dilemmaADV: Solving the data visualization dilemma
ADV: Solving the data visualization dilemma
 
Data Visualization
Data VisualizationData Visualization
Data Visualization
 
Mobile Enterprise Analytics in 60 Minutes
Mobile Enterprise Analytics in 60 MinutesMobile Enterprise Analytics in 60 Minutes
Mobile Enterprise Analytics in 60 Minutes
 
Big Data
Big DataBig Data
Big Data
 
The Path to Manageable Data - Going Beyond the Three V’s of Big Data
The Path to Manageable Data - Going Beyond the Three V’s of Big DataThe Path to Manageable Data - Going Beyond the Three V’s of Big Data
The Path to Manageable Data - Going Beyond the Three V’s of Big Data
 
Big Data BizViz Analytics Platform Introduction
Big Data BizViz Analytics Platform IntroductionBig Data BizViz Analytics Platform Introduction
Big Data BizViz Analytics Platform Introduction
 
Transformation of bi through ai and ml democratization
Transformation of bi through ai and ml democratizationTransformation of bi through ai and ml democratization
Transformation of bi through ai and ml democratization
 
What exactly is real-time data visualization?
What exactly is real-time data visualization?What exactly is real-time data visualization?
What exactly is real-time data visualization?
 
Data Visualization & Why it is Important in Your Business
Data Visualization & Why it is Important in Your BusinessData Visualization & Why it is Important in Your Business
Data Visualization & Why it is Important in Your Business
 
Visual discovery tools
Visual discovery toolsVisual discovery tools
Visual discovery tools
 
freeDatamap presentation - data visualization BI & GIS -
freeDatamap presentation - data visualization BI & GIS -freeDatamap presentation - data visualization BI & GIS -
freeDatamap presentation - data visualization BI & GIS -
 
Business intelligence
Business intelligenceBusiness intelligence
Business intelligence
 
Business intelligence
Business intelligenceBusiness intelligence
Business intelligence
 

More from Debashish Jana

More from Debashish Jana (10)

Lies damned lies and statistics
Lies damned lies and statisticsLies damned lies and statistics
Lies damned lies and statistics
 
Data to make hit tv show
Data to make hit tv showData to make hit tv show
Data to make hit tv show
 
Guide to data analytics
Guide to data analyticsGuide to data analytics
Guide to data analytics
 
Bad statistics
Bad statisticsBad statistics
Bad statistics
 
Predictive analytics
Predictive analyticsPredictive analytics
Predictive analytics
 
Data communication
Data communicationData communication
Data communication
 
Make data more human
Make data more humanMake data more human
Make data more human
 
How to start thinking like a data scientist
How to start thinking like a data scientistHow to start thinking like a data scientist
How to start thinking like a data scientist
 
Big data
Big dataBig data
Big data
 
Data analysis
Data analysisData analysis
Data analysis
 

Recently uploaded

RS 9000 Call In girls Dwarka Mor (DELHI)⇛9711147426🔝Delhi
RS 9000 Call In girls Dwarka Mor (DELHI)⇛9711147426🔝DelhiRS 9000 Call In girls Dwarka Mor (DELHI)⇛9711147426🔝Delhi
RS 9000 Call In girls Dwarka Mor (DELHI)⇛9711147426🔝Delhijennyeacort
 
INTERNSHIP ON PURBASHA COMPOSITE TEX LTD
INTERNSHIP ON PURBASHA COMPOSITE TEX LTDINTERNSHIP ON PURBASHA COMPOSITE TEX LTD
INTERNSHIP ON PURBASHA COMPOSITE TEX LTDRafezzaman
 
NLP Data Science Project Presentation:Predicting Heart Disease with NLP Data ...
NLP Data Science Project Presentation:Predicting Heart Disease with NLP Data ...NLP Data Science Project Presentation:Predicting Heart Disease with NLP Data ...
NLP Data Science Project Presentation:Predicting Heart Disease with NLP Data ...Boston Institute of Analytics
 
办理学位证纽约大学毕业证(NYU毕业证书)原版一比一
办理学位证纽约大学毕业证(NYU毕业证书)原版一比一办理学位证纽约大学毕业证(NYU毕业证书)原版一比一
办理学位证纽约大学毕业证(NYU毕业证书)原版一比一fhwihughh
 
Amazon TQM (2) Amazon TQM (2)Amazon TQM (2).pptx
Amazon TQM (2) Amazon TQM (2)Amazon TQM (2).pptxAmazon TQM (2) Amazon TQM (2)Amazon TQM (2).pptx
Amazon TQM (2) Amazon TQM (2)Amazon TQM (2).pptxAbdelrhman abooda
 
办理学位证中佛罗里达大学毕业证,UCF成绩单原版一比一
办理学位证中佛罗里达大学毕业证,UCF成绩单原版一比一办理学位证中佛罗里达大学毕业证,UCF成绩单原版一比一
办理学位证中佛罗里达大学毕业证,UCF成绩单原版一比一F sss
 
Customer Service Analytics - Make Sense of All Your Data.pptx
Customer Service Analytics - Make Sense of All Your Data.pptxCustomer Service Analytics - Make Sense of All Your Data.pptx
Customer Service Analytics - Make Sense of All Your Data.pptxEmmanuel Dauda
 
Generative AI for Social Good at Open Data Science East 2024
Generative AI for Social Good at Open Data Science East 2024Generative AI for Social Good at Open Data Science East 2024
Generative AI for Social Good at Open Data Science East 2024Colleen Farrelly
 
9711147426✨Call In girls Gurgaon Sector 31. SCO 25 escort service
9711147426✨Call In girls Gurgaon Sector 31. SCO 25 escort service9711147426✨Call In girls Gurgaon Sector 31. SCO 25 escort service
9711147426✨Call In girls Gurgaon Sector 31. SCO 25 escort servicejennyeacort
 
dokumen.tips_chapter-4-transient-heat-conduction-mehmet-kanoglu.ppt
dokumen.tips_chapter-4-transient-heat-conduction-mehmet-kanoglu.pptdokumen.tips_chapter-4-transient-heat-conduction-mehmet-kanoglu.ppt
dokumen.tips_chapter-4-transient-heat-conduction-mehmet-kanoglu.pptSonatrach
 
DBA Basics: Getting Started with Performance Tuning.pdf
DBA Basics: Getting Started with Performance Tuning.pdfDBA Basics: Getting Started with Performance Tuning.pdf
DBA Basics: Getting Started with Performance Tuning.pdfJohn Sterrett
 
1:1定制(UQ毕业证)昆士兰大学毕业证成绩单修改留信学历认证原版一模一样
1:1定制(UQ毕业证)昆士兰大学毕业证成绩单修改留信学历认证原版一模一样1:1定制(UQ毕业证)昆士兰大学毕业证成绩单修改留信学历认证原版一模一样
1:1定制(UQ毕业证)昆士兰大学毕业证成绩单修改留信学历认证原版一模一样vhwb25kk
 
9654467111 Call Girls In Munirka Hotel And Home Service
9654467111 Call Girls In Munirka Hotel And Home Service9654467111 Call Girls In Munirka Hotel And Home Service
9654467111 Call Girls In Munirka Hotel And Home ServiceSapana Sha
 
ASML's Taxonomy Adventure by Daniel Canter
ASML's Taxonomy Adventure by Daniel CanterASML's Taxonomy Adventure by Daniel Canter
ASML's Taxonomy Adventure by Daniel Cantervoginip
 
From idea to production in a day – Leveraging Azure ML and Streamlit to build...
From idea to production in a day – Leveraging Azure ML and Streamlit to build...From idea to production in a day – Leveraging Azure ML and Streamlit to build...
From idea to production in a day – Leveraging Azure ML and Streamlit to build...Florian Roscheck
 
EMERCE - 2024 - AMSTERDAM - CROSS-PLATFORM TRACKING WITH GOOGLE ANALYTICS.pptx
EMERCE - 2024 - AMSTERDAM - CROSS-PLATFORM  TRACKING WITH GOOGLE ANALYTICS.pptxEMERCE - 2024 - AMSTERDAM - CROSS-PLATFORM  TRACKING WITH GOOGLE ANALYTICS.pptx
EMERCE - 2024 - AMSTERDAM - CROSS-PLATFORM TRACKING WITH GOOGLE ANALYTICS.pptxthyngster
 
High Class Call Girls Noida Sector 39 Aarushi 🔝8264348440🔝 Independent Escort...
High Class Call Girls Noida Sector 39 Aarushi 🔝8264348440🔝 Independent Escort...High Class Call Girls Noida Sector 39 Aarushi 🔝8264348440🔝 Independent Escort...
High Class Call Girls Noida Sector 39 Aarushi 🔝8264348440🔝 Independent Escort...soniya singh
 
毕业文凭制作#回国入职#diploma#degree澳洲中央昆士兰大学毕业证成绩单pdf电子版制作修改#毕业文凭制作#回国入职#diploma#degree
毕业文凭制作#回国入职#diploma#degree澳洲中央昆士兰大学毕业证成绩单pdf电子版制作修改#毕业文凭制作#回国入职#diploma#degree毕业文凭制作#回国入职#diploma#degree澳洲中央昆士兰大学毕业证成绩单pdf电子版制作修改#毕业文凭制作#回国入职#diploma#degree
毕业文凭制作#回国入职#diploma#degree澳洲中央昆士兰大学毕业证成绩单pdf电子版制作修改#毕业文凭制作#回国入职#diploma#degreeyuu sss
 

Recently uploaded (20)

RS 9000 Call In girls Dwarka Mor (DELHI)⇛9711147426🔝Delhi
RS 9000 Call In girls Dwarka Mor (DELHI)⇛9711147426🔝DelhiRS 9000 Call In girls Dwarka Mor (DELHI)⇛9711147426🔝Delhi
RS 9000 Call In girls Dwarka Mor (DELHI)⇛9711147426🔝Delhi
 
E-Commerce Order PredictionShraddha Kamble.pptx
E-Commerce Order PredictionShraddha Kamble.pptxE-Commerce Order PredictionShraddha Kamble.pptx
E-Commerce Order PredictionShraddha Kamble.pptx
 
INTERNSHIP ON PURBASHA COMPOSITE TEX LTD
INTERNSHIP ON PURBASHA COMPOSITE TEX LTDINTERNSHIP ON PURBASHA COMPOSITE TEX LTD
INTERNSHIP ON PURBASHA COMPOSITE TEX LTD
 
NLP Data Science Project Presentation:Predicting Heart Disease with NLP Data ...
NLP Data Science Project Presentation:Predicting Heart Disease with NLP Data ...NLP Data Science Project Presentation:Predicting Heart Disease with NLP Data ...
NLP Data Science Project Presentation:Predicting Heart Disease with NLP Data ...
 
办理学位证纽约大学毕业证(NYU毕业证书)原版一比一
办理学位证纽约大学毕业证(NYU毕业证书)原版一比一办理学位证纽约大学毕业证(NYU毕业证书)原版一比一
办理学位证纽约大学毕业证(NYU毕业证书)原版一比一
 
Amazon TQM (2) Amazon TQM (2)Amazon TQM (2).pptx
Amazon TQM (2) Amazon TQM (2)Amazon TQM (2).pptxAmazon TQM (2) Amazon TQM (2)Amazon TQM (2).pptx
Amazon TQM (2) Amazon TQM (2)Amazon TQM (2).pptx
 
办理学位证中佛罗里达大学毕业证,UCF成绩单原版一比一
办理学位证中佛罗里达大学毕业证,UCF成绩单原版一比一办理学位证中佛罗里达大学毕业证,UCF成绩单原版一比一
办理学位证中佛罗里达大学毕业证,UCF成绩单原版一比一
 
Customer Service Analytics - Make Sense of All Your Data.pptx
Customer Service Analytics - Make Sense of All Your Data.pptxCustomer Service Analytics - Make Sense of All Your Data.pptx
Customer Service Analytics - Make Sense of All Your Data.pptx
 
Generative AI for Social Good at Open Data Science East 2024
Generative AI for Social Good at Open Data Science East 2024Generative AI for Social Good at Open Data Science East 2024
Generative AI for Social Good at Open Data Science East 2024
 
9711147426✨Call In girls Gurgaon Sector 31. SCO 25 escort service
9711147426✨Call In girls Gurgaon Sector 31. SCO 25 escort service9711147426✨Call In girls Gurgaon Sector 31. SCO 25 escort service
9711147426✨Call In girls Gurgaon Sector 31. SCO 25 escort service
 
dokumen.tips_chapter-4-transient-heat-conduction-mehmet-kanoglu.ppt
dokumen.tips_chapter-4-transient-heat-conduction-mehmet-kanoglu.pptdokumen.tips_chapter-4-transient-heat-conduction-mehmet-kanoglu.ppt
dokumen.tips_chapter-4-transient-heat-conduction-mehmet-kanoglu.ppt
 
DBA Basics: Getting Started with Performance Tuning.pdf
DBA Basics: Getting Started with Performance Tuning.pdfDBA Basics: Getting Started with Performance Tuning.pdf
DBA Basics: Getting Started with Performance Tuning.pdf
 
1:1定制(UQ毕业证)昆士兰大学毕业证成绩单修改留信学历认证原版一模一样
1:1定制(UQ毕业证)昆士兰大学毕业证成绩单修改留信学历认证原版一模一样1:1定制(UQ毕业证)昆士兰大学毕业证成绩单修改留信学历认证原版一模一样
1:1定制(UQ毕业证)昆士兰大学毕业证成绩单修改留信学历认证原版一模一样
 
9654467111 Call Girls In Munirka Hotel And Home Service
9654467111 Call Girls In Munirka Hotel And Home Service9654467111 Call Girls In Munirka Hotel And Home Service
9654467111 Call Girls In Munirka Hotel And Home Service
 
ASML's Taxonomy Adventure by Daniel Canter
ASML's Taxonomy Adventure by Daniel CanterASML's Taxonomy Adventure by Daniel Canter
ASML's Taxonomy Adventure by Daniel Canter
 
Deep Generative Learning for All - The Gen AI Hype (Spring 2024)
Deep Generative Learning for All - The Gen AI Hype (Spring 2024)Deep Generative Learning for All - The Gen AI Hype (Spring 2024)
Deep Generative Learning for All - The Gen AI Hype (Spring 2024)
 
From idea to production in a day – Leveraging Azure ML and Streamlit to build...
From idea to production in a day – Leveraging Azure ML and Streamlit to build...From idea to production in a day – Leveraging Azure ML and Streamlit to build...
From idea to production in a day – Leveraging Azure ML and Streamlit to build...
 
EMERCE - 2024 - AMSTERDAM - CROSS-PLATFORM TRACKING WITH GOOGLE ANALYTICS.pptx
EMERCE - 2024 - AMSTERDAM - CROSS-PLATFORM  TRACKING WITH GOOGLE ANALYTICS.pptxEMERCE - 2024 - AMSTERDAM - CROSS-PLATFORM  TRACKING WITH GOOGLE ANALYTICS.pptx
EMERCE - 2024 - AMSTERDAM - CROSS-PLATFORM TRACKING WITH GOOGLE ANALYTICS.pptx
 
High Class Call Girls Noida Sector 39 Aarushi 🔝8264348440🔝 Independent Escort...
High Class Call Girls Noida Sector 39 Aarushi 🔝8264348440🔝 Independent Escort...High Class Call Girls Noida Sector 39 Aarushi 🔝8264348440🔝 Independent Escort...
High Class Call Girls Noida Sector 39 Aarushi 🔝8264348440🔝 Independent Escort...
 
毕业文凭制作#回国入职#diploma#degree澳洲中央昆士兰大学毕业证成绩单pdf电子版制作修改#毕业文凭制作#回国入职#diploma#degree
毕业文凭制作#回国入职#diploma#degree澳洲中央昆士兰大学毕业证成绩单pdf电子版制作修改#毕业文凭制作#回国入职#diploma#degree毕业文凭制作#回国入职#diploma#degree澳洲中央昆士兰大学毕业证成绩单pdf电子版制作修改#毕业文凭制作#回国入职#diploma#degree
毕业文凭制作#回国入职#diploma#degree澳洲中央昆士兰大学毕业证成绩单pdf电子版制作修改#毕业文凭制作#回国入职#diploma#degree
 

The Beauty of Data Visualization: Understanding Complex Data

  • 1. The beauty of data visualization Debashish Jana
  • 2. What Is Data Visualization? Data visualization is a general term that describes any effort to help people understand the significance of data by placing it in a visual context. Patterns, trends and correlations that might go undetected in text-based data can be exposed and recognized easier with data visualization software.
  • 3. Today's data visualization tools go beyond the standard charts and graphs used in Microsoft Excel spreadsheets, displaying data in more sophisticated ways such as infographics, dials and gauges, geographic maps, sparklines, heat maps, and detailed bar, pie and fever charts.
  • 4. Importance of data visualization Data visualization has become the de facto standard for modern business intelligence (BI). The success of the two leading vendors in the BI space, Tableau and Qlik -- both of which heavily emphasize visualization -- has moved other vendors toward a more visual approach in their software. Virtually all BI software has strong data visualization functionality.
  • 5. Data visualization tools have been important in democratizing data and analytics and making data-driven insights available to workers throughout an organization. They are typically easier to operate than traditional statistical analysis software or earlier versions of BI software. This has led to a rise in lines of business implementing data visualization tools on their own, without support from IT.
  • 6. History of Data Visualization The concept of using pictures to understand data has been around for centuries, from maps and graphs in the 17th century to the invention of the pie chart in the early 1800s. Several decades later, one of the most cited examples of statistical graphics occurred when Charles Minard mapped Napoleon’s invasion of Russia. The map depicted the size of the army as well as the path of Napoleon’s retreat from Moscow – and tied that information to temperature and time scales for a more in-depth understanding of the event.
  • 7. Examples of data visualization Many business departments implement data visualization software to track their own initiatives. For example, a marketing team might implement the software to monitor the performance of an email campaign, tracking metrics like open rate, click-through rate and conversion rate.
  • 8. How data visualization works Data visualization software allows the user to select the best way of presenting the data, but, increasingly, software automates this step. Some tools automatically interpret the shape of the data and detect correlations between certain variables and then place these discoveries into the chart type that the software determines is optimal.
  • 9. Informative: The most basic function of a report is to inform the consumer of something and a picture can do this in a universal way.
  • 10. Efficient: Perhaps the biggest benefit of utilizing data visualizations is the efficiency gained through proper execution. A well designed visual will save the data analyst precious time as it can communicate the message of the data concisely and without ambiguity.
  • 11. Appealing: Much like a masterpiece draws the viewer in and captivates their thoughts as they gaze at the picture, properly designed data visualizations will draw you in and lead you to the intended conclusion in a visually pleasing way.
  • 12. Why data visualization and reporting tools are important for business users? Visualized data reporting help to effectively research on customer profile such as age, behaviors, landing page, actions and many other things that improve digital marketing efforts. And it’s really important for any size business to compare, analyze and boost business growth pattern with data visualization.
  • 13. Know the following benefits and you will understand why data visualization is needed? Data visualization tools are effective to understand complex data and multi-dimensional data. Data visualization helps to visualize trending data in application and website on the internet. And anyone can use data visualization techniques to discover insights and new conclusions.