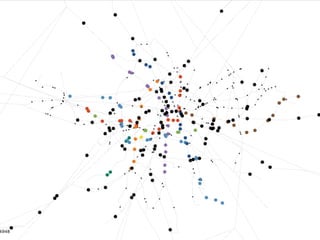
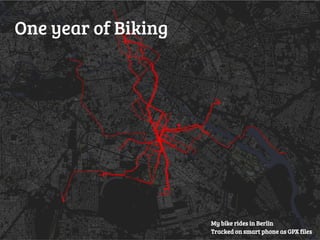
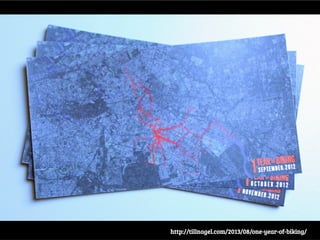
Download as PDF, PPTX

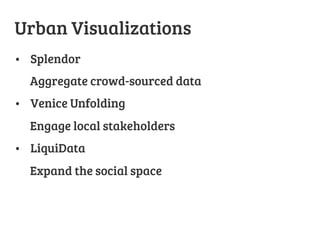
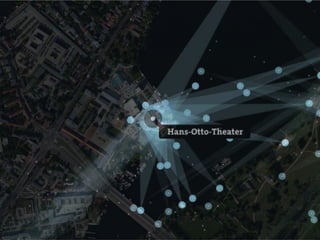
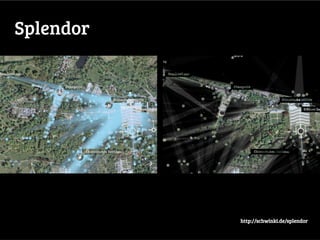
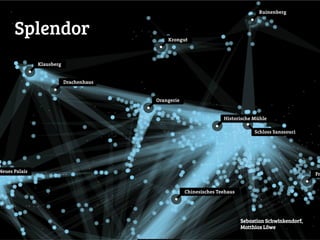

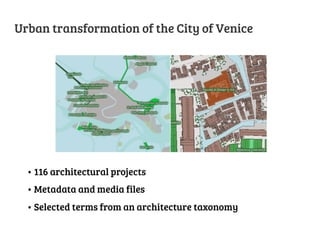


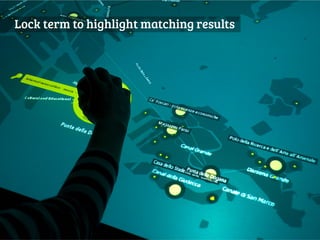
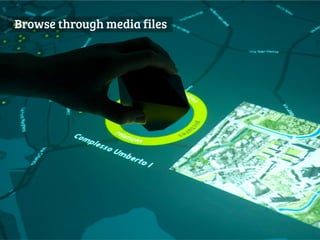
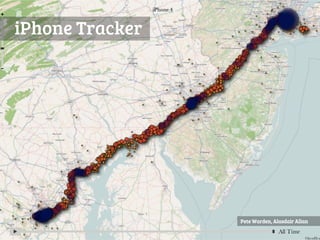

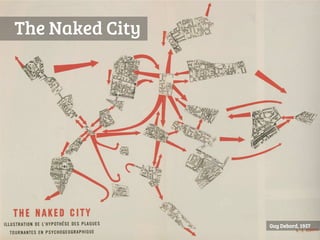
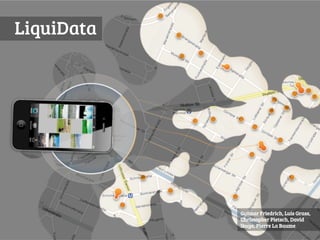


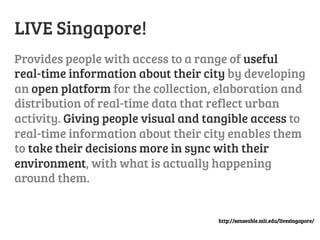
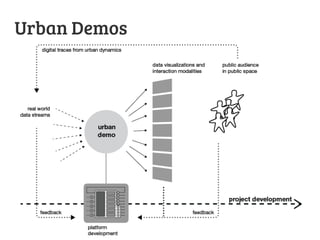
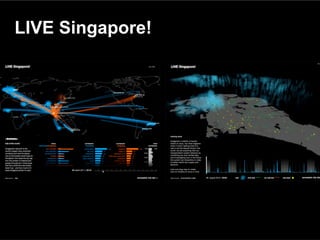
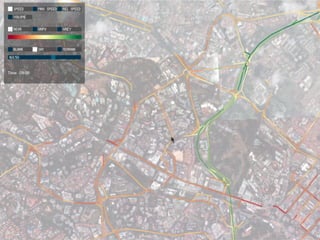
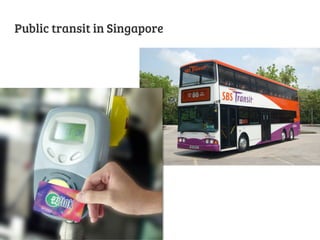
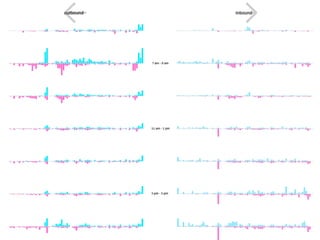

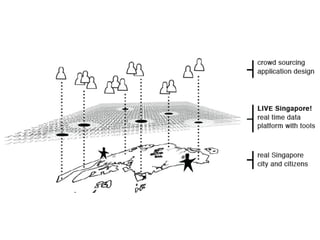
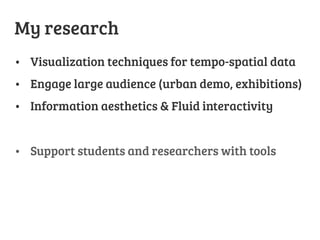

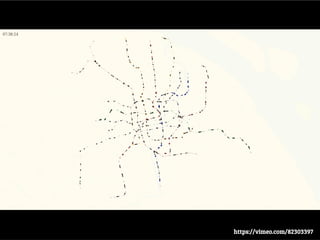
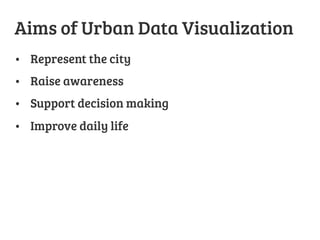


This document discusses various techniques for visualizing urban data to better understand cities. It describes projects like Splendor which uses crowd-sourced data, Venice Unfolding which engages local stakeholders, and LiquiData which expands the social space. The document also discusses visualizing transit patterns in Singapore, bike routes in Berlin, and metro flows in Shanghai. The overall goals of urban data visualization are represented as representing the city, raising awareness, supporting decision making, and improving daily life.


