The document details a fourth-year undergraduate project by Lorenzo Venturini, aimed at developing a nondestructive x-ray imaging technique for measuring holes in Swiss-type cheeses. Traditional core sampling methods are destructive and limited in scope; thus, this project seeks to use two-dimensional x-ray projections to accurately reconstruct a three-dimensional map of the cheese's internal structure. The proposed method demonstrates better accuracy and efficiency compared to traditional techniques, providing a cost-effective solution for quality control in cheese production.


![1 Introduction
1.1 Motivation
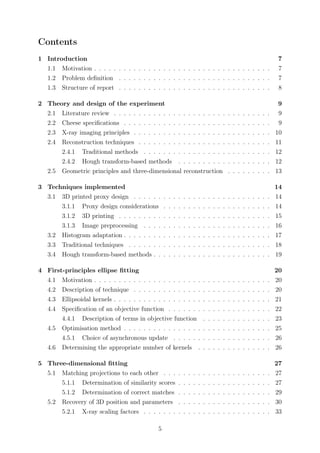
Cheese with holes, such as Emmental or Leerdammer, is a very popular and tasty addition
to the dinner table. Production of Emmental cheese in Switzerland and France alone
exceeds 270000 tons a year [1]. One of the distinguishing features of these cheeses is the
presence of large and prominent holes (or “eyes”), caused by colonies of bacteria which
consume the cheese during maturation and produce carbon dioxide [2]. As the density
and size of holes changes the chemical makeup and flavour of the cheeses, manufacturers
strive to maintain a consistent size and distribution of holes in their product.
With such a popular and profitable product, it is surprising that the techniques used
to find the holes within samples of cheese and conduct quality control have remained
the same for centuries. In fact, the traditional technique to inspect holes, known as core
sampling, simply involves extracting a cylindrical sample from a wheel of cheese using a
tool known as a cheese trier [3], and manually inspecting the holes present along it.
While this can provide a rough picture of the characteristics of the holes along that
sample, it has some clear limitations. This technique is semi-destructive, lowering the
value of the wheel of cheese. Furthermore, it only gives information about the holes on
the sample - it will not, for example, be able to find any asymmetries in the distribution
of holes in the cheese.
1.2 Problem definition
The aim of this project is to design a nondestructive technique to faithfully find the 3D
positions and other characteristics of the holes within a cheese. This should be at least
as accurate as existing (destructive) techniques, as well as cost-effective. X-ray imaging
was chosen as it is a relatively cheap and established technology that can provide a good-
quality picture of the holes within the cheese.
X-ray imaging is not the only method which can be thought of to provide a three-
dimensional map of the cheese: several other common imaging techniques, such as ul-
trasound or MRI, could conceivably be used instead. X-ray was chosen due to the low
cost, high resolution and low image acquisition time of the technique, which makes it an
easy option for this project. MRI was discarded due to its high cost relative to X-ray
imaging and high acquisition time. Ultrasound, though cheap, requires a gel to be spread
over the cheese first to diminish reflection of the ultrasound signal. This was deemed
to be unpalatable to consumers, potentially lowering the value, and therefore X-ray was
preferred.
To produce a three-dimensional image, multiple two-dimensional projections must
be taken and combined; one part of this project is focused on obtaining a good three-
7](https://image.slidesharecdn.com/finaliibreport-170209094333/85/Venturini-X-ray-imaging-for-cheese-7-320.jpg)
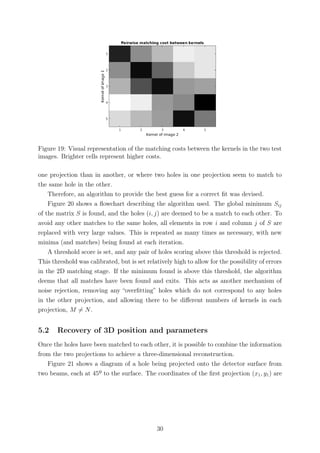
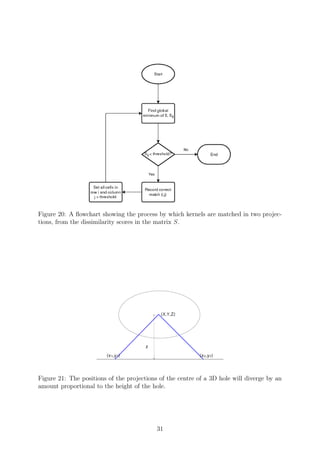
![quantitative analysis of the quality of the results and suggestions to improve the method.
Conclusions and reflections on future directions and possible applications are given in
section 7.
2 Theory and design of the experiment
2.1 Literature review
There are many examples in the literature of X-ray imaging being used for quality control
of foods, including cheese. Brosnan and Sun (2004) [4] offer a review of computer vision
applications in food inspection, including several applications for X-rays. These include
using X-ray imaging to detect bones in chicken and fish [5] and to find split pits in peaches
[6].
These techniques are well-established, and several companies exist which offer X-ray
applications for food inspection, including Cheyney Design, which was heavily involved
in this project. However, past efforts have mostly focused on detecting foreign objects
within the cheese, such as fragments of metal or stone.
The only attempt that could be found in the literature to characterise holes using
X-ray imaging techniques was made by Kraggerhud et al. [7]. They sought to find the
positions and dimensions of holes in cheese using an X-ray scan, and therefore provide a
statistical indication of the quality of the cheese. However, their attempts are limited to
a single 2-dimensional projection - they did not attempt to build a 3D reconstruction of
the cheese. Additionally, the technique they developed is only valid on spherical holes;
in reality, however, the holes are ellipsoids with substantial eccentricity. It was therefore
deemed that this project would make a novel contribution to the state of the art.
Other attempts exist in the literature to extract holes from photographs of cheese [8],
ultrasound [9] and even MRI [10]. However, due to the different imaging equipment having
different capabilities and limitations, the techniques developed with these two methods
are not directly applicable to X-ray imaging.
2.2 Cheese specifications
The cheese used for the purposes of this project was a sample of Emmental cheese provided
by Mifroma, a Swiss cheesemaker.
It was aged for 3 months under commercial conditions and X-rayed at Cheyney Design.
This sample has dimensions of 345mm × 265mm × 55mm, though only a section of it
(210mm x 100mm x 55mm) was examined by X-ray, for practical purposes. The techniques
developed however should, in principle, be applicable to cheeses of any size.
9](https://image.slidesharecdn.com/finaliibreport-170209094333/85/Venturini-X-ray-imaging-for-cheese-9-320.jpg)
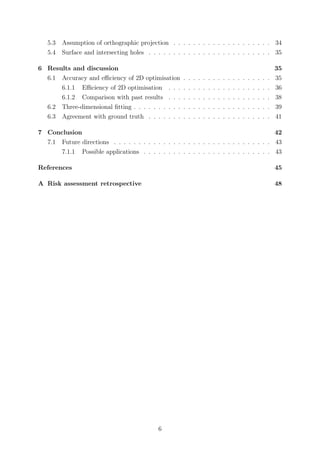
![Figure 2: Left, a projection of a block of cheese imaged with visible light. Right, a
projection of a larger block imaged with X-rays.
2.3 X-ray imaging principles
Most materials in everyday life (including cheese) are opaque to visible light. This means
that when they are struck by photons of visible light, they will tend to absorb all, or
nearly all, of their photons near their surface. This is why holding a block of cheese in
front of a light is not in itself sufficient to identify whether there are any holes within
it - the material’s attenuation coefficient to visible light is simply too high to let any
appreciable number of photons through its thickness, leading to a uniformly dark image
(see Figure 2, left).
Clearly this is not a viable technique to locate holes inside a cheese. However, while
cheese is opaque to visible light, it is much more transparent to other frequencies of the
electromagnetic spectrum.
X-rays are the region of the light spectrum with wavelength 0.01-10 nm (or energies
∼100 eV - 100 keV per photon). This is a far higher energy range than visible light,
and crucially most biological materials (including cheese) are much more transparent to
this range of frequencies than to visible light. This leads to well-known applications in
medicine, where the relative transparencies of different types of tissue can allow for a
photographic image of the patient to be constructed by shining X-ray radiation through
them. This can also be used in cheese, which is mostly (but not entirely) transparent to
X-ray radiation, allowing an image of the holes present within it to be obtained (Figure
2, right).
The attenuation of radiation through a material is given by the Beer-Lambert law [11],
n
n0
= exp (−µx)
where n is the number of photons exiting the material, n0 is the number of photons
10](https://image.slidesharecdn.com/finaliibreport-170209094333/85/Venturini-X-ray-imaging-for-cheese-10-320.jpg)
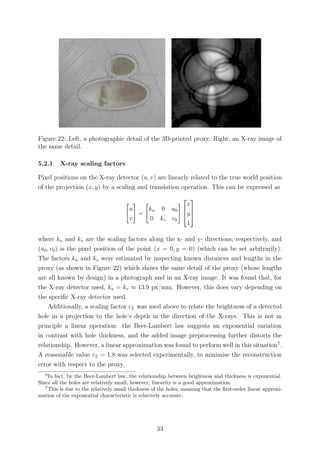
![entering the material, µ is the material’s attenuation coefficient1
and x is the thickness.
The X-ray attenuation coefficient for cheese (approximated by that of water [12]) per
unit volume is larger than that of air by a factor of approximately 103
, which confirms
that it should be easy to draw contrasts between solid cheese and holes in an X-ray image.
X-rays are typically produced by X-ray generators. These consist of vacuum tubes
where a hot cathode releases electrons, which are accelerated by high voltages (50 kV in
the model used in this report[14]) onto an anode. The energy released by the electrons’
collision with the anode is in the form of X-ray radiation, whose energy is limited by
the voltage (ie. the radiation produced by this setup cannot exceed 50 keV). The output
distribution of X-ray frequencies is a combination of the generator materials’ characteristic
spectra and a smooth curve, known as bremsstrahlung [13]. To prevent the emission of
radiation at low energy, this output is then filtered by a thin layer of material (beryllium
in the generator used). This is known as beam hardening.
The cheese has a relatively small attenuation coefficient with respect to X-rays (µ ≈
5 × 10⁻²
cm−1
at the X-ray energy used) which means that cheeses with thickness of up
to several centimetres can be usefully imaged with a reasonable amount of light passing
through. A quick back-of-the-envelope calculation shows that the contrast of a hole of
diameter d cm within a cheese of thickness t is (assuming air within the holes to have no
attenuation)
Contrast =
(brightness through hole centre)
(brightness through region with no holes)
=
exp(−µ(t − d))
exp(−µt)
= exp(µd).
This means that even a relatively small hole with diameter d = 1cm presents a contrast
ratio of roughly 1.05:1, which should be noticeable when the hole is placed in a piece of
otherwise uniform cheese. This contrast can also be artificially enhanced to make the
holes appear more obvious.
2.4 Reconstruction techniques
Several 3D reconstruction techniques exist to find the internal structure of a 3D object
from 2D projections. Many are widespread, being used very commonly in medicine to
perform CT scans.
It is possible to take a different approach, focusing instead on finding individual holes
in a 2D projection, and then combining them with different projections to reconstruct a
1
The coefficient µ is depends on the sum of several nuclear interactions and therefore has a complex
relationship with frequency - nonetheless it can be approximated to be constant across the X-ray spectrum
for the purposes of this report.
11](https://image.slidesharecdn.com/finaliibreport-170209094333/85/Venturini-X-ray-imaging-for-cheese-11-320.jpg)
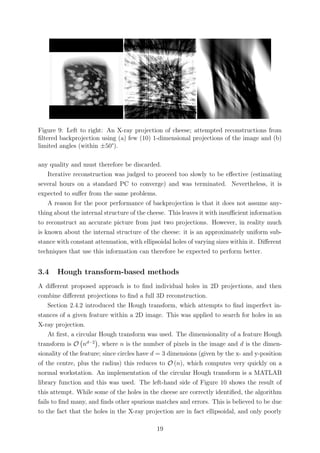
![3D image. These are also investigated.
2.4.1 Traditional methods
Computed tomography (CT) is a very widespread and well-established technique to re-
cover a 3D reconstruction from single 2D X-ray projections. Since the technique’s devel-
opment in the 1970s, it has been used in hospitals around the world and is now part of
many fairly routine medical procedures.
Filtered backprojection [15] is the principal mathematical technique by which CT
works. It uses a mathematical technique known as the Radon transform to attempt to
invert the projection process, using many (on the order of 100) individual 2D projections
of the area of interest, from many angles around the object (approximately a 180º range).
Each of these is then projected back along the line where the points with high attenuation
could lie in a 3D image, and filters are applied to reduce any of the resulting “streaking”
artifacts. With large numbers of projections and angles, this can lead to a very accurate
reconstruction which is appropriate for use in sensitive medical applications like surgery
or radiotherapy.
A different technique which is increasingly being used to recover 3D images in medi-
cal CT is iterative reconstruction [15]. There are many different approaches to iterative
reconstruction, but fundamentally they attempt to build a 3D reconstruction by finding
the most likely attenuation coefficient for each voxel by iterative optimisation techniques.
This is increasingly popular in medical devices but it typically requires much more com-
putational power than backprojection to obtain a reconstruction.
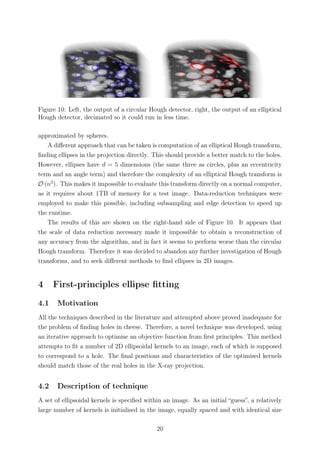
2.4.2 Hough transform-based methods
A different approach could be to find the locations of individual holes within 2D projec-
tions, and combine the information of two projections to find a three-dimensional position.
This would involve finding ellipses in a two-dimensional image.
There are several techniques to find ellipses within 2D images [16]. Of these, a popular
method is the Hough transform.
The Hough transform can find imperfect instances of a desired feature within an image
[17, 18]. Typically, this is used in computer vision to find straight lines or circles within
an image. More recently, techniques extending the Hough transform to find other features
such as ellipses in 2D images have been investigated [18].
The memory usage involved with the Hough transform is heavily dependent on the di-
mensionality of the features being matched. The complexity of the transform is O nd−2
,
where n is the number of pixels in the image and d is the dimensionality of the feature
searched for.
12](https://image.slidesharecdn.com/finaliibreport-170209094333/85/Venturini-X-ray-imaging-for-cheese-12-320.jpg)
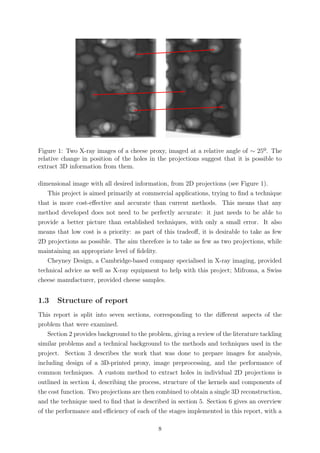
![Figure 3: Left, a traditional computer vision setup with two cameras (or a rotating
camera). This is equivalent to the setup on the right, where the cheese is rotated instead.
2.5 Geometric principles and three-dimensional reconstruction
Standard computer vision techniques can be used to find the 3D position of points from
2D images at different angles.
Any point in an image at one angle must lie along a line in the other image known as
the epipolar line. This is the image in the other camera of the line joining the point and
the optical centre of the other camera. With a known point in one image and knowing the
positions and internal parameters of the different cameras, it becomes possible to narrow
down the position to a single straight line in the other image2
, making it easier to find
point matches. From the calibration of the two cameras it becomes relatively easy to then
find the 3D positions of point matches.
Figure 3 shows two imaging setups. Observing a cheese using a stereo rig of two
cameras at opposite angles is in fact equivalent to observing the cheese with a single
camera and rotating it instead. This is a cheaper and easy setup and therefore preferable,
while maintaining all the stereo vision techniques described above.
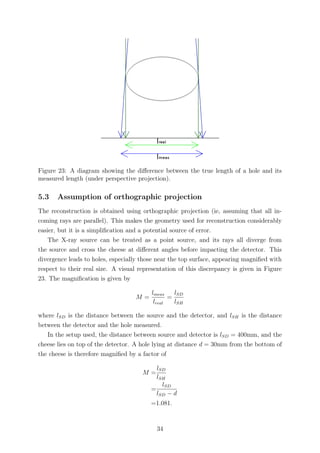
Real sensors and cameras operate under perspective projection, where the 3D image
of the cheese is somewhat distorted along its thickness - the part of the cheese which is
nearer to the X-ray source appears larger than that further away. If the cheese is placed
far enough away from the X-ray source (and so its thickness is negligible compared to the
distance from the source) it becomes possible to approximate the perspective projection to
an orthographic projection [19]. This is mathematically easier and requires less calibration
than perspective projection, so it would be useful if this is a good approximation.
2
In fact, due to nonlinear distortion from the sensor and the X-ray generator not being a point source,
it is narrowed down to a narrow region around a line instead of a single line.
13](https://image.slidesharecdn.com/finaliibreport-170209094333/85/Venturini-X-ray-imaging-for-cheese-13-320.jpg)
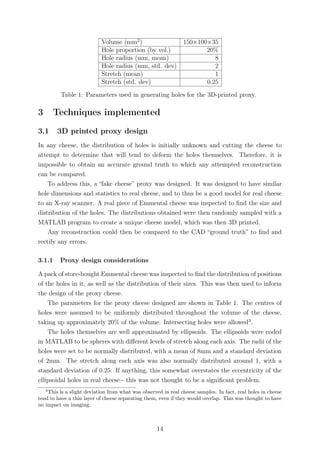
![Figure 4: A wireframe view of the CAD model of the proxy.
Another design consideration for the proxy was its size and the size that the manufac-
turing process could allow. A typical industrial block of cheese measures approximately
300mm x 200mm x 70mm. However, the maximum dimensions of any object that could
be printed on the 3D printers available for use was 223mm × 223mm × 205mm [20].
Besides, it was found that printing a proxy with the same volume as an industrial block
of cheese would take more than one spool of 3D printer filament, raising other practical
problems. Therefore, it was finally decided to scale down the dimensions of the proxy by
a factor of 2 along each dimension.
A MATLAB script was written to randomly generate hole positions and parameters for
the proxy based on this specification. These were then imported into a CAD programme
for design of the physical object.
3.1.2 3D printing
OpenSCAD [21] was then used to develop a CAD model of the proxy, which was then 3D
printed. A top wireframe view of the CAD model can be seen in Figure 4.
Most 3D printers work by a process known as additive manufacturing: a thin filament
of an appropriate type of plastic is heated to its melting point (typically above 200 ºC)
and deposited onto a surface, where it quickly hardens again. When filament is added
beside already-manufactured filament, it fuses, creating a single solid mesh structure.
Thus meshes of filament can form solid layers, and new layers can be printed on top of
existing ones to produce 3D structures.
One benefit of this process is that it makes it possible to create fully-enclosed voids.
It is desirable for the proxy, much like real cheese, to contain holes which are completely
surrounded by material and not visible to the naked eye. These could now be manufac-
tured.
Additive 3D printing also introduces a few restrictions and artifacts in the manufac-
turing process. The regular mesh created by the 3D printer is visible and can create
15](https://image.slidesharecdn.com/finaliibreport-170209094333/85/Venturini-X-ray-imaging-for-cheese-15-320.jpg)
![Figure 5: Left, the CAD model of the 3D printed proxy. Right, a photograph of the final
product.
noise in the X-ray measurements. Additionally, the printing process draws the contours
of shapes (such as holes or the cheese’s edge) before filling it in. This creates noticeable
artifacts around the edges of holes and in their X-ray images, which must be taken into
account.
The 3D printer used was an Ultimaker 2 [20] present at the Department of Plant
Sciences, University of Cambridge. The filament used was heated to 215 ºC and had a
diameter of 100 µm, the minimum allowed by the printer, to reduce mesh artifacts while
imaging as much as possible.
The material used for printing was polylactic acid (PLA), a standard 3D printer ma-
terial. This is a biologically-derived plastic normally synthesised from sugarcane, and it
is non-toxic and biodegradable [22]. As it is an organic compound, it was assumed that
its X-ray attenuation coefficient is similar to that of real cheese.
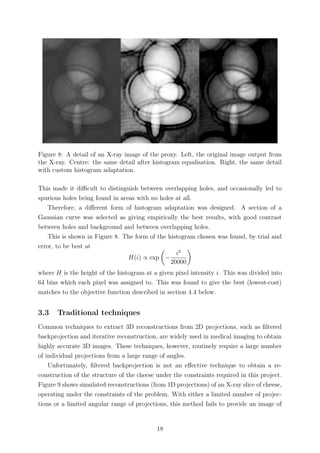
3.1.3 Image preprocessing
The resulting 3D-printed proxy (shown in Figure 5) subjectively looks very similar to
cheese, but does present a few differences in its X-ray images. Due to the additive man-
ufacturing process, the regular plastic mesh which the solid parts of the proxy are built
from is visible in the X-ray images: this presents a significant source of high-frequency
noise, which has the potential to add confusion to the results. Additionally, the entire
X-ray image appears very dark and it is difficult to make out any higher-order features
within the cheese (such as holes). To counteract this, all pixel values were normalised to
have a maximum at 255, which made the image much brighter with no loss of information.
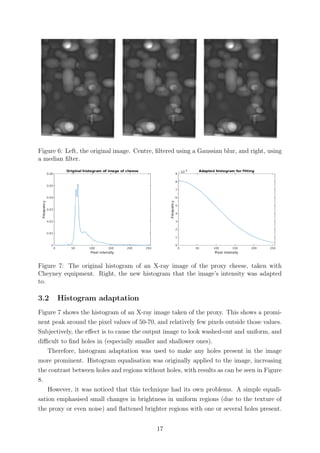
To eliminate the high-frequency mesh from the image, filtering was used. Both a
Gaussian filter and a median filter were considered for use. As shown in Figure 6, they
can both effectively blur out the mesh, with the median filter providing marginally better
subjective sharpness than the Gaussian filter, and slightly slower performance. As a result,
the median filter was chosen.
16](https://image.slidesharecdn.com/finaliibreport-170209094333/85/Venturini-X-ray-imaging-for-cheese-16-320.jpg)
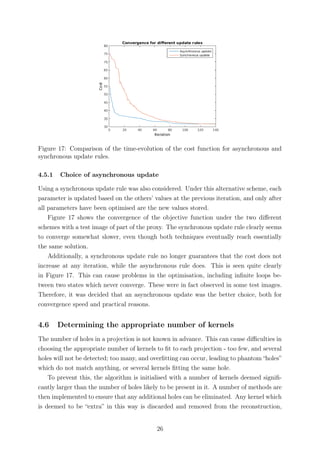
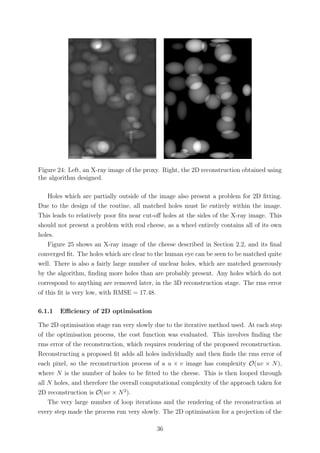
![Figure 16: The reconstruction of the same area of the scan obtained using the final version
of the objective function.
and prevent the establishment of local minima which do not correspond to the ground
truth.
4.5 Optimisation method
After the initialisation of the kernels, a very simple iterative technique is used to minimise
the objective function. This is specified as follows:
1. Select a kernel
2. Translate the kernel slightly to the left and the change in the objective is measured.
(a) If the error decreases, (2) is repeated until the objective no longer decreases.
(b) Otherwise, it is moved to the right until the objective increases.
3. Repeat same procedure as (2) for y-axis translation, intensity, and stretches along
the x- and y-axis.
4. Return to step (2) and repeat until the rms error remains constant between itera-
tions.
5. Select another kernel and return to (2) until convergence.
Each optimisation is done on the basis of the results of the previous one - that is, optimised
positions, stretches etc. are stored and used to compute the optimisation for the next
parameter. This method was implemented using MATLAB [23] as a platform.
Rotation of the kernels was not included in this method, after it was found that it
slowed down convergence substantially (by adding a degree of freedom) without increasing
the accuracy of the final fit.
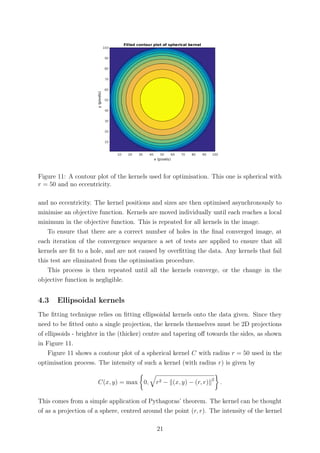
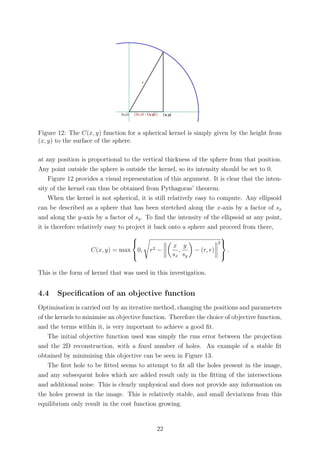
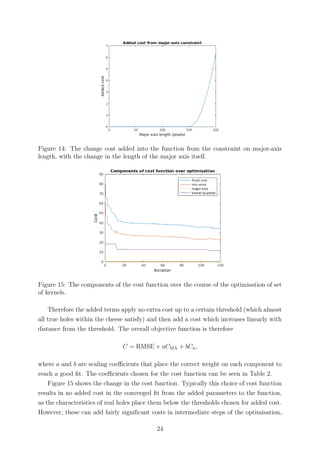
25](https://image.slidesharecdn.com/finaliibreport-170209094333/85/Venturini-X-ray-imaging-for-cheese-25-320.jpg)
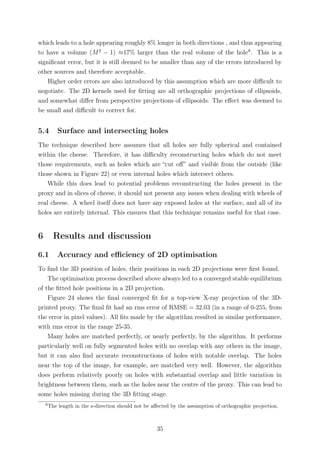
![Figure 25: Left, an X-ray image of a real piece of cheese. Right, the 2D reconstruction
obtained.
entire proxy shown in Figure 24 computed in approximately one hour on a normal PC.
The need to re-render the reconstruction at every step, and the presence of this step at
the bottom of four nested loops, means that the algorithm spends a large proportion of
its time evaluating proposed fits. It would be possible to speed up execution substantially
(if not change the overall complexity) by saving a render for the N − 1 holes not being
optimised at the current iteration, and then simply adding the proposed fit for the kernel
being fitted before recomputing the cost.
An even simpler way to reduce running time is by subsampling high-resolution images,
which results in large computational savings with a relatively small decrease in perfor-
mance. This was done, and as predicted, subsampling by a factor of 2 along each axis
reduced the running time of the optimisation by a factor of approximately 4.
Due to the O(uv×N2
) complexity of the optimisation process, there are also significant
expense savings to be had if the image can be segmented into smaller sub-images, and
each sub-image only uses a fraction of the N kernels. This is not straightforward to do as
many holes overlap with each other and a naive segmentation would cut holes across the
sub-images and result in incorrect fits. It is, however, possible to identify lines along which
the image can be segmented (such as the divide between the upper and lower sections of
the fit in Figure 24) and perform optimisation along those.
Another area where changes could be made to lower the running time of the process
(and bring marginal improvements to the fit) is the optimisation technique itself. The
algorithm as implemented uses a fixed step size to translate and stretch kernels around the
projection to minimise the error. Varying the step size based on the previous change could
result in many unnecessary iterations being skipped and a much faster optimisation per
kernel [24, 25]. As the derivative of the objective function with any of the parameters being
37](https://image.slidesharecdn.com/finaliibreport-170209094333/85/Venturini-X-ray-imaging-for-cheese-37-320.jpg)
![Figure 26: Left, the sample image used by Kraggerhud et al. Right, the reconstruction
obtained by them (reproduced from [7])
used is not apparent, derivatives must be computed numerically [26] or a “derivative-free”
optimisation method should be used instead [27].
It was also found that the final converged fit showed some dependence on the starting
conditions for the optimisation. Varying the spacing of the initial kernel setup, or offset-
ting the kernels, led to slightly different converged fits (for example, fitting or skipping
holes that a different starting setup did not do). All converged fits nonetheless presented
a similar rms error.
6.1.2 Comparison with past results
It is difficult to directly compare the results obtained in this report to other results
available in the literature, as nobody has attempted to find the three-dimensional location
of holes in cheese through X-ray imaging.
However, Kraggerhud et al. [7] attempted to use X-ray imaging to monitor the growth
of holes in cheese over time. They proposed a method to find holes in individual 2-
dimensional X-ray projections of cheese. This started from the assumption that holes in
a single X-ray projection are well-approximated by uniform circles. They then scanned
the image with a set of uniform circular templates of different radii to obtain a cross-
correlation image for each [28]. They then took the maximum cross-correlation value
for each pixel, thresholded the image and found the centroids and radii of the resulting
patches as the radii of the holes within the cheese. The results they obtained from a
sample image (reproduced from the paper) are shown in Figure 26.
This is clearly a different approach from that taken in this project. Apart from the
different optimisation technique used, the 2D matching process used in this project did
not assume uniform circular holes, but rather used kernels which were projections of an
ellipsoid and allowed them to deform.
The converged 2D fit obtained for the same data used by Kraggerhud et al. using
the algorithm developed in this project is shown in Figure 27. This subjectively seems
to perform somewhat better than Kraggerhud et al.’s system, finding several holes which
38](https://image.slidesharecdn.com/finaliibreport-170209094333/85/Venturini-X-ray-imaging-for-cheese-38-320.jpg)
![Figure 27: Left, the sample image used by Kraggerhud et al [7]. Right, the reconstruction
obtained by the algorithm developed.
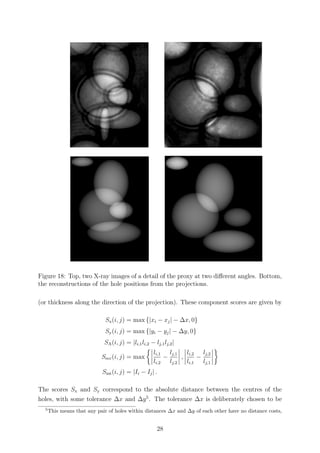
Figure 28: Left, a detail (in wireframe view) of the ground truth for the proxy showing
surface holes; right, its reconstruction.
their technique did not correctly identify. It is still not perfect, and tends to overfit
somewhat and finds more holes than are truly present in the image. This is to an extent
intentional in the fitting process, however, as these phantom holes can later be removed
in the 3D matching stage with reasonable accuracy and relatively little inaccuracy9
. Thus
(as far as the two methods are comparable) the method employed for two-dimensional
matching here performs as well as, or better than, the state of the art.
6.2 Three-dimensional fitting
The two-dimensional fits obtained from each projection were then matched to obtain a
three-dimensional reconstruction.
Figure 28 shows a three-dimensional reconstruction of a detail of the 3D-printed proxy,
using the algorithms detailed above. Although there are some errors in the reconstruction
9
It would not be helpful in this instance to compare the rms error of the two reconstructions, as the
matching proposed by Kraggerhud et al. does not explicitly produce a reconstruction.
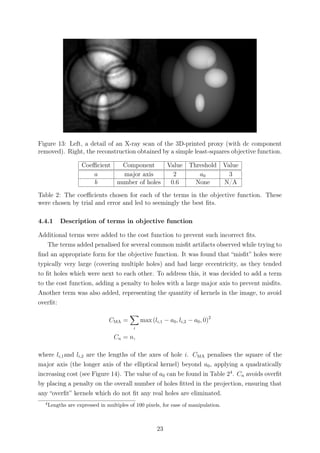
39](https://image.slidesharecdn.com/finaliibreport-170209094333/85/Venturini-X-ray-imaging-for-cheese-39-320.jpg)
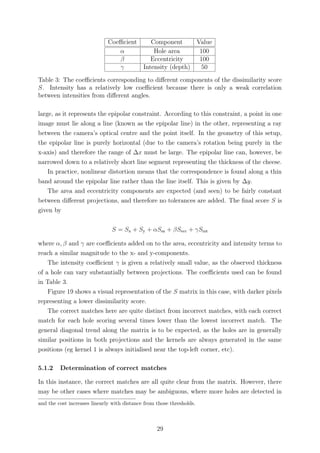
![Error type rms error
Centre location 4.5mm
Side length 12%
Hole volume 19%
Table 4: The rms magnitudes of the reconstruction errors observed in the reconstruction
of the proxy.
of each hole, it is clearly a fairly faithful reconstruction of the original.
The spurious hole which has been identified in the top-left corner of the reconstruction
is in fact an artifact due to cropping the 2D images: part of a larger hole remained
present and was matched (as is visible in Figure 18, which shows the projections of the
same detail). Two real holes which are present on the left, on the other hand, are not
reconstructed on the right. This is due to the nature of those holes: one is almost entirely
outside of the proxy and is invisible in X-ray images, and the other has a very high
eccentricity and is only visible in one of the projections. The other holes, with good
visibility in both projections, are reasonably reconstructed.
The reconstructed position of the centre of the holes presented an rms error of 4.5mm
(and the error seems to be approximately equal along all axes). This leads to very good
positioning of all the holes, and agreement with the ground truth.
The quality of reconstruction of lengths and volumes about each axis of the holes was
somewhat worse. The rms difference between the actual and reconstructed length of each
axis averaged 12%, while the rms difference between actual and reconstructed volume was
19%. These errors are all shown in Table 4. However, this overstates the true error in the
reconstruction. This relative inaccuracy is largely due to the inaccurate reconstruction
of surface holes, which are reconstructed to be somewhat smaller than they are in the
original due to the low contrast measured by the X-ray. Therefore in reality this error is
somewhat immaterial.
It must also be noted that the traditional technique of core sampling does a generally
poor job of estimating the lengths and volumes of the holes cut across. The mechanical
strains induced by core sampling lead to the distortion of the holes cut across [29], and
it therefore becomes difficult to obtain an accurate impression of the lengths and the
volumes of the holes.
There was no significant change in volume discrepancy between holes at the bottom of
the cheese (nearer the detector) and holes nearer the top surface. Therefore it was deemed
that the assumption of orthographic projection used to perform 3D reconstruction was
not a significant source of error.
Figure 29 shows the 3D reconstruction of the cheese analysed above. Even though
each 2D projection fitted the holes quite generously, finding many matches in a single
projection, only a few of those were recognised to be real holes in the 3D matching stage.
40](https://image.slidesharecdn.com/finaliibreport-170209094333/85/Venturini-X-ray-imaging-for-cheese-40-320.jpg)
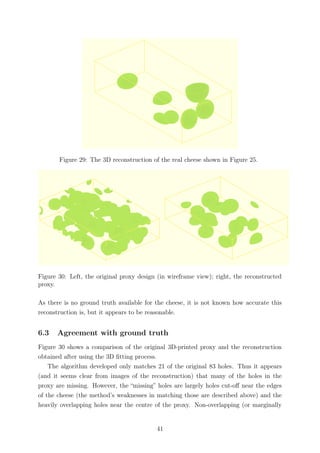
![overlapping) holes far from the edges were generally matched and reconstructed quite
well. This is a substantial weakness of the reconstruction, but one that is less significant
in real cheeses. In real cheeses, the holes do not extend to the edge of the wheel and they
generally do not overlap [30].
7 Conclusion
This project was established with the aim to use as few X-ray images as possible to obtain
a faithful three-dimensional reconstruction of the internal structure of cheese with holes
in it. The outcome was to be aimed at a commercial application, so it needed to be
low-cost, rapid and an improvement over the destructive methods currently used in the
quality-control industry [3].
This was split into several parts. To obtain a known ground truth for calibration and
quantification of errors, a proxy was designed and manufactured (with a 3D printer) and
made to resemble the statistics of real Emmental cheese. This proxy, as well as a few
samples of real cheese, was imaged using an X-ray generator from several angles.
An algorithm was developed to find the locations of individual holes in a single two-
dimensional X-ray projection. This was achieved by specifying a cost function to be
minimised to obtain the most accurate reconstruction, and optimising it by translating
and scaling a set of ellipsoidal kernels corresponding to individual holes.
The characteristics of the kernels from two X-ray projections at different angles were
then matched and combined to produce a single 3-dimensional image. A simple similarity
score was computed to match the found holes in one 2D projection to those of the other,
and geometry was used to obtain 3D positions of the centres of the holes. Assuming
orthographic projection, the length of each hole along each axis was also reconstructed,
and a full 3D image was obtained from the positions.
Both the 2D and 3D matching steps proved somewhat prone to errors. The 2D match-
ing stage, while correctly matching many of the holes, had difficulty matching holes on
the sides of the image or holes which overlapped a lot with others. This is a particular
problem with the 3D-printed proxy used - real cheese shows less overlap between holes so
generally produces higher quality matches.
The 3D reconstruction stage matched holes in different projections correctly with
good accuracy, with no incorrect matches (which would have been judged as incorrect by
a human) observed. 3D reconstruction did a very good job of correctly finding the 3D
positions of the holes, with an rms error of just 4.5mm. On the other hand, the length of
each side of the hole was matched somewhat worse, with a 12% rms error on the length
in each direction and a 19% rms error on the volume. Nevertheless, this is a better result
than offered by core sampling, which itself distorts the length and volume of holes by
shearing them.
42](https://image.slidesharecdn.com/finaliibreport-170209094333/85/Venturini-X-ray-imaging-for-cheese-42-320.jpg)
![One problem that remains in the implementation used is the speed of the 2D optimi-
sation. It runs very slowly on high-resolution X-ray images of cheese, taking roughly an
hour on a standard PC. Subsampling improves this, but reduces accuracy. There remain
many computational savings to be had by optimising the code.
Obtaining a 3D reconstruction of the holes in cheese from X-ray images is a problem
which had never been specifically tackled in the literature. The method proposed in this
project, while imperfect and in need of improvements, represents the first viable solution
to this problem.
7.1 Future directions
There remain many improvements that can be made to the process described in this
project to make it more accurate and efficient.
The main problem encountered is the low speed of the 2D optimisation step. As
designed, it takes a very long time to converge to a stable solution, on the order of an
hour for a high-resolution X-ray image. While it is possible to speed it up by subsampling
the image to a lower resolution, this lowers the accuracy of optimisation.
A better optimisation technique with a variable step size would substantially reduce
the running time of the method, and could even lead to more accurate solutions. Even a
relatively simple algorithm, such as steepest-descent (with numerical derivatives) [24, 26]
could improve performance by a great deal. Since holes are fitted one at a time, it would
also be possible to preload a reconstruction with all the other holes, so that the objective
function does not need to obtain a new reconstruction and compute its rms error at each
iteration.
One major source of inaccuracy in optimisation which would be relatively easy to fix
is the 2D fitting of cut-off holes at the side of the image. These are not fit correctly as
fit holes must remain entirely within the image. This could be fixed relatively easily by
allowing kernels to be centred beyond the edges of the X-ray image, and improving the
quality of the fit.
One other feature which would improve the technique outlined here is a system to
recognise the edges of the cheese in the image and crop the image to contain only the
cheese. This could be done with simple edge detection [31], followed by cropping and
rotation, to make reconstruction invariant to cheese positioning.
7.1.1 Possible applications
The techniques developed in this report can potentially be used in more areas than the
quality control of cheese. The computational methods used are in no sense limited to
X-ray images, or cheese itself, and are able to find ellipsoidal objects in any image.
One area where this can potentially be of use is biological microscopy, where accurate
43](https://image.slidesharecdn.com/finaliibreport-170209094333/85/Venturini-X-ray-imaging-for-cheese-43-320.jpg)
![automated cell counting is an active area of research [32]. Apart from providing a count of
the cells, the techniques developed here could be used to find the specific location and size
of cells in a sample and even produce a three-dimensional reconstruction of the sample at
a microscopic scale.
44](https://image.slidesharecdn.com/finaliibreport-170209094333/85/Venturini-X-ray-imaging-for-cheese-44-320.jpg)
![References
[1] Bachmann H.-P., U. Bütikofer, D. Isolini. Encyclopedia of Dairy Sciences. FAM,
Swiss Federal Dairy Research Station; August 2001.
[2] Sherman J.M. “The Cause of Eyes and Characteristic Flavor in Emmental or Swiss
Cheese”. Journal of Bacteriology, 6, no. 4 (1921): pp. 379-393.
[3] “Cheese trier.” U.S. Patent 2,362,090, issued November 7, 1944.
[4] Brosnan T., D-W. Sun, “Improving quality inspection of food products by computer
vision – a review”. Journal of Food Engineering, 61, no. 1 (January 2004): pp. 3–16.
[5] Jamieson V., “Physics raises food standards”. Physics World, 15, no.1 (2002): pp.
21–22.
[6] Han Y.J., S.V. Bowers, R.B. Dodd, “Nondestructive detection of split–pit peaches”.
Transactions of the ASAE, 35, no.6 (1992): pp. 2063–2067.
[7] Kraggerhud H., Wold, J. P., Høy, M. and Abrahamsen, R. K. , “X-ray images for
the control of eye formation in cheese”. International Journal of Dairy Technology,
62 (2009): pp. 147–153.
[8] Caccamo M., Melilli, C.M. et al. “Measurement of gas holes and mechanical openness
in cheese by image analysis”. Journal of Dairy Science, 87, no. 3 (April 2004): pp.
739-48.
[9] Eskelinen J.J., A.P. Alavuotunki et al., “Preliminary Study of Ultrasonic Structural
Quality Control of Swiss-Type Cheese”. Journal of Dairy Science, 90, no. 9 (Septem-
ber 2007): pp. 4071–4077.
[10] Mussea M., S. Challois et al., “MRI method for investigation of eye growth in semi-
hard cheese”. Journal of Food Engineering, 121 (January 2014): pp. 152–158.
[11] Swinehart D. F. “The Beer-Lambert Law”. Journal of Chemical Education, 39, no.7
(January 1972): p. 333.
[12] ICRU, “Tissue Substitutes in Radiation Dosimetry and Measurement”, Report 44 of
the International Commission on Radiation Units and Measurements (1989).
[13] Koch H. W., and J. W. Motz. “Bremsstrahlung cross-section formulas and related
data.” Reviews of Modern Physics, 31, no. 4 (1959): p. 920.
[14] Cheyney Design, “X-ray Generator High Performance Air-Cooled Monoblock” CDD
XG datasheet, November 2015.
45](https://image.slidesharecdn.com/finaliibreport-170209094333/85/Venturini-X-ray-imaging-for-cheese-45-320.jpg)
![[15] Hsieh J. Computed tomography: principles, design, artifacts, and recent advances.
Bellingham, WA: SPIE—The International Society for Optical Engineering; 2003.
[16] Wong C.Y., Lin, Ren and Kwok, “A Survey on Ellipse Detection Methods”. IEEE
International Symposium on Industrial Electronics, May 2012
[17] Duda, R. O., P. E. Hart, “Use of the Hough Transformation to Detect Lines and
Curves in Pictures,” Comm. ACM ,15 (January 1972): pp. 11–15.
[18] Nair P., A. Saunders et al., “Hough transform based ellipse detection algorithm,”
Pattern Recognition Letters, 17, no. 7 (1996): pp. 777–784.
[19] Hartley R. I., P. Sturm, “Triangulation”. Computer Vision and Image Understanding,
68 (November 1997): pp. 146–157.
[20] Ultimaker B.V., “Ultimaker 2 User Manual” Ultimaker 2 datasheet, November 2014.s
[21] OpenSCAD Release 2015.03, The OpenSCAD Developers.
[22] Drumright, R.E., P.R. Gruber, and D.E. Henton. “Polylactic acid technology.” Ad-
vanced materials, 12, no. 23 (2000): pp. 1841-1846.
[23] MATLAB Release 2015a, The MathWorks, Inc., Natick, Massachusetts, United
States.
[24] Battiti, R. “First-and second-order methods for learning: between steepest descent
and Newton’s method.” Neural computation, 4, no. 2 (1992): pp. 141-166.
[25] Jacobs, R.A. “Increased rates of convergence through learning rate adaptation.” Neu-
ral networks, 1, no. 4 (1988): pp. 295-307.
[26] Nocedal J., and S. Wright. Numerical optimization. Springer Science & Business
Media, 2006.
[27] Rios L.M. and Sahinidis, N.V. “Derivative-free optimization: a review of algorithms
and comparison of software implementations”. Journal of Global Optimization, 56,
no.3 (2013): pp. 1247-1293.
[28] Pratt W. K. Digital Image Processing, New York, NY: John Wiley & Sons, Inc. 2nd
edn (1991), pp 651–668.
[29] Casiraghi E.M., Bagley E.B., Christianson D.D. “Behavior of mozzarella, cheddar and
processed cheese spread in lubricated and bonded uniaxial compression”. Journal of
Texture Studies, 16, no. 3 (September 1985):pp. 281-301.
46](https://image.slidesharecdn.com/finaliibreport-170209094333/85/Venturini-X-ray-imaging-for-cheese-46-320.jpg)
![[30] Clark, W.M. “On the formation of “eyes” in Emmental cheese.” Journal of Dairy
Science, 1, no.2 (1917): pp. 91-113.
[31] Canny, J. “A computational approach to edge detection.” IEEE Transactions on
Pattern Analysis and Machine Intelligence, 6 (1986): pp. 679-698.
[32] Benes, F.M. et al. “Two-dimensional versus three-dimensional cell counting: a prac-
tical perspective”. Trends in Neurosciences, 24 , no. 1 (2001): pp. 11-17
47](https://image.slidesharecdn.com/finaliibreport-170209094333/85/Venturini-X-ray-imaging-for-cheese-47-320.jpg)