Download to read offline

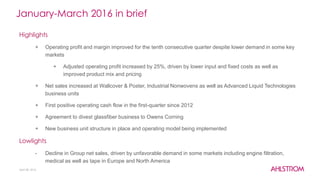
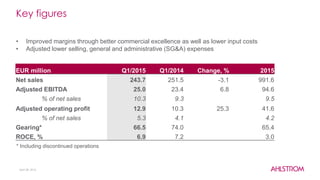
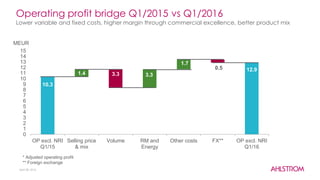
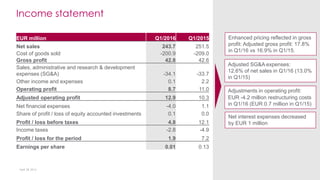
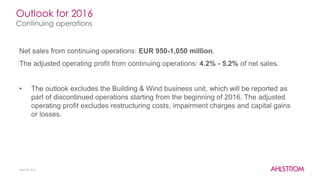

Ahlstrom's Q1 2016 report highlights improved operating profit and margin for the tenth consecutive quarter, driven by lower costs and a better product mix, despite a decline in group net sales. The report indicates positive cash flow for the first time since 2012 and a new business structure in place, while the company plans to divest its glassfiber business. The outlook for 2016 anticipates net sales between EUR 950-1,050 million, excluding the divested building & wind business unit.


