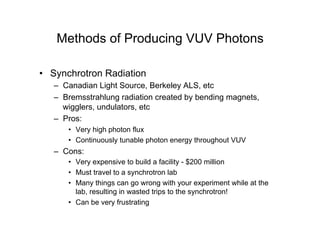
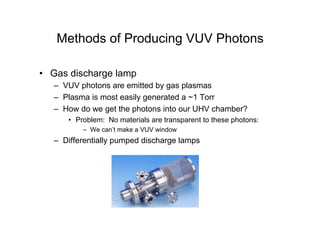
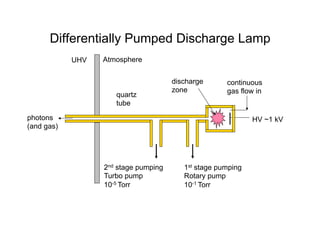
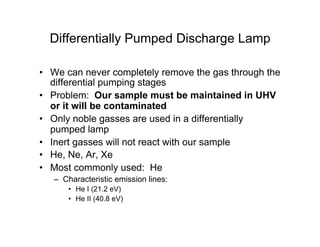
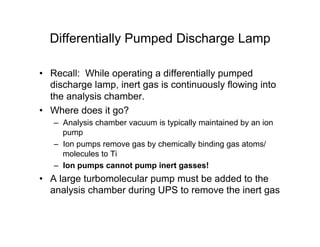
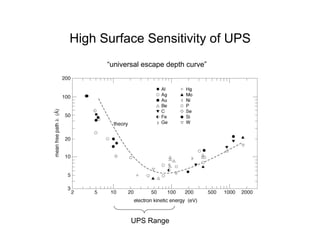
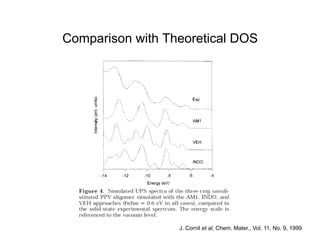
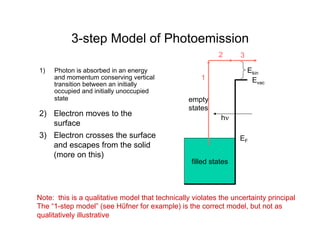
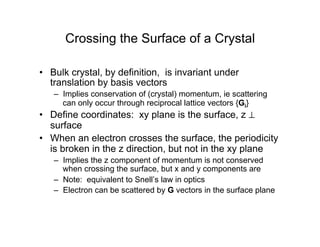
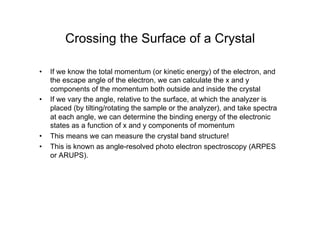
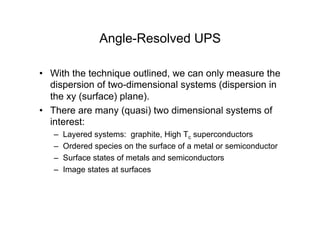
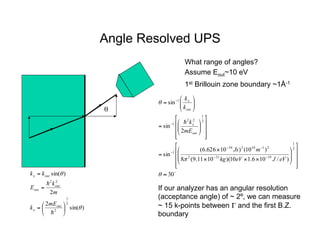
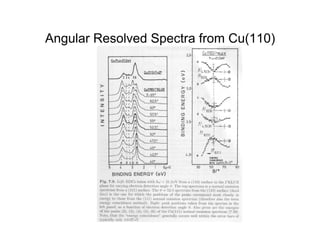
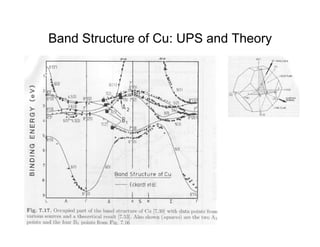
Ultraviolet Photoelectron Spectroscopy
(UPS)
• Similar to XPS
• Photon Energy Range
– VUV – “Vacuum Ultraviolet”
– Typically 10eV-100eV
• Probes valence states, not core levels
– Valence states are responsible for
• crystal/molecular bonding
• charge transport
• Much higher energy resolution possible
– A few meV vs ~1eV
• Higher surface sensitivity than XPS
Methods of Producing VUV Photons
• Synchrotron Radiation
– Canadian Light Source, Berkeley ALS, etc
– Bremsstrahlung radiation created by bending magnets,
wigglers, undulators, etc
– Pros:
• Very high photon flux
• Continuously tunable photon energy throughout VUV
– Cons:
• Very expensive to build a facility - $200 million
• Must travel to a synchrotron lab
• Many things can go wrong with your experiment while at the
lab, resulting in wasted trips to the synchrotron!
• Can be very frustrating
Methods of Producing VUV Photons
• Gas discharge lamp
– VUV photons are emitted by gas plasmas
– Plasma is most easily generated a ~1 Torr
– How do we get the photons into our UHV chamber?
• Problem: No materials are transparent to these photons:
– We can’t make a VUV window
– Differentially pumped discharge lamps
Differentially Pumped Discharge Lamp
HV ~1 kV
2nd stage pumping
Turbo pump
10-5 Torr
1st stage pumping
Rotary pump
10-1 Torr
continuous
gas flow in
discharge
zone
UHV Atmosphere
photons
(and gas)
quartz
tube
Differentially Pumped Discharge Lamp
• We can never completely remove the gas through the
differential pumping stages
• Problem: Our sample must be maintained in UHV
or it will be contaminated
• Only noble gasses are used in a differentially
pumped lamp
• Inert gasses will not react with our sample
• He, Ne, Ar, Xe
• Most commonly used: He
– Characteristic emission lines:
• He I (21.2 eV)
• He II (40.8 eV)
Differentially Pumped Discharge Lamp
• Recall: While operating a differentially pumped
discharge lamp, inert gas is continuously flowing into
the analysis chamber.
• Where does it go?
– Analysis chamber vacuum is typically maintained by an ion
pump
– Ion pumps remove gas by chemically binding gas atoms/
molecules to Ti
– Ion pumps cannot pump inert gasses!
• A large turbomolecular pump must be added to the
analysis chamber during UPS to remove the inert gas
Differentially Pumped Discharge Lamp
• Pros:
– Less expensive than a synchrotron: 40k vs 200M
– Can be housed in a small university lab
– Available for use every day
• Cons:
– Photon energy not tunable
• Limited to atomic emission lines
– Intensity cannot be easily tuned
– Many emission lines have fine structure (doublets, etc)
Valence vs Core levels
• For a given element, the core levels “look” largely the
same, regardless of the solid of which they are
constituents
– Core level shifts, depending on chemical environment
– Final state effects: shake-up, shake-off, asymmetric
broadening
• Valence states, however, hybridize with those of
neighbouring atoms due to wave function overlap
– New, localized hybrid orbitals, or
– Delocalized bands → crystal band structure
Valence vs Core Levels
• Identification of atomic core levels is (usually) clear
• Valence states, however, are more difficult to identify,
due to hybridization
– A hybridized orbital is, by definition, a combination of orbitals
of different atoms, not necessarily of the same species
– Large energy shifts occur due to hybridization, so binding
energy cannot unambiguously identify a spectral feature
– Delocalized energy bands disperse with momentum.
• Binding energy depends on the momentum of the state
(more on this later)
• Bandwidths vary (near zero to 10 eV or more)
– Detailed analysis of valence spectra typically require
theoretical modeling of the material being studied
Energy Resolution
• On the detection side, the energy resolution is
determined by the radius of the hemispherical energy
analyzer, its acceptance angle (slit width), and pass
energy
• From this perspective, the resolution of UPS and XPS
should be comparable if operated with the same
parameters
Pass Energy and Slit Width Determine
Resolution
V
V0
entrance/exit
slits:
0.5 mm
1 mm
2 mm
5 mm
detector
Pass Energy Ep =eV0
Resolution ΔE:
⎟
⎟
⎠
⎞
⎜
⎜
⎝
⎛
≅
Δ
0
2R
w
E
E p
380 375 370 365
870 875 880
Counts
/
sec
Binding Energy (eV)
Kinetic Energy (eV)
Ag 3d3/2
Ag 3d5/2
R0=150mm
For 5mm slit, the analyzer
resolution is ~1.5% of pass
energy
Energy Resolution
• For a 150mm hemispherical analyzer with 0.5 mm
slits and a 5 eV pass energy, 8 meV should be
possible
• We never achieve this resolution in XPS. Why?
– Excitation source linewidth: for a simple Al Kα x-ray source,
(hν = 1486.6 eV) the line width is around 0.75 eV
– Core hole lifetime broadening. The lifetime of the empty
core hole state is very short. By Heisenberg’s uncertainty
principle, this means that the binding energy of the state can
not be measured with arbitrary precision:
hole
core
the
of
lifetime
the
is
t
where
2
Δ
Δ
≥
Δ
t
E
!
• Valence hole states are much longer lived than core states
• VUV sources can have much narrower line widths
How do we determine our resolution?
• We measure the width of a spectral feature which has
a natural linewidth which is << than our instrumental
resolution
• Gas phase UPS of inert gas
• Fermi edge of a metal
Notes on Deriving Resolution from the
Fermi Edge
1) We are assuming the
density of states is almost
constant around EF
2) We assume that the Fermi-
Dirac function is
approximately a step
function, so the spectrum is
just a Gaussian convolved
with a step (note: this is just
the integral of a Gaussian)
3) In reality, the Fermi-Dirac
“step” is about 3.3 kT wide
(83 meV at RT)
4) If our resolution is better
than this, we must go to low
temperature
kT
E
E
kT
E
E
E
FD
kT
E
E
e
E
FD
F
F
F
kT
E
E F
66
.
1
0.16,
FD(E)
for
66
.
1
0.84,
FD(E)
for
1
)
(
1
ln
1
1
)
(
+
=
−
=
−
=
−
=
⎟
⎟
⎠
⎞
⎜
⎜
⎝
⎛
−
×
=
−
+
= −
How do we determine our resolution?
High Surface Sensitivity of UPS
“universal escape depth curve”
UPS Range
High Surface Sensitivity of UPS
• Pros
– High sensitivity to
surface species
– Study catalysis
– Study adsorbed
(sub) monolayers
– Study surface
reconstructions
• Cons
– Not a good bulk
probe
– Results are very
sensitive to surface
contamination
– Surface properties
can be very different
than bulk. Care
must be taken when
generalizing UPS to
bulk
Density of Valence States via UPS
• Kinetic energy of electron just outside
the sample is given by the photon
energy minus the binding energy
(relative to the vacuum) of the initial
state
• Kinetic energy is further modified by the
contact potential (difference in work
functions) between the sample and the
analyzer
• The kinetic energy measured at the
analyzer is Eka=Eks+(φs- φa)
EF
Sample Analyzer
φs	

φa	

Ei
Ef
Eks
Eka
vacuum
Binding energy of Ei with respect to the Fermi Energy is given by: Eb=hν-(Eka+φa)
Eb
hν
Example: Organics on Metals
• Growth of molecular layers and metal deposition in UHV
(10-10 Torr)
• Incremental build-up of interface + photoemission
spectroscopy
Valence
States
Core
levels
Density
of
States
Fermi Level
UPS
Spectrum
hν	

Substrate (Au/Si)
Metal (20nm)
Extracting Information from
UPS Data: CBP on Au
Photoemission
Onset (eV)
0.5 eV x3
Å
Å
Å
Å
Å
EF
CBP on Au
He I
Au
4
8
16
32
64
Intensity
(arb.
units)
Binding Energy Relative
to EF
(eV)
-12 -8 -4 0 4
0 1 2 3
-3V Sample
Bias
CBP
Au
EF
0.5 eV
4.9 eV
HOMO
LUMO
E vac
6.3 eV
3.1 eV
1.9 eV
Energy Levels
N
N
Hill et al., J.Appl.Phys. 84, 3236, (1998)
Comparison with Theoretical DOS
J. Cornil et al, Chem. Mater., Vol. 11, No. 9, 1999
UPS on Single Crystal Samples
• Inorganic semiconductors: Si, Ge, GaAs, InP, etc
• Electronic wavefunctions are no longer localized
– Crystalline periodicity and conservation of crystal momentum
– Dispersing bands, rather than discrete energy levels
• Enables the study of crystalline energy band structure
θi	

θd	

€
Δpath = a(sin(θd ) − sin(θi )) = mλ = m
2π
k
k ((sin(θd ) − sin(θi )) = m
2π
a
but Δk|| = k ((sin(θd ) − sin(θi ))
Δk|| = m
2π
a
= m
!
G, m = 0,±1,±2,...
a
a sin(θd)
a sin(θi)
Elastic Scattering by a 1-D Lattice
• Plane wave in/plane wave out
• For an outgoing wave, we need
constructive interference of the
scattered waves
• Constructive interference
requires a path length difference
of an integer multiple of
wavelengths
• Elastic scattering can only occur
for changes in the wave vector
parallel to the lattice which are
multiples of the reciprocal lattice
vector, G
• Result of the translational
symmetry of the lattice
• For 3-D lattice, constraints for
the other dimensions
€
Δpath = a(sin(θd ) − sin(θi )) = mλ = m
2π
k
k ((sin(θd ) − sin(θi )) = m
2π
a
but Δk|| = k ((sin(θd ) − sin(θi ))
Δk|| = m
2π
a
= m
!
G, m = 0,±1,±2,...
-2 -1 0 1 2
wave vector (pi/a)
Energy
Reduced Zone Scheme and Optical Transitions
• Bloch states can be elastically
scattered by a reciprocal lattice
vector
• We treat states differing by a
reciprocal lattice vector as
equivalent
G
G
-2 -1 0 1 2
wave vector (pi/a)
Energy
• Optical transitions must
conserve momentum and
energy
• If photon momentum is ~0
(true for UPS, not for XPS),
transitions must be vertical
hν
3-step Model of Photoemission
1) Photon is absorbed in an energy
and momentum conserving vertical
transition between an initially
occupied and initially unoccupied
state
2) Electron moves to the
surface
3) Electron crosses the surface
and escapes from the solid
(more on this)
filled states
EF
empty
states
Evac
hν
1
2
Ekin
3
Note: this is a qualitative model that technically violates the uncertainty principal
The “1-step model” (see Hűfner for example) is the correct model, but not as
qualitatively illustrative
Crossing the Surface of a Crystal
• Bulk crystal, by definition, is invariant under
translation by basis vectors
– Implies conservation of (crystal) momentum, ie scattering
can only occur through reciprocal lattice vectors {Gi}
• Define coordinates: xy plane is the surface, z ⊥
surface
• When an electron crosses the surface, the periodicity
is broken in the z direction, but not in the xy plane
– Implies the z component of momentum is not conserved
when crossing the surface, but x and y components are
– Note: equivalent to Snell’s law in optics
– Electron can be scattered by G vectors in the surface plane
Crossing the Surface of a Crystal
• If we know the total momentum (or kinetic energy) of the electron, and
the escape angle of the electron, we can calculate the x and y
components of the momentum both outside and inside the crystal
• If we vary the angle, relative to the surface, at which the analyzer is
placed (by tilting/rotating the sample or the analyzer), and take spectra
at each angle, we can determine the binding energy of the electronic
states as a function of x and y components of momentum
• This means we can measure the crystal band structure!
• This is known as angle-resolved photo electron spectroscopy (ARPES
or ARUPS).
Angle-Resolved UPS
• With the technique outlined, we can only measure the
dispersion of two-dimensional systems (dispersion in
the xy (surface) plane).
• There are many (quasi) two dimensional systems of
interest:
– Layered systems: graphite, High Tc superconductors
– Ordered species on the surface of a metal or semiconductor
– Surface states of metals and semiconductors
– Image states at surfaces
Angle Resolved UPS
θ	

)
sin(
2
2
)
sin(
2
1
2
2
2
θ
θ
⎟
⎠
⎞
⎜
⎝
⎛
=
=
=
!
!
out
x
out
out
out
x
mE
k
m
k
E
k
k
What range of angles?
Assume Eout~10 eV
1st Brillouin zone boundary ~1Å-1
!
"
30
)
/
10
6
.
1
10
)(
10
11
.
9
(
8
)
10
(
)
10
626
.
6
(
sin
2
sin
sin
2
1
19
31
2
2
1
10
2
34
1
2
1
2
2
1
1
≈
⎥
⎥
⎥
⎦
⎤
⎢
⎢
⎢
⎣
⎡
⎟
⎟
⎠
⎞
⎜
⎜
⎝
⎛
×
×
×
×
=
⎥
⎥
⎥
⎦
⎤
⎢
⎢
⎢
⎣
⎡
⎟
⎟
⎠
⎞
⎜
⎜
⎝
⎛
=
⎟
⎟
⎠
⎞
⎜
⎜
⎝
⎛
=
−
−
−
−
−
−
−
θ
π
θ
eV
J
eV
kg
m
Js
mE
k
k
k
out
x
out
x
If our analyzer has an angular resolution
(acceptance angle) of ~ 2º, we can measure
~ 15 k-points between Γ and the first B.Z.
boundary
Band Structure of Graphite
Sugawara et al
Phys Rev B 73 (4) (2006)
Why can’t we do the same thing with
XPS?
• The momentum of an x-ray photon is significant
compared to the momentum of the electrons in the
solid.
– Transitions are not vertical, so we don’t know the momentum
of the initial state even if we measure that of the
photoelectron
• Because the kinetic energies of the photoelectrons
are so large (1.5 keV), the angle at the first boundary
is only 1-2º
• Using XPS to measure valence states results in an
angle integrated, not resolved measurement
Can we measure 3D band structures with UPS?
• Yes! but only at a synchrotron…
• Problem: for a (vertical) optical transition
to occur within the 3D band structure, the
initial and final states (at the same
momentum) must be separated by an
energy equal to the photon energy
• We need to be able to scan the photon
energy in order to observe transitions
• Very complicated, requiring knowledge (or
assumptions) about the final state (ie free
electron-like at high kinetic energies)
• See S. Hűfner, “Photoelectron
Spectroscopy”, section 7.3 for discussion
-2 -1 0 1 2
wave vector (pi/a)
Energy
hν
Angular Resolved Spectra from Cu(110)
Band Structure of Cu: UPS and Theory

UV PES.pdf

  • 1.
    Ultraviolet Photoelectron Spectroscopy (UPS) •Similar to XPS • Photon Energy Range – VUV – “Vacuum Ultraviolet” – Typically 10eV-100eV • Probes valence states, not core levels – Valence states are responsible for • crystal/molecular bonding • charge transport • Much higher energy resolution possible – A few meV vs ~1eV • Higher surface sensitivity than XPS
  • 2.
    Methods of ProducingVUV Photons • Synchrotron Radiation – Canadian Light Source, Berkeley ALS, etc – Bremsstrahlung radiation created by bending magnets, wigglers, undulators, etc – Pros: • Very high photon flux • Continuously tunable photon energy throughout VUV – Cons: • Very expensive to build a facility - $200 million • Must travel to a synchrotron lab • Many things can go wrong with your experiment while at the lab, resulting in wasted trips to the synchrotron! • Can be very frustrating
  • 3.
    Methods of ProducingVUV Photons • Gas discharge lamp – VUV photons are emitted by gas plasmas – Plasma is most easily generated a ~1 Torr – How do we get the photons into our UHV chamber? • Problem: No materials are transparent to these photons: – We can’t make a VUV window – Differentially pumped discharge lamps
  • 4.
    Differentially Pumped DischargeLamp HV ~1 kV 2nd stage pumping Turbo pump 10-5 Torr 1st stage pumping Rotary pump 10-1 Torr continuous gas flow in discharge zone UHV Atmosphere photons (and gas) quartz tube
  • 5.
    Differentially Pumped DischargeLamp • We can never completely remove the gas through the differential pumping stages • Problem: Our sample must be maintained in UHV or it will be contaminated • Only noble gasses are used in a differentially pumped lamp • Inert gasses will not react with our sample • He, Ne, Ar, Xe • Most commonly used: He – Characteristic emission lines: • He I (21.2 eV) • He II (40.8 eV)
  • 6.
    Differentially Pumped DischargeLamp • Recall: While operating a differentially pumped discharge lamp, inert gas is continuously flowing into the analysis chamber. • Where does it go? – Analysis chamber vacuum is typically maintained by an ion pump – Ion pumps remove gas by chemically binding gas atoms/ molecules to Ti – Ion pumps cannot pump inert gasses! • A large turbomolecular pump must be added to the analysis chamber during UPS to remove the inert gas
  • 7.
    Differentially Pumped DischargeLamp • Pros: – Less expensive than a synchrotron: 40k vs 200M – Can be housed in a small university lab – Available for use every day • Cons: – Photon energy not tunable • Limited to atomic emission lines – Intensity cannot be easily tuned – Many emission lines have fine structure (doublets, etc)
  • 8.
    Valence vs Corelevels • For a given element, the core levels “look” largely the same, regardless of the solid of which they are constituents – Core level shifts, depending on chemical environment – Final state effects: shake-up, shake-off, asymmetric broadening • Valence states, however, hybridize with those of neighbouring atoms due to wave function overlap – New, localized hybrid orbitals, or – Delocalized bands → crystal band structure
  • 9.
    Valence vs CoreLevels • Identification of atomic core levels is (usually) clear • Valence states, however, are more difficult to identify, due to hybridization – A hybridized orbital is, by definition, a combination of orbitals of different atoms, not necessarily of the same species – Large energy shifts occur due to hybridization, so binding energy cannot unambiguously identify a spectral feature – Delocalized energy bands disperse with momentum. • Binding energy depends on the momentum of the state (more on this later) • Bandwidths vary (near zero to 10 eV or more) – Detailed analysis of valence spectra typically require theoretical modeling of the material being studied
  • 10.
    Energy Resolution • Onthe detection side, the energy resolution is determined by the radius of the hemispherical energy analyzer, its acceptance angle (slit width), and pass energy • From this perspective, the resolution of UPS and XPS should be comparable if operated with the same parameters
  • 11.
    Pass Energy andSlit Width Determine Resolution V V0 entrance/exit slits: 0.5 mm 1 mm 2 mm 5 mm detector Pass Energy Ep =eV0 Resolution ΔE: ⎟ ⎟ ⎠ ⎞ ⎜ ⎜ ⎝ ⎛ ≅ Δ 0 2R w E E p 380 375 370 365 870 875 880 Counts / sec Binding Energy (eV) Kinetic Energy (eV) Ag 3d3/2 Ag 3d5/2 R0=150mm For 5mm slit, the analyzer resolution is ~1.5% of pass energy
  • 12.
    Energy Resolution • Fora 150mm hemispherical analyzer with 0.5 mm slits and a 5 eV pass energy, 8 meV should be possible • We never achieve this resolution in XPS. Why? – Excitation source linewidth: for a simple Al Kα x-ray source, (hν = 1486.6 eV) the line width is around 0.75 eV – Core hole lifetime broadening. The lifetime of the empty core hole state is very short. By Heisenberg’s uncertainty principle, this means that the binding energy of the state can not be measured with arbitrary precision: hole core the of lifetime the is t where 2 Δ Δ ≥ Δ t E ! • Valence hole states are much longer lived than core states • VUV sources can have much narrower line widths
  • 13.
    How do wedetermine our resolution? • We measure the width of a spectral feature which has a natural linewidth which is << than our instrumental resolution • Gas phase UPS of inert gas • Fermi edge of a metal
  • 14.
    Notes on DerivingResolution from the Fermi Edge 1) We are assuming the density of states is almost constant around EF 2) We assume that the Fermi- Dirac function is approximately a step function, so the spectrum is just a Gaussian convolved with a step (note: this is just the integral of a Gaussian) 3) In reality, the Fermi-Dirac “step” is about 3.3 kT wide (83 meV at RT) 4) If our resolution is better than this, we must go to low temperature kT E E kT E E E FD kT E E e E FD F F F kT E E F 66 . 1 0.16, FD(E) for 66 . 1 0.84, FD(E) for 1 ) ( 1 ln 1 1 ) ( + = − = − = − = ⎟ ⎟ ⎠ ⎞ ⎜ ⎜ ⎝ ⎛ − × = − + = −
  • 15.
    How do wedetermine our resolution?
  • 16.
    High Surface Sensitivityof UPS “universal escape depth curve” UPS Range
  • 17.
    High Surface Sensitivityof UPS • Pros – High sensitivity to surface species – Study catalysis – Study adsorbed (sub) monolayers – Study surface reconstructions • Cons – Not a good bulk probe – Results are very sensitive to surface contamination – Surface properties can be very different than bulk. Care must be taken when generalizing UPS to bulk
  • 18.
    Density of ValenceStates via UPS • Kinetic energy of electron just outside the sample is given by the photon energy minus the binding energy (relative to the vacuum) of the initial state • Kinetic energy is further modified by the contact potential (difference in work functions) between the sample and the analyzer • The kinetic energy measured at the analyzer is Eka=Eks+(φs- φa) EF Sample Analyzer φs φa Ei Ef Eks Eka vacuum Binding energy of Ei with respect to the Fermi Energy is given by: Eb=hν-(Eka+φa) Eb hν
  • 19.
    Example: Organics onMetals • Growth of molecular layers and metal deposition in UHV (10-10 Torr) • Incremental build-up of interface + photoemission spectroscopy Valence States Core levels Density of States Fermi Level UPS Spectrum hν Substrate (Au/Si) Metal (20nm)
  • 20.
    Extracting Information from UPSData: CBP on Au Photoemission Onset (eV) 0.5 eV x3 Å Å Å Å Å EF CBP on Au He I Au 4 8 16 32 64 Intensity (arb. units) Binding Energy Relative to EF (eV) -12 -8 -4 0 4 0 1 2 3 -3V Sample Bias CBP Au EF 0.5 eV 4.9 eV HOMO LUMO E vac 6.3 eV 3.1 eV 1.9 eV Energy Levels N N Hill et al., J.Appl.Phys. 84, 3236, (1998)
  • 21.
    Comparison with TheoreticalDOS J. Cornil et al, Chem. Mater., Vol. 11, No. 9, 1999
  • 22.
    UPS on SingleCrystal Samples • Inorganic semiconductors: Si, Ge, GaAs, InP, etc • Electronic wavefunctions are no longer localized – Crystalline periodicity and conservation of crystal momentum – Dispersing bands, rather than discrete energy levels • Enables the study of crystalline energy band structure
  • 23.
    θi θd € Δpath = a(sin(θd) − sin(θi )) = mλ = m 2π k k ((sin(θd ) − sin(θi )) = m 2π a but Δk|| = k ((sin(θd ) − sin(θi )) Δk|| = m 2π a = m ! G, m = 0,±1,±2,... a a sin(θd) a sin(θi) Elastic Scattering by a 1-D Lattice • Plane wave in/plane wave out • For an outgoing wave, we need constructive interference of the scattered waves • Constructive interference requires a path length difference of an integer multiple of wavelengths • Elastic scattering can only occur for changes in the wave vector parallel to the lattice which are multiples of the reciprocal lattice vector, G • Result of the translational symmetry of the lattice • For 3-D lattice, constraints for the other dimensions € Δpath = a(sin(θd ) − sin(θi )) = mλ = m 2π k k ((sin(θd ) − sin(θi )) = m 2π a but Δk|| = k ((sin(θd ) − sin(θi )) Δk|| = m 2π a = m ! G, m = 0,±1,±2,...
  • 24.
    -2 -1 01 2 wave vector (pi/a) Energy Reduced Zone Scheme and Optical Transitions • Bloch states can be elastically scattered by a reciprocal lattice vector • We treat states differing by a reciprocal lattice vector as equivalent G G -2 -1 0 1 2 wave vector (pi/a) Energy • Optical transitions must conserve momentum and energy • If photon momentum is ~0 (true for UPS, not for XPS), transitions must be vertical hν
  • 25.
    3-step Model ofPhotoemission 1) Photon is absorbed in an energy and momentum conserving vertical transition between an initially occupied and initially unoccupied state 2) Electron moves to the surface 3) Electron crosses the surface and escapes from the solid (more on this) filled states EF empty states Evac hν 1 2 Ekin 3 Note: this is a qualitative model that technically violates the uncertainty principal The “1-step model” (see Hűfner for example) is the correct model, but not as qualitatively illustrative
  • 26.
    Crossing the Surfaceof a Crystal • Bulk crystal, by definition, is invariant under translation by basis vectors – Implies conservation of (crystal) momentum, ie scattering can only occur through reciprocal lattice vectors {Gi} • Define coordinates: xy plane is the surface, z ⊥ surface • When an electron crosses the surface, the periodicity is broken in the z direction, but not in the xy plane – Implies the z component of momentum is not conserved when crossing the surface, but x and y components are – Note: equivalent to Snell’s law in optics – Electron can be scattered by G vectors in the surface plane
  • 27.
    Crossing the Surfaceof a Crystal • If we know the total momentum (or kinetic energy) of the electron, and the escape angle of the electron, we can calculate the x and y components of the momentum both outside and inside the crystal • If we vary the angle, relative to the surface, at which the analyzer is placed (by tilting/rotating the sample or the analyzer), and take spectra at each angle, we can determine the binding energy of the electronic states as a function of x and y components of momentum • This means we can measure the crystal band structure! • This is known as angle-resolved photo electron spectroscopy (ARPES or ARUPS).
  • 28.
    Angle-Resolved UPS • Withthe technique outlined, we can only measure the dispersion of two-dimensional systems (dispersion in the xy (surface) plane). • There are many (quasi) two dimensional systems of interest: – Layered systems: graphite, High Tc superconductors – Ordered species on the surface of a metal or semiconductor – Surface states of metals and semiconductors – Image states at surfaces
  • 29.
    Angle Resolved UPS θ ) sin( 2 2 ) sin( 2 1 2 2 2 θ θ ⎟ ⎠ ⎞ ⎜ ⎝ ⎛ = = = ! ! out x out out out x mE k m k E k k Whatrange of angles? Assume Eout~10 eV 1st Brillouin zone boundary ~1Å-1 ! " 30 ) / 10 6 . 1 10 )( 10 11 . 9 ( 8 ) 10 ( ) 10 626 . 6 ( sin 2 sin sin 2 1 19 31 2 2 1 10 2 34 1 2 1 2 2 1 1 ≈ ⎥ ⎥ ⎥ ⎦ ⎤ ⎢ ⎢ ⎢ ⎣ ⎡ ⎟ ⎟ ⎠ ⎞ ⎜ ⎜ ⎝ ⎛ × × × × = ⎥ ⎥ ⎥ ⎦ ⎤ ⎢ ⎢ ⎢ ⎣ ⎡ ⎟ ⎟ ⎠ ⎞ ⎜ ⎜ ⎝ ⎛ = ⎟ ⎟ ⎠ ⎞ ⎜ ⎜ ⎝ ⎛ = − − − − − − − θ π θ eV J eV kg m Js mE k k k out x out x If our analyzer has an angular resolution (acceptance angle) of ~ 2º, we can measure ~ 15 k-points between Γ and the first B.Z. boundary
  • 30.
    Band Structure ofGraphite Sugawara et al Phys Rev B 73 (4) (2006)
  • 31.
    Why can’t wedo the same thing with XPS? • The momentum of an x-ray photon is significant compared to the momentum of the electrons in the solid. – Transitions are not vertical, so we don’t know the momentum of the initial state even if we measure that of the photoelectron • Because the kinetic energies of the photoelectrons are so large (1.5 keV), the angle at the first boundary is only 1-2º • Using XPS to measure valence states results in an angle integrated, not resolved measurement
  • 32.
    Can we measure3D band structures with UPS? • Yes! but only at a synchrotron… • Problem: for a (vertical) optical transition to occur within the 3D band structure, the initial and final states (at the same momentum) must be separated by an energy equal to the photon energy • We need to be able to scan the photon energy in order to observe transitions • Very complicated, requiring knowledge (or assumptions) about the final state (ie free electron-like at high kinetic energies) • See S. Hűfner, “Photoelectron Spectroscopy”, section 7.3 for discussion -2 -1 0 1 2 wave vector (pi/a) Energy hν
  • 33.
  • 34.
    Band Structure ofCu: UPS and Theory