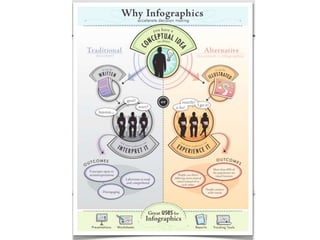
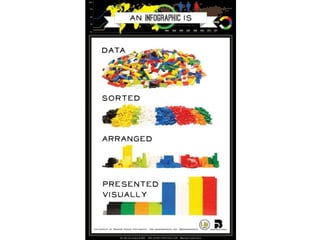
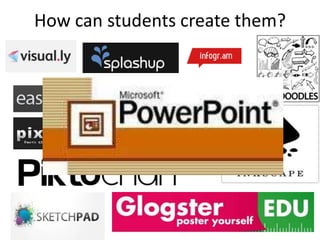
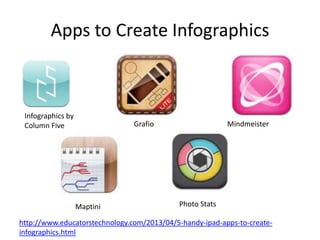
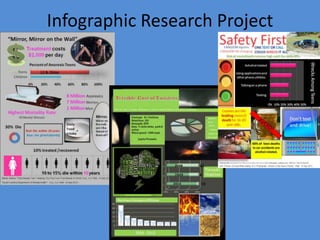
SlideShare a Scribd company logo
Infographics: show me the
data
Tamara cox
Palmetto
middle
Definition
• Infographics are visual representations of
information, data or knowledge
• Use when you need to explain complex
information quickly
460 Connected Internet Devices
Why should we use them?
• Approximately 65% of people are visual learners
• Information literacy standards are included in
ISTE NETS and Common Core: CCSS.ELA-Literacy.RI.6.7 Integrate
information presented in different media or formats (e.g., visually, quantitatively) as
well as in words to develop a coherent understanding of a topic or issue.
• They require a higher level of thinking (analyze
and create)
• They inject rigor into your classroom
• They are fun!!
Where do you find them?
Links:
http://dailyinfographic.com/
http://www.coolinfographics.com/
http://pinterest.com
How do you use them with students?
• Share one for a warm up to introduce topic
• Have students search for infographics on a topic
and share with the class
• Compare two infographics on the same topic
• Ask students to fact check infographics
• Have students create math problems using data
from an infographic
• Require students to locate and explain data from
an infographic
• Have students create their own!
Infographic
Safari
Mrs. Cox, Palmetto Middle
Librarian, 2013
How can students create them?
Apps to Create Infographics
Infographics by
Column Five Grafio Mindmeister
Maptini Photo Stats
http://www.educatorstechnology.com/2013/04/5-handy-ipad-apps-to-create-
infographics.html
Infographic Research Project
Infographic Teaching Resources
• NY Times Learning Blog Posts:
http://learning.blogs.nytimes.com/2010/08/23/teachin
g-with-infographics-places-to-start/
• Kathy Schrock’s Guide:
http://www.schrockguide.net/infographics-as-an-
assessment.html
• Free Tech 4 Teachers posts:
http://www.freetech4teachers.com/2012/12/500-cool-
infographics.html
• Scribd Guide:
http://www.educatorstechnology.com/2013/03/excelle
nt-tips-and-tools-to-create.html
Steps To Create an Infographic
1. Become familiar with the ways to visualize
data
2. Research and collect data and citations
3. Hand sketch a draft
4. Gather images and record citations
5. Pick colors and fonts based on message
6. Create infographic with citations
Step 1: Explore types of infographics
Step 2: Research and collect data
• Books
• DISCUS Articles
• Magazines
• Newspapers
• Web sites
• Use citationmachine.net to create MLA
citations.
Step 3: Hand sketch a draft
http://www.123rf.com/photo_11073871_hand-drawn-infographics.html
Step 4: Gather images and cite
• Pics 4 Learning:
http://www.pics4learning.com/
• Clip Art ETC: http://etc.usf.edu/clipart/
• Edupics: http://www.edupics.com/
• Photl: http://www.photl.com/
• PicFindr: http://www.picfindr.com/
Step 5: Pick colors and fonts
Color Schemes That Work
• Yellow on blue blackground
Color Schemes That Work
• White on black background
Color Schemes That Work
• Black on yellow background
Colors to Avoid
• Red on green is hard for those with
colorblindness
Colors to Avoid
• If you want to use red, go for burgundy
instead
• Red causes an agitated emotional response
Colors Evoke Emotion
• Green makes the viewer feel involved with
topic
• Blue indicates a calm message
• Yellow is for hope and cheerfulness
• Purple is childlike, save for “light” topics
• Black indicates power
Fonts
• Type can express mood and emotion
• Do not use more than three different fonts
• Bookman, Garamond, and Times New
Roman are good for large blocks of text
• Arial and Comic Sans are good for headlines
• Make limited use of CAPITAL LETTERS
Step 6: Create infographic and cite
sources
• Power Point will be used to create the
infographic
• Rubric Overview
• Don’t forget citations
Power Point Tricks to Know
• Bring to Front, Send to Back
• Set color transparent
• Change slide orientation
• Create graphs in Excel and Paste in
• Save as JPEG
Sources
Schrock, Kathy. “Power Point Etiquette” Slideshare Presentation,
http://www.slideshare.net/kathyschrock/powerpoint-for-administrators
Links to infographics used:
http://www.123rf.com/photo_11073871_hand-drawn-infographics.html
http://idea4invention.com/articles/electric-car-inventions-timeline-infographic
http://www.mobypicture.com/user/JeeeM/view/7788306
http://mashable.com/2012/07/18/lego-infographic/
http://www.markedlines.com/a-roundup-of-25-jaw-dropping-infographics/
http://www.clicksoftware.com/national-critical-planning-infrastructure-management-
during-summer.htm
http://www.coolinfographics.com/blog/2013/3/19/ink-costs-more-than-human-
blood.html
http://www.coolinfographics.com/blog/2013/3/22/460-million-connected-internet-
devices.html
http://visual.ly/anatomy-teacher

More Related Content

What's hot

Vsra 2014 presentation_Jennifer Floyd
Vsra 2014 presentation_Jennifer FloydVsra 2014 presentation_Jennifer Floyd
Vsra 2014 presentation_Jennifer Floyd
floydjennifera
 
Macul bookclubs 13
Macul bookclubs 13Macul bookclubs 13
Macul bookclubs 13elizkeren
 
Handout slides for engaging the internet vea_november 2014
Handout slides for engaging the internet vea_november 2014Handout slides for engaging the internet vea_november 2014
Handout slides for engaging the internet vea_november 2014
Jennifer Floyd
 
Engaging the internet vea november 2014
Engaging the internet vea november 2014Engaging the internet vea november 2014
Engaging the internet vea november 2014Jennifer Floyd
 
Game on macul_final
Game on macul_finalGame on macul_final
Game on macul_finalelizkeren
 
Exds 2001 international projects
Exds 2001 international projectsExds 2001 international projects
Exds 2001 international projectsTraciwm
 
Game on macul_final
Game on macul_finalGame on macul_final
Game on macul_finalelizkeren
 
Week 4 media 2 - ruth f inal
Week 4   media 2 - ruth f inalWeek 4   media 2 - ruth f inal
Week 4 media 2 - ruth f inal
rmcquirter
 
Unpacking Steps 3 to5 of The Big Six Research Process
Unpacking Steps 3 to5 of The Big Six Research ProcessUnpacking Steps 3 to5 of The Big Six Research Process
Unpacking Steps 3 to5 of The Big Six Research Process
ekhoogestraat
 
YA Lit Symposium Presentation
YA Lit Symposium PresentationYA Lit Symposium Presentation
YA Lit Symposium Presentation
Karin Perry
 
Using blogs as a core part of class activity
Using blogs as a core part of class activityUsing blogs as a core part of class activity
Using blogs as a core part of class activity
Sheila Webber
 
T4E Tweeting And Posting Without A Computer
T4E Tweeting And Posting Without A ComputerT4E Tweeting And Posting Without A Computer
T4E Tweeting And Posting Without A Computer
Scott Haselwood
 
Opening Keynote for Informa Conference on Social Learning
Opening Keynote for Informa Conference on Social LearningOpening Keynote for Informa Conference on Social Learning
Opening Keynote for Informa Conference on Social LearningStella Lee
 
NCTE Presentation 2012
NCTE Presentation 2012NCTE Presentation 2012
NCTE Presentation 2012Karin Perry
 
Olympic WebQuest
Olympic WebQuestOlympic WebQuest
Olympic WebQuestsmheat
 
Education of the 21st century MLIS student for technical agility.
Education of the 21st century MLIS student for technical agility.Education of the 21st century MLIS student for technical agility.
Education of the 21st century MLIS student for technical agility.
Steven MacCall
 

What's hot (16)

Vsra 2014 presentation_Jennifer Floyd
Vsra 2014 presentation_Jennifer FloydVsra 2014 presentation_Jennifer Floyd
Vsra 2014 presentation_Jennifer Floyd
 
Macul bookclubs 13
Macul bookclubs 13Macul bookclubs 13
Macul bookclubs 13
 
Handout slides for engaging the internet vea_november 2014
Handout slides for engaging the internet vea_november 2014Handout slides for engaging the internet vea_november 2014
Handout slides for engaging the internet vea_november 2014
 
Engaging the internet vea november 2014
Engaging the internet vea november 2014Engaging the internet vea november 2014
Engaging the internet vea november 2014
 
Game on macul_final
Game on macul_finalGame on macul_final
Game on macul_final
 
Exds 2001 international projects
Exds 2001 international projectsExds 2001 international projects
Exds 2001 international projects
 
Game on macul_final
Game on macul_finalGame on macul_final
Game on macul_final
 
Week 4 media 2 - ruth f inal
Week 4   media 2 - ruth f inalWeek 4   media 2 - ruth f inal
Week 4 media 2 - ruth f inal
 
Unpacking Steps 3 to5 of The Big Six Research Process
Unpacking Steps 3 to5 of The Big Six Research ProcessUnpacking Steps 3 to5 of The Big Six Research Process
Unpacking Steps 3 to5 of The Big Six Research Process
 
YA Lit Symposium Presentation
YA Lit Symposium PresentationYA Lit Symposium Presentation
YA Lit Symposium Presentation
 
Using blogs as a core part of class activity
Using blogs as a core part of class activityUsing blogs as a core part of class activity
Using blogs as a core part of class activity
 
T4E Tweeting And Posting Without A Computer
T4E Tweeting And Posting Without A ComputerT4E Tweeting And Posting Without A Computer
T4E Tweeting And Posting Without A Computer
 
Opening Keynote for Informa Conference on Social Learning
Opening Keynote for Informa Conference on Social LearningOpening Keynote for Informa Conference on Social Learning
Opening Keynote for Informa Conference on Social Learning
 
NCTE Presentation 2012
NCTE Presentation 2012NCTE Presentation 2012
NCTE Presentation 2012
 
Olympic WebQuest
Olympic WebQuestOlympic WebQuest
Olympic WebQuest
 
Education of the 21st century MLIS student for technical agility.
Education of the 21st century MLIS student for technical agility.Education of the 21st century MLIS student for technical agility.
Education of the 21st century MLIS student for technical agility.
 

Similar to UTC infographics pres

Bagley: Using Infographics in Library Instruction
Bagley: Using Infographics in Library Instruction	Bagley: Using Infographics in Library Instruction
Bagley: Using Infographics in Library Instruction
ALATechSource
 
Organizing information 2
Organizing information 2Organizing information 2
Organizing information 2
Škola Futura
 
Infographics teachingtool
Infographics teachingtoolInfographics teachingtool
Infographics teachingtool
Charmaine Du Plessis
 
Innovative information literacy___learning_the_good_
Innovative information literacy___learning_the_good_Innovative information literacy___learning_the_good_
Innovative information literacy___learning_the_good_
Marianne E. Giltrud, MSLS
 
Innovative information literacy & learning the good
Innovative information literacy & learning the good Innovative information literacy & learning the good
Innovative information literacy & learning the good
Marianne E. Giltrud, MSLS
 
Learning to See, Seeing to Learn: Visual Literacy in Education
Learning to See, Seeing to Learn: Visual Literacy in EducationLearning to See, Seeing to Learn: Visual Literacy in Education
Learning to See, Seeing to Learn: Visual Literacy in Education
Mary Bell
 
LSE SADL workshop 4 - Managing your digital identity and the digital future
LSE SADL workshop 4 - Managing your digital identity and the digital futureLSE SADL workshop 4 - Managing your digital identity and the digital future
LSE SADL workshop 4 - Managing your digital identity and the digital future
LSESADL
 
Technology Enabled Lives: Understanding the Social Media Use of the Under 30s
Technology Enabled Lives: Understanding the Social Media Use of the Under 30sTechnology Enabled Lives: Understanding the Social Media Use of the Under 30s
Technology Enabled Lives: Understanding the Social Media Use of the Under 30s
Melanie Parlette-Stewart
 
Embedding librarianship in learning management systems
Embedding librarianship in learning management systemsEmbedding librarianship in learning management systems
Embedding librarianship in learning management systemsALATechSource
 
Digital Content Curation: iCurate, iShare, iDiscover
Digital Content Curation: iCurate, iShare, iDiscoverDigital Content Curation: iCurate, iShare, iDiscover
Digital Content Curation: iCurate, iShare, iDiscover
Glenda Morris
 
Curating Online Content
Curating Online ContentCurating Online Content
Curating Online Content
Alexis Alexander
 
Alternative careers
Alternative careersAlternative careers
Alternative careers
Bethan Ruddock
 
Hare ichart
Hare ichartHare ichart
Hare ichartTim Hare
 
An Overview of Infographics
An Overview of InfographicsAn Overview of Infographics
Research and Information Literacy RIL ENG 216 A Professor Jennifer Ransom
Research and Information Literacy RIL ENG 216 A Professor Jennifer RansomResearch and Information Literacy RIL ENG 216 A Professor Jennifer Ransom
Research and Information Literacy RIL ENG 216 A Professor Jennifer RansomJennifer L. Ransom
 
Bc week 4 powerpoint
Bc week 4 powerpointBc week 4 powerpoint
Bc week 4 powerpoint
Beth Carey
 
Finding a Format and Objective for Your Infographic
Finding a Format and Objective for Your InfographicFinding a Format and Objective for Your Infographic
Finding a Format and Objective for Your Infographic
Jodie Nicotra
 
Everyday advocacy with web 2.0 tools: Region XI keynote
Everyday advocacy with web 2.0 tools: Region XI keynoteEveryday advocacy with web 2.0 tools: Region XI keynote
Everyday advocacy with web 2.0 tools: Region XI keynotetechnolibrary
 
Presenting information; infographics
Presenting information; infographicsPresenting information; infographics
Presenting information; infographicsmikwaldron
 

Similar to UTC infographics pres (20)

Bagley: Using Infographics in Library Instruction
Bagley: Using Infographics in Library Instruction	Bagley: Using Infographics in Library Instruction
Bagley: Using Infographics in Library Instruction
 
Organizing information 2
Organizing information 2Organizing information 2
Organizing information 2
 
Infographics teachingtool
Infographics teachingtoolInfographics teachingtool
Infographics teachingtool
 
Innovative information literacy___learning_the_good_
Innovative information literacy___learning_the_good_Innovative information literacy___learning_the_good_
Innovative information literacy___learning_the_good_
 
Innovative information literacy & learning the good
Innovative information literacy & learning the good Innovative information literacy & learning the good
Innovative information literacy & learning the good
 
Learning to See, Seeing to Learn: Visual Literacy in Education
Learning to See, Seeing to Learn: Visual Literacy in EducationLearning to See, Seeing to Learn: Visual Literacy in Education
Learning to See, Seeing to Learn: Visual Literacy in Education
 
LSE SADL workshop 4 - Managing your digital identity and the digital future
LSE SADL workshop 4 - Managing your digital identity and the digital futureLSE SADL workshop 4 - Managing your digital identity and the digital future
LSE SADL workshop 4 - Managing your digital identity and the digital future
 
Technology Enabled Lives: Understanding the Social Media Use of the Under 30s
Technology Enabled Lives: Understanding the Social Media Use of the Under 30sTechnology Enabled Lives: Understanding the Social Media Use of the Under 30s
Technology Enabled Lives: Understanding the Social Media Use of the Under 30s
 
What is the Info on Infographics?
What is the Info on Infographics?What is the Info on Infographics?
What is the Info on Infographics?
 
Embedding librarianship in learning management systems
Embedding librarianship in learning management systemsEmbedding librarianship in learning management systems
Embedding librarianship in learning management systems
 
Digital Content Curation: iCurate, iShare, iDiscover
Digital Content Curation: iCurate, iShare, iDiscoverDigital Content Curation: iCurate, iShare, iDiscover
Digital Content Curation: iCurate, iShare, iDiscover
 
Curating Online Content
Curating Online ContentCurating Online Content
Curating Online Content
 
Alternative careers
Alternative careersAlternative careers
Alternative careers
 
Hare ichart
Hare ichartHare ichart
Hare ichart
 
An Overview of Infographics
An Overview of InfographicsAn Overview of Infographics
An Overview of Infographics
 
Research and Information Literacy RIL ENG 216 A Professor Jennifer Ransom
Research and Information Literacy RIL ENG 216 A Professor Jennifer RansomResearch and Information Literacy RIL ENG 216 A Professor Jennifer Ransom
Research and Information Literacy RIL ENG 216 A Professor Jennifer Ransom
 
Bc week 4 powerpoint
Bc week 4 powerpointBc week 4 powerpoint
Bc week 4 powerpoint
 
Finding a Format and Objective for Your Infographic
Finding a Format and Objective for Your InfographicFinding a Format and Objective for Your Infographic
Finding a Format and Objective for Your Infographic
 
Everyday advocacy with web 2.0 tools: Region XI keynote
Everyday advocacy with web 2.0 tools: Region XI keynoteEveryday advocacy with web 2.0 tools: Region XI keynote
Everyday advocacy with web 2.0 tools: Region XI keynote
 
Presenting information; infographics
Presenting information; infographicsPresenting information; infographics
Presenting information; infographics
 

Recently uploaded

The Art Pastor's Guide to Sabbath | Steve Thomason
The Art Pastor's Guide to Sabbath | Steve ThomasonThe Art Pastor's Guide to Sabbath | Steve Thomason
The Art Pastor's Guide to Sabbath | Steve Thomason
Steve Thomason
 
Additional Benefits for Employee Website.pdf
Additional Benefits for Employee Website.pdfAdditional Benefits for Employee Website.pdf
Additional Benefits for Employee Website.pdf
joachimlavalley1
 
CLASS 11 CBSE B.St Project AIDS TO TRADE - INSURANCE
CLASS 11 CBSE B.St Project AIDS TO TRADE - INSURANCECLASS 11 CBSE B.St Project AIDS TO TRADE - INSURANCE
CLASS 11 CBSE B.St Project AIDS TO TRADE - INSURANCE
BhavyaRajput3
 
Template Jadual Bertugas Kelas (Boleh Edit)
Template Jadual Bertugas Kelas (Boleh Edit)Template Jadual Bertugas Kelas (Boleh Edit)
Template Jadual Bertugas Kelas (Boleh Edit)
rosedainty
 
Synthetic Fiber Construction in lab .pptx
Synthetic Fiber Construction in lab .pptxSynthetic Fiber Construction in lab .pptx
Synthetic Fiber Construction in lab .pptx
Pavel ( NSTU)
 
aaaaaaaaaaaaaaaaaaaaaaaaaaaaaaaaaaaaaaaaaaaaaaaaaaaaaaa
aaaaaaaaaaaaaaaaaaaaaaaaaaaaaaaaaaaaaaaaaaaaaaaaaaaaaaaaaaaaaaaaaaaaaaaaaaaaaaaaaaaaaaaaaaaaaaaaaaaaaaaaaaaaaa
aaaaaaaaaaaaaaaaaaaaaaaaaaaaaaaaaaaaaaaaaaaaaaaaaaaaaaa
siemaillard
 
How to Make a Field invisible in Odoo 17
How to Make a Field invisible in Odoo 17How to Make a Field invisible in Odoo 17
How to Make a Field invisible in Odoo 17
Celine George
 
Model Attribute Check Company Auto Property
Model Attribute  Check Company Auto PropertyModel Attribute  Check Company Auto Property
Model Attribute Check Company Auto Property
Celine George
 
Supporting (UKRI) OA monographs at Salford.pptx
Supporting (UKRI) OA monographs at Salford.pptxSupporting (UKRI) OA monographs at Salford.pptx
Supporting (UKRI) OA monographs at Salford.pptx
Jisc
 
Phrasal Verbs.XXXXXXXXXXXXXXXXXXXXXXXXXX
Phrasal Verbs.XXXXXXXXXXXXXXXXXXXXXXXXXXPhrasal Verbs.XXXXXXXXXXXXXXXXXXXXXXXXXX
Phrasal Verbs.XXXXXXXXXXXXXXXXXXXXXXXXXX
MIRIAMSALINAS13
 
Welcome to TechSoup New Member Orientation and Q&A (May 2024).pdf
Welcome to TechSoup   New Member Orientation and Q&A (May 2024).pdfWelcome to TechSoup   New Member Orientation and Q&A (May 2024).pdf
Welcome to TechSoup New Member Orientation and Q&A (May 2024).pdf
TechSoup
 
The geography of Taylor Swift - some ideas
The geography of Taylor Swift - some ideasThe geography of Taylor Swift - some ideas
The geography of Taylor Swift - some ideas
GeoBlogs
 
Basic phrases for greeting and assisting costumers
Basic phrases for greeting and assisting costumersBasic phrases for greeting and assisting costumers
Basic phrases for greeting and assisting costumers
PedroFerreira53928
 
TESDA TM1 REVIEWER FOR NATIONAL ASSESSMENT WRITTEN AND ORAL QUESTIONS WITH A...
TESDA TM1 REVIEWER  FOR NATIONAL ASSESSMENT WRITTEN AND ORAL QUESTIONS WITH A...TESDA TM1 REVIEWER  FOR NATIONAL ASSESSMENT WRITTEN AND ORAL QUESTIONS WITH A...
TESDA TM1 REVIEWER FOR NATIONAL ASSESSMENT WRITTEN AND ORAL QUESTIONS WITH A...
EugeneSaldivar
 
Digital Tools and AI for Teaching Learning and Research
Digital Tools and AI for Teaching Learning and ResearchDigital Tools and AI for Teaching Learning and Research
Digital Tools and AI for Teaching Learning and Research
Vikramjit Singh
 
special B.ed 2nd year old paper_20240531.pdf
special B.ed 2nd year old paper_20240531.pdfspecial B.ed 2nd year old paper_20240531.pdf
special B.ed 2nd year old paper_20240531.pdf
Special education needs
 
Overview on Edible Vaccine: Pros & Cons with Mechanism
Overview on Edible Vaccine: Pros & Cons with MechanismOverview on Edible Vaccine: Pros & Cons with Mechanism
Overview on Edible Vaccine: Pros & Cons with Mechanism
DeeptiGupta154
 
Chapter 3 - Islamic Banking Products and Services.pptx
Chapter 3 - Islamic Banking Products and Services.pptxChapter 3 - Islamic Banking Products and Services.pptx
Chapter 3 - Islamic Banking Products and Services.pptx
Mohd Adib Abd Muin, Senior Lecturer at Universiti Utara Malaysia
 
Fish and Chips - have they had their chips
Fish and Chips - have they had their chipsFish and Chips - have they had their chips
Fish and Chips - have they had their chips
GeoBlogs
 
Introduction to Quality Improvement Essentials
Introduction to Quality Improvement EssentialsIntroduction to Quality Improvement Essentials
Introduction to Quality Improvement Essentials
Excellence Foundation for South Sudan
 

Recently uploaded (20)

The Art Pastor's Guide to Sabbath | Steve Thomason
The Art Pastor's Guide to Sabbath | Steve ThomasonThe Art Pastor's Guide to Sabbath | Steve Thomason
The Art Pastor's Guide to Sabbath | Steve Thomason
 
Additional Benefits for Employee Website.pdf
Additional Benefits for Employee Website.pdfAdditional Benefits for Employee Website.pdf
Additional Benefits for Employee Website.pdf
 
CLASS 11 CBSE B.St Project AIDS TO TRADE - INSURANCE
CLASS 11 CBSE B.St Project AIDS TO TRADE - INSURANCECLASS 11 CBSE B.St Project AIDS TO TRADE - INSURANCE
CLASS 11 CBSE B.St Project AIDS TO TRADE - INSURANCE
 
Template Jadual Bertugas Kelas (Boleh Edit)
Template Jadual Bertugas Kelas (Boleh Edit)Template Jadual Bertugas Kelas (Boleh Edit)
Template Jadual Bertugas Kelas (Boleh Edit)
 
Synthetic Fiber Construction in lab .pptx
Synthetic Fiber Construction in lab .pptxSynthetic Fiber Construction in lab .pptx
Synthetic Fiber Construction in lab .pptx
 
aaaaaaaaaaaaaaaaaaaaaaaaaaaaaaaaaaaaaaaaaaaaaaaaaaaaaaa
aaaaaaaaaaaaaaaaaaaaaaaaaaaaaaaaaaaaaaaaaaaaaaaaaaaaaaaaaaaaaaaaaaaaaaaaaaaaaaaaaaaaaaaaaaaaaaaaaaaaaaaaaaaaaa
aaaaaaaaaaaaaaaaaaaaaaaaaaaaaaaaaaaaaaaaaaaaaaaaaaaaaaa
 
How to Make a Field invisible in Odoo 17
How to Make a Field invisible in Odoo 17How to Make a Field invisible in Odoo 17
How to Make a Field invisible in Odoo 17
 
Model Attribute Check Company Auto Property
Model Attribute  Check Company Auto PropertyModel Attribute  Check Company Auto Property
Model Attribute Check Company Auto Property
 
Supporting (UKRI) OA monographs at Salford.pptx
Supporting (UKRI) OA monographs at Salford.pptxSupporting (UKRI) OA monographs at Salford.pptx
Supporting (UKRI) OA monographs at Salford.pptx
 
Phrasal Verbs.XXXXXXXXXXXXXXXXXXXXXXXXXX
Phrasal Verbs.XXXXXXXXXXXXXXXXXXXXXXXXXXPhrasal Verbs.XXXXXXXXXXXXXXXXXXXXXXXXXX
Phrasal Verbs.XXXXXXXXXXXXXXXXXXXXXXXXXX
 
Welcome to TechSoup New Member Orientation and Q&A (May 2024).pdf
Welcome to TechSoup   New Member Orientation and Q&A (May 2024).pdfWelcome to TechSoup   New Member Orientation and Q&A (May 2024).pdf
Welcome to TechSoup New Member Orientation and Q&A (May 2024).pdf
 
The geography of Taylor Swift - some ideas
The geography of Taylor Swift - some ideasThe geography of Taylor Swift - some ideas
The geography of Taylor Swift - some ideas
 
Basic phrases for greeting and assisting costumers
Basic phrases for greeting and assisting costumersBasic phrases for greeting and assisting costumers
Basic phrases for greeting and assisting costumers
 
TESDA TM1 REVIEWER FOR NATIONAL ASSESSMENT WRITTEN AND ORAL QUESTIONS WITH A...
TESDA TM1 REVIEWER  FOR NATIONAL ASSESSMENT WRITTEN AND ORAL QUESTIONS WITH A...TESDA TM1 REVIEWER  FOR NATIONAL ASSESSMENT WRITTEN AND ORAL QUESTIONS WITH A...
TESDA TM1 REVIEWER FOR NATIONAL ASSESSMENT WRITTEN AND ORAL QUESTIONS WITH A...
 
Digital Tools and AI for Teaching Learning and Research
Digital Tools and AI for Teaching Learning and ResearchDigital Tools and AI for Teaching Learning and Research
Digital Tools and AI for Teaching Learning and Research
 
special B.ed 2nd year old paper_20240531.pdf
special B.ed 2nd year old paper_20240531.pdfspecial B.ed 2nd year old paper_20240531.pdf
special B.ed 2nd year old paper_20240531.pdf
 
Overview on Edible Vaccine: Pros & Cons with Mechanism
Overview on Edible Vaccine: Pros & Cons with MechanismOverview on Edible Vaccine: Pros & Cons with Mechanism
Overview on Edible Vaccine: Pros & Cons with Mechanism
 
Chapter 3 - Islamic Banking Products and Services.pptx
Chapter 3 - Islamic Banking Products and Services.pptxChapter 3 - Islamic Banking Products and Services.pptx
Chapter 3 - Islamic Banking Products and Services.pptx
 
Fish and Chips - have they had their chips
Fish and Chips - have they had their chipsFish and Chips - have they had their chips
Fish and Chips - have they had their chips
 
Introduction to Quality Improvement Essentials
Introduction to Quality Improvement EssentialsIntroduction to Quality Improvement Essentials
Introduction to Quality Improvement Essentials
 

UTC infographics pres

  • 1. Infographics: show me the data Tamara cox Palmetto middle
  • 2. Definition • Infographics are visual representations of information, data or knowledge • Use when you need to explain complex information quickly
  • 3.
  • 4.
  • 6.
  • 7. Why should we use them? • Approximately 65% of people are visual learners • Information literacy standards are included in ISTE NETS and Common Core: CCSS.ELA-Literacy.RI.6.7 Integrate information presented in different media or formats (e.g., visually, quantitatively) as well as in words to develop a coherent understanding of a topic or issue. • They require a higher level of thinking (analyze and create) • They inject rigor into your classroom • They are fun!!
  • 8. Where do you find them? Links: http://dailyinfographic.com/ http://www.coolinfographics.com/ http://pinterest.com
  • 9. How do you use them with students? • Share one for a warm up to introduce topic • Have students search for infographics on a topic and share with the class • Compare two infographics on the same topic • Ask students to fact check infographics • Have students create math problems using data from an infographic • Require students to locate and explain data from an infographic • Have students create their own!
  • 10. Infographic Safari Mrs. Cox, Palmetto Middle Librarian, 2013
  • 11. How can students create them?
  • 12. Apps to Create Infographics Infographics by Column Five Grafio Mindmeister Maptini Photo Stats http://www.educatorstechnology.com/2013/04/5-handy-ipad-apps-to-create- infographics.html
  • 14. Infographic Teaching Resources • NY Times Learning Blog Posts: http://learning.blogs.nytimes.com/2010/08/23/teachin g-with-infographics-places-to-start/ • Kathy Schrock’s Guide: http://www.schrockguide.net/infographics-as-an- assessment.html • Free Tech 4 Teachers posts: http://www.freetech4teachers.com/2012/12/500-cool- infographics.html • Scribd Guide: http://www.educatorstechnology.com/2013/03/excelle nt-tips-and-tools-to-create.html
  • 15. Steps To Create an Infographic 1. Become familiar with the ways to visualize data 2. Research and collect data and citations 3. Hand sketch a draft 4. Gather images and record citations 5. Pick colors and fonts based on message 6. Create infographic with citations
  • 16. Step 1: Explore types of infographics
  • 17. Step 2: Research and collect data • Books • DISCUS Articles • Magazines • Newspapers • Web sites • Use citationmachine.net to create MLA citations.
  • 18. Step 3: Hand sketch a draft http://www.123rf.com/photo_11073871_hand-drawn-infographics.html
  • 19. Step 4: Gather images and cite • Pics 4 Learning: http://www.pics4learning.com/ • Clip Art ETC: http://etc.usf.edu/clipart/ • Edupics: http://www.edupics.com/ • Photl: http://www.photl.com/ • PicFindr: http://www.picfindr.com/
  • 20. Step 5: Pick colors and fonts
  • 21. Color Schemes That Work • Yellow on blue blackground
  • 22. Color Schemes That Work • White on black background
  • 23. Color Schemes That Work • Black on yellow background
  • 24. Colors to Avoid • Red on green is hard for those with colorblindness
  • 25. Colors to Avoid • If you want to use red, go for burgundy instead • Red causes an agitated emotional response
  • 26. Colors Evoke Emotion • Green makes the viewer feel involved with topic • Blue indicates a calm message • Yellow is for hope and cheerfulness • Purple is childlike, save for “light” topics • Black indicates power
  • 27. Fonts • Type can express mood and emotion • Do not use more than three different fonts • Bookman, Garamond, and Times New Roman are good for large blocks of text • Arial and Comic Sans are good for headlines • Make limited use of CAPITAL LETTERS
  • 28. Step 6: Create infographic and cite sources • Power Point will be used to create the infographic • Rubric Overview • Don’t forget citations
  • 29. Power Point Tricks to Know • Bring to Front, Send to Back • Set color transparent • Change slide orientation • Create graphs in Excel and Paste in • Save as JPEG
  • 30. Sources Schrock, Kathy. “Power Point Etiquette” Slideshare Presentation, http://www.slideshare.net/kathyschrock/powerpoint-for-administrators Links to infographics used: http://www.123rf.com/photo_11073871_hand-drawn-infographics.html http://idea4invention.com/articles/electric-car-inventions-timeline-infographic http://www.mobypicture.com/user/JeeeM/view/7788306 http://mashable.com/2012/07/18/lego-infographic/ http://www.markedlines.com/a-roundup-of-25-jaw-dropping-infographics/ http://www.clicksoftware.com/national-critical-planning-infrastructure-management- during-summer.htm http://www.coolinfographics.com/blog/2013/3/19/ink-costs-more-than-human- blood.html http://www.coolinfographics.com/blog/2013/3/22/460-million-connected-internet- devices.html http://visual.ly/anatomy-teacher

Editor's Notes

  1. Describe lesson
  2. Draw it by hand
  3. NY Times has a series with tips on how to make them, use them with classes, links to examples, a post for each subject with ideasKathy Schrock’s guide has video instructions, rubrics, links, online tutorials and moreFree Tech has reviews of sites, links to sites to create your own, links to cool infographics