This document discusses the measurement of the top quark pair production cross section in the muon+jets channel at the LHC using machine learning techniques. It details the theoretical background, experimental setup, data analysis methods, and challenges in simulating particle interactions. The findings aim to provide a precise estimate of the top quark production cross section under specified conditions, emphasizing the importance of various systematic uncertainties.


![Monte Carlo (MC) simulations
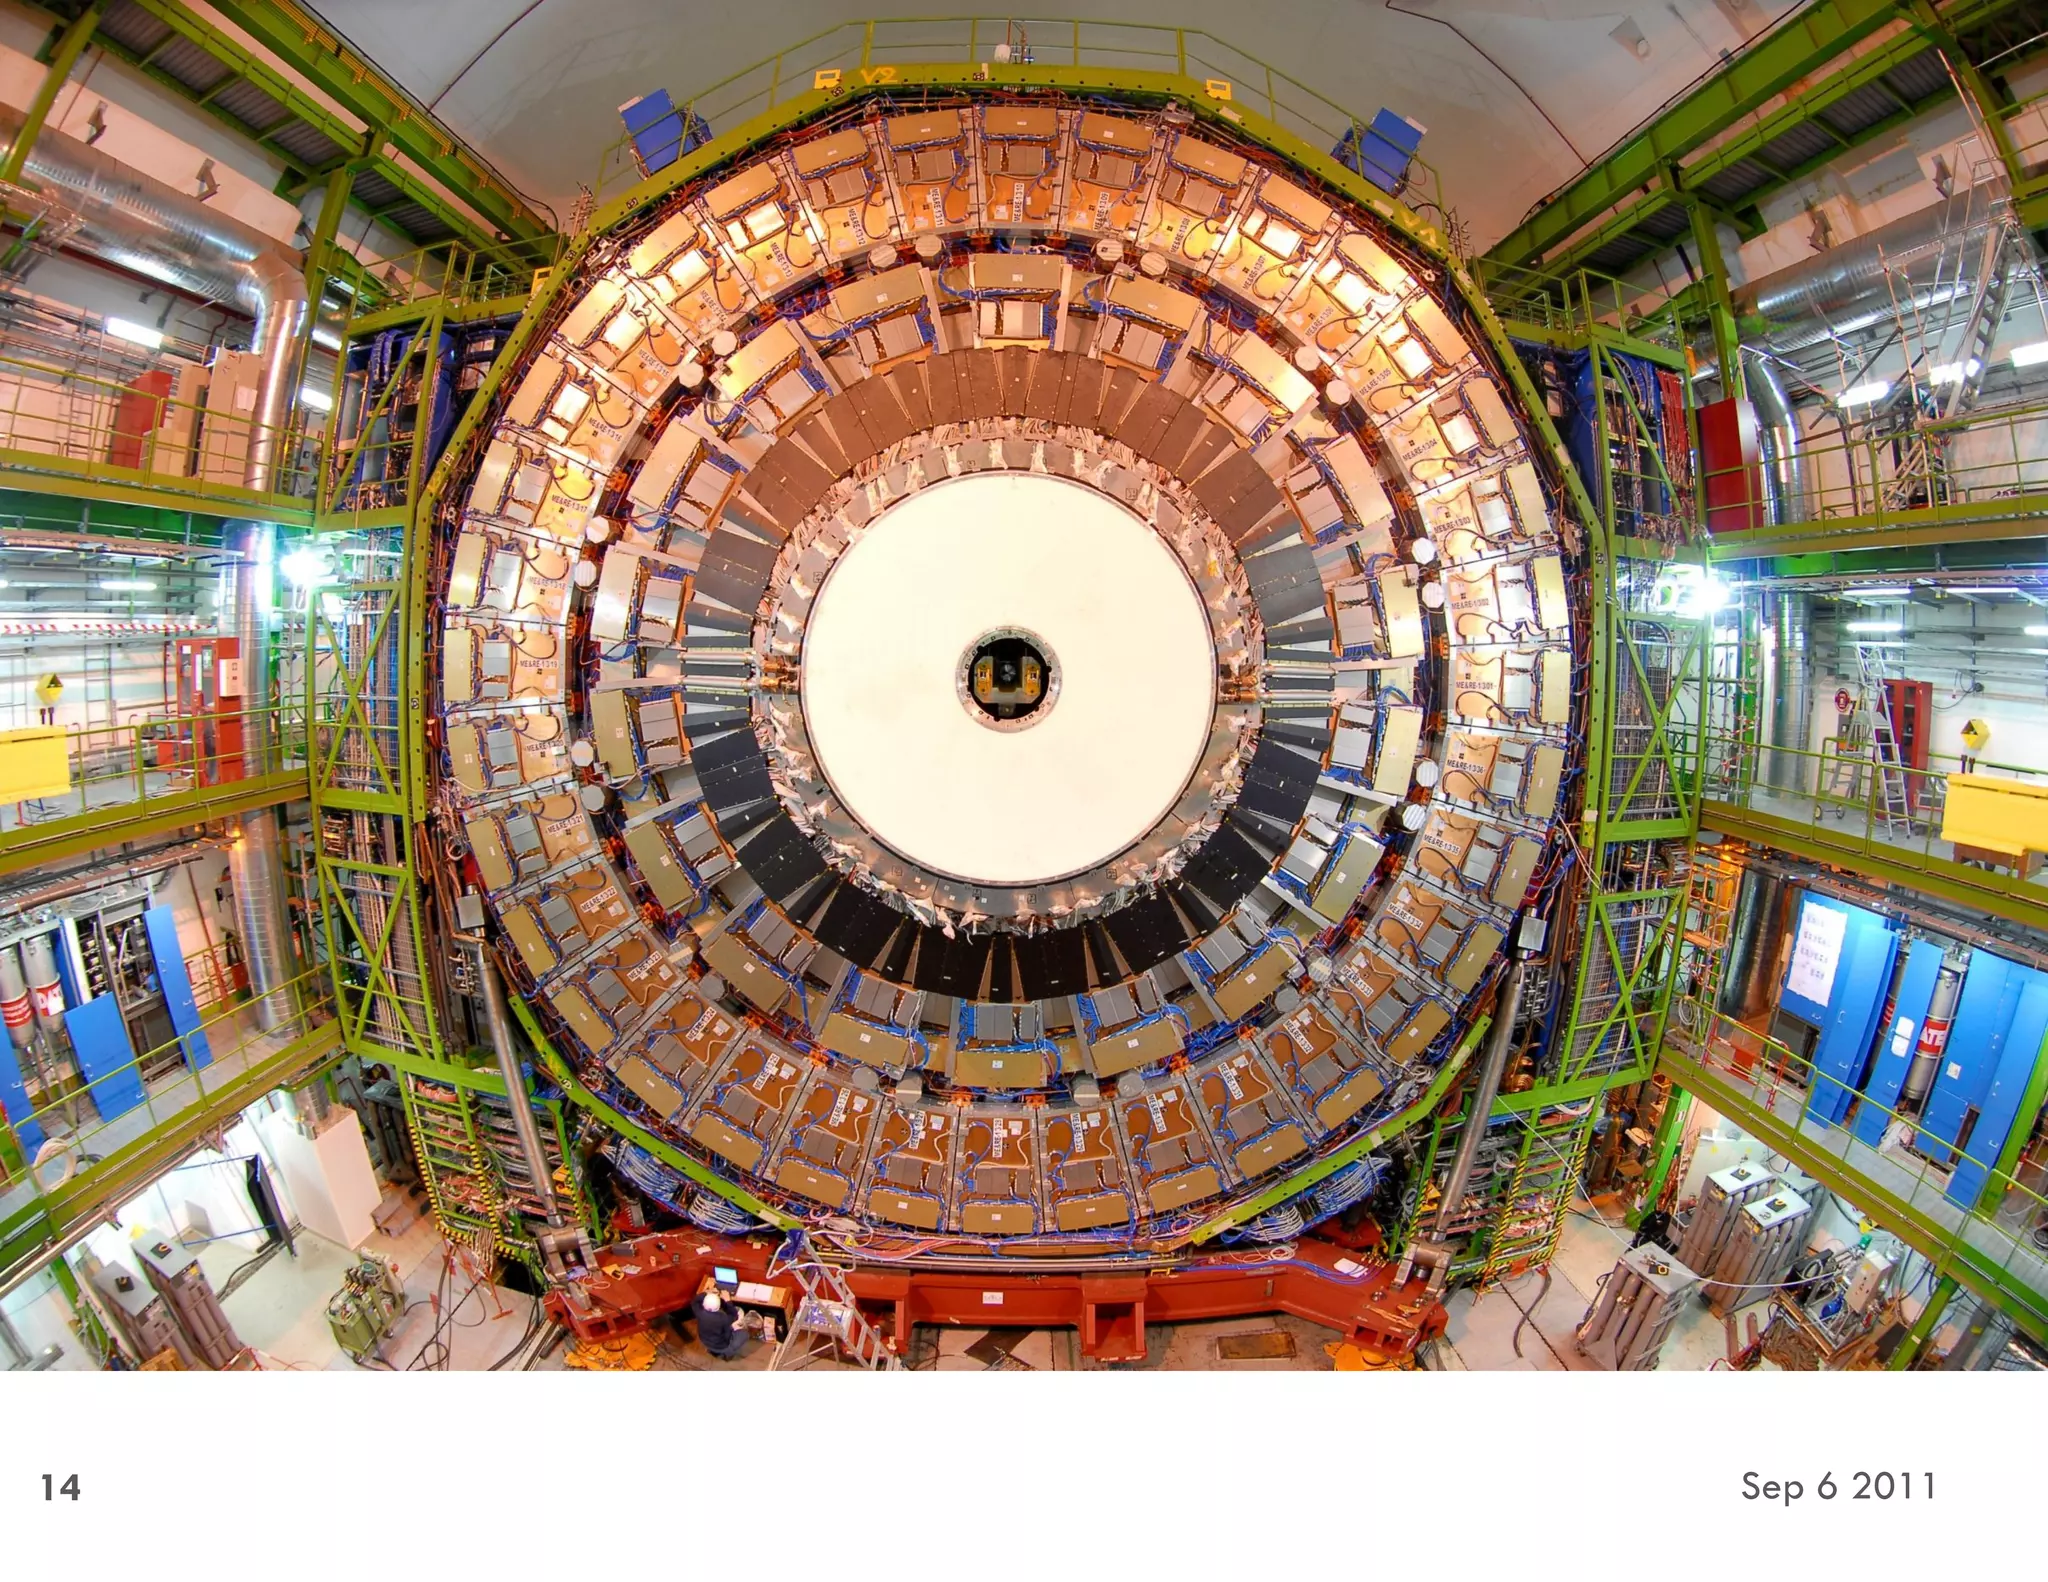
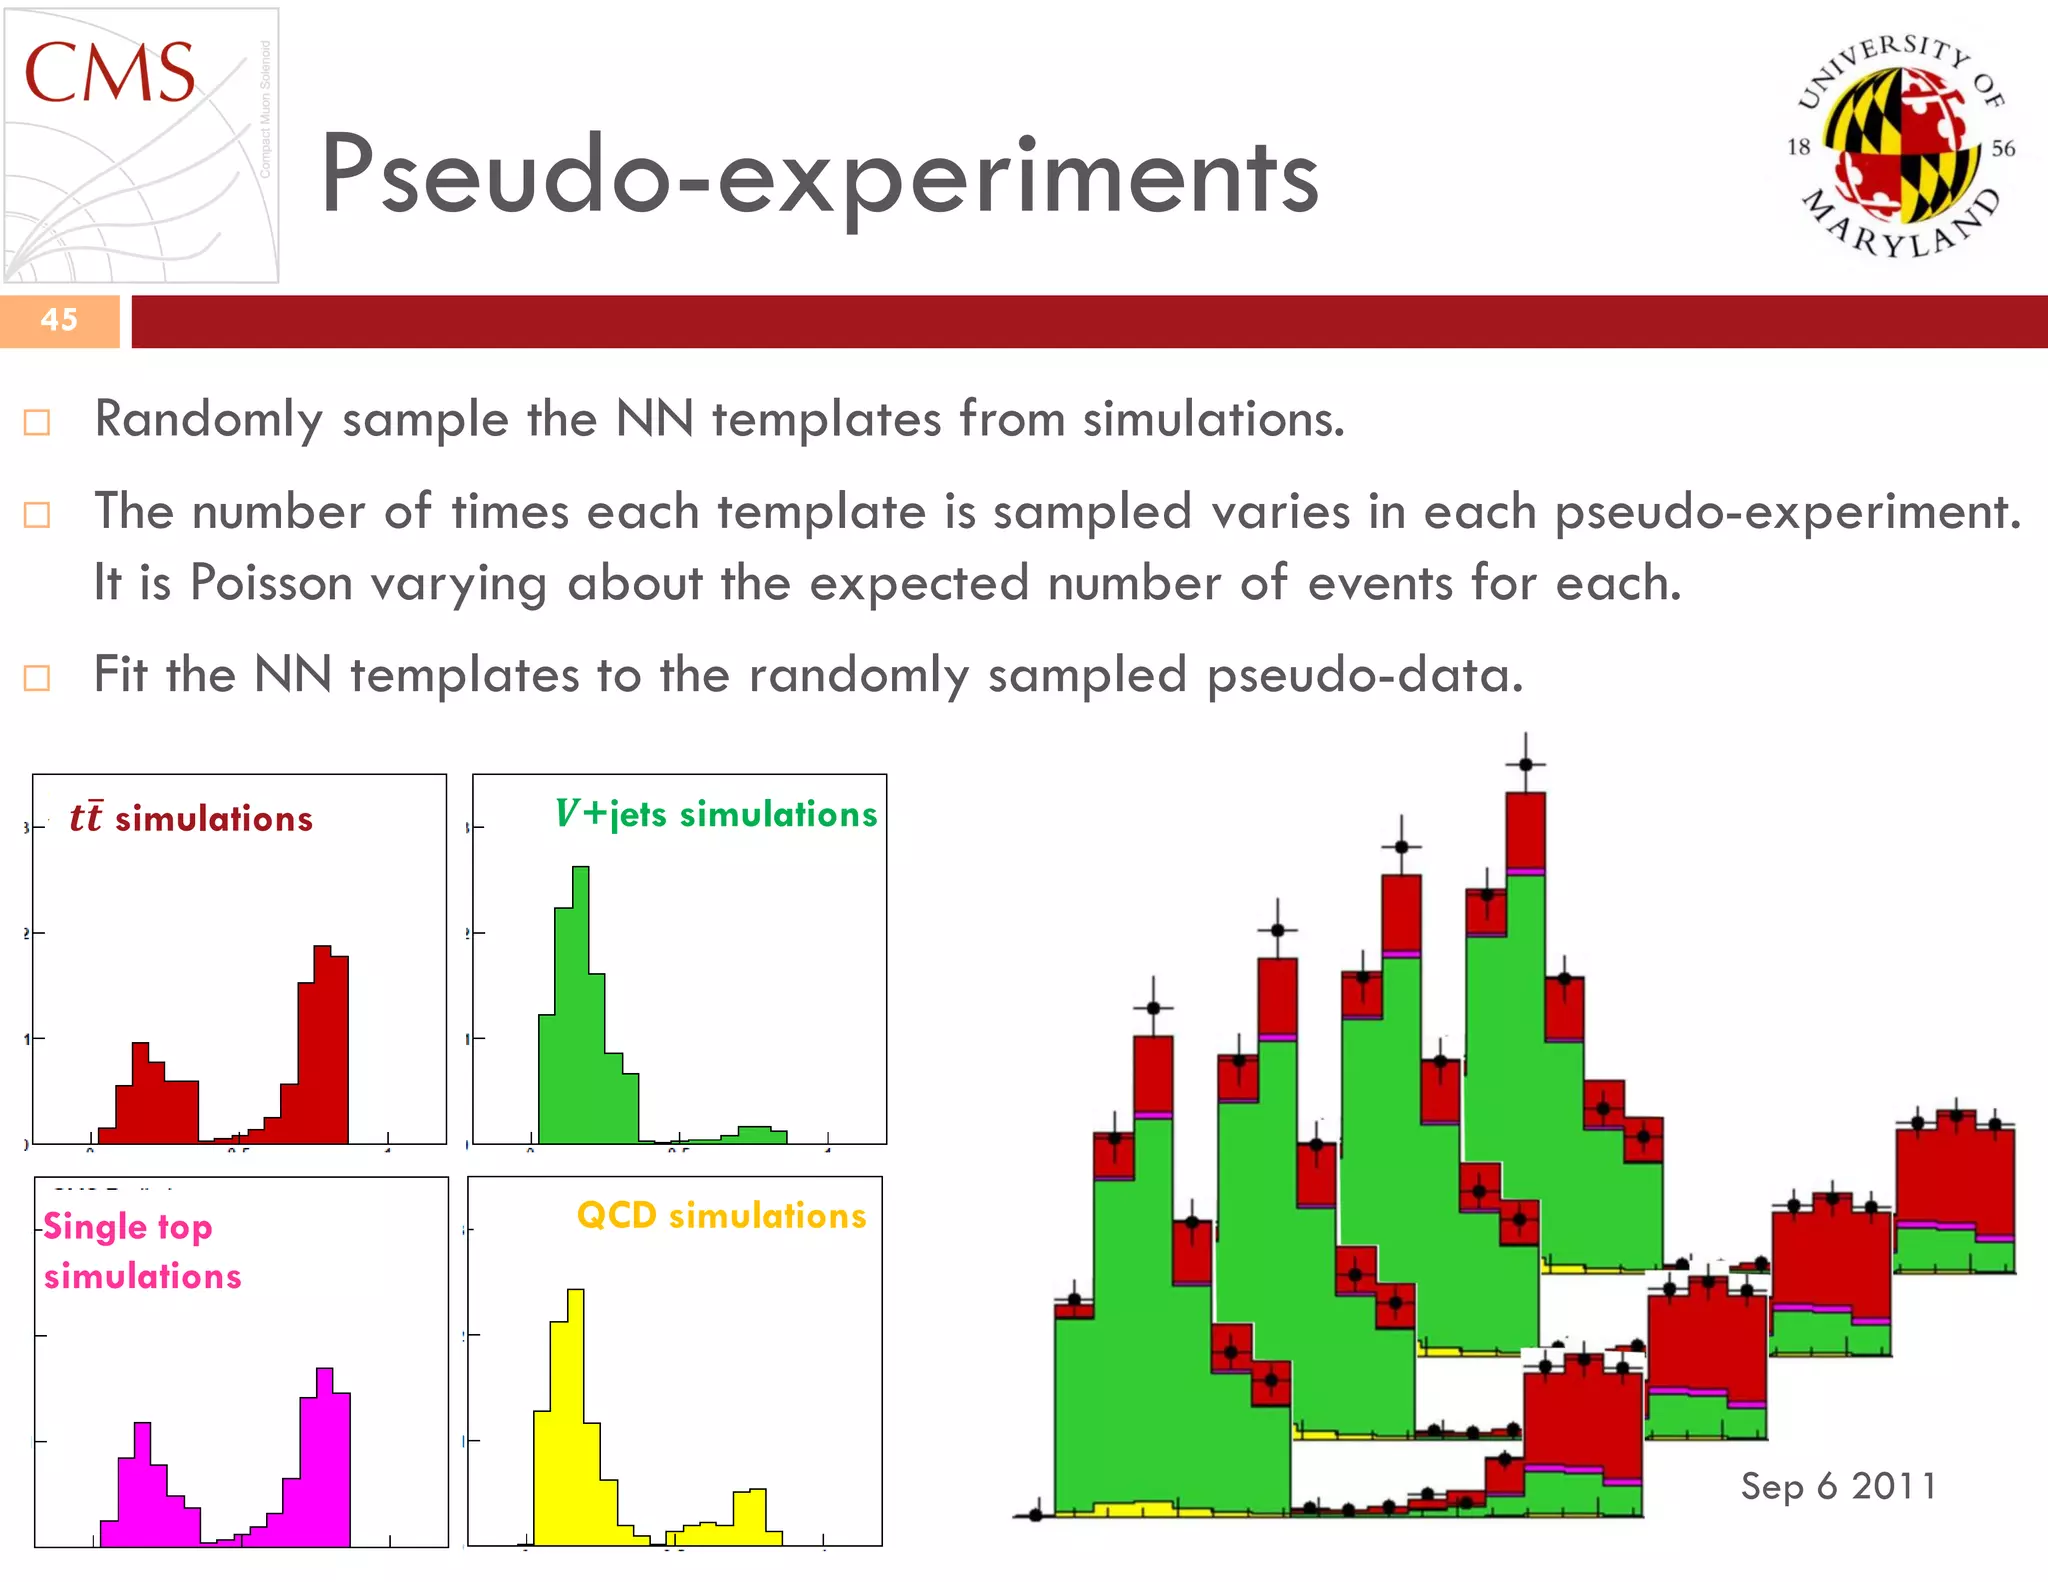
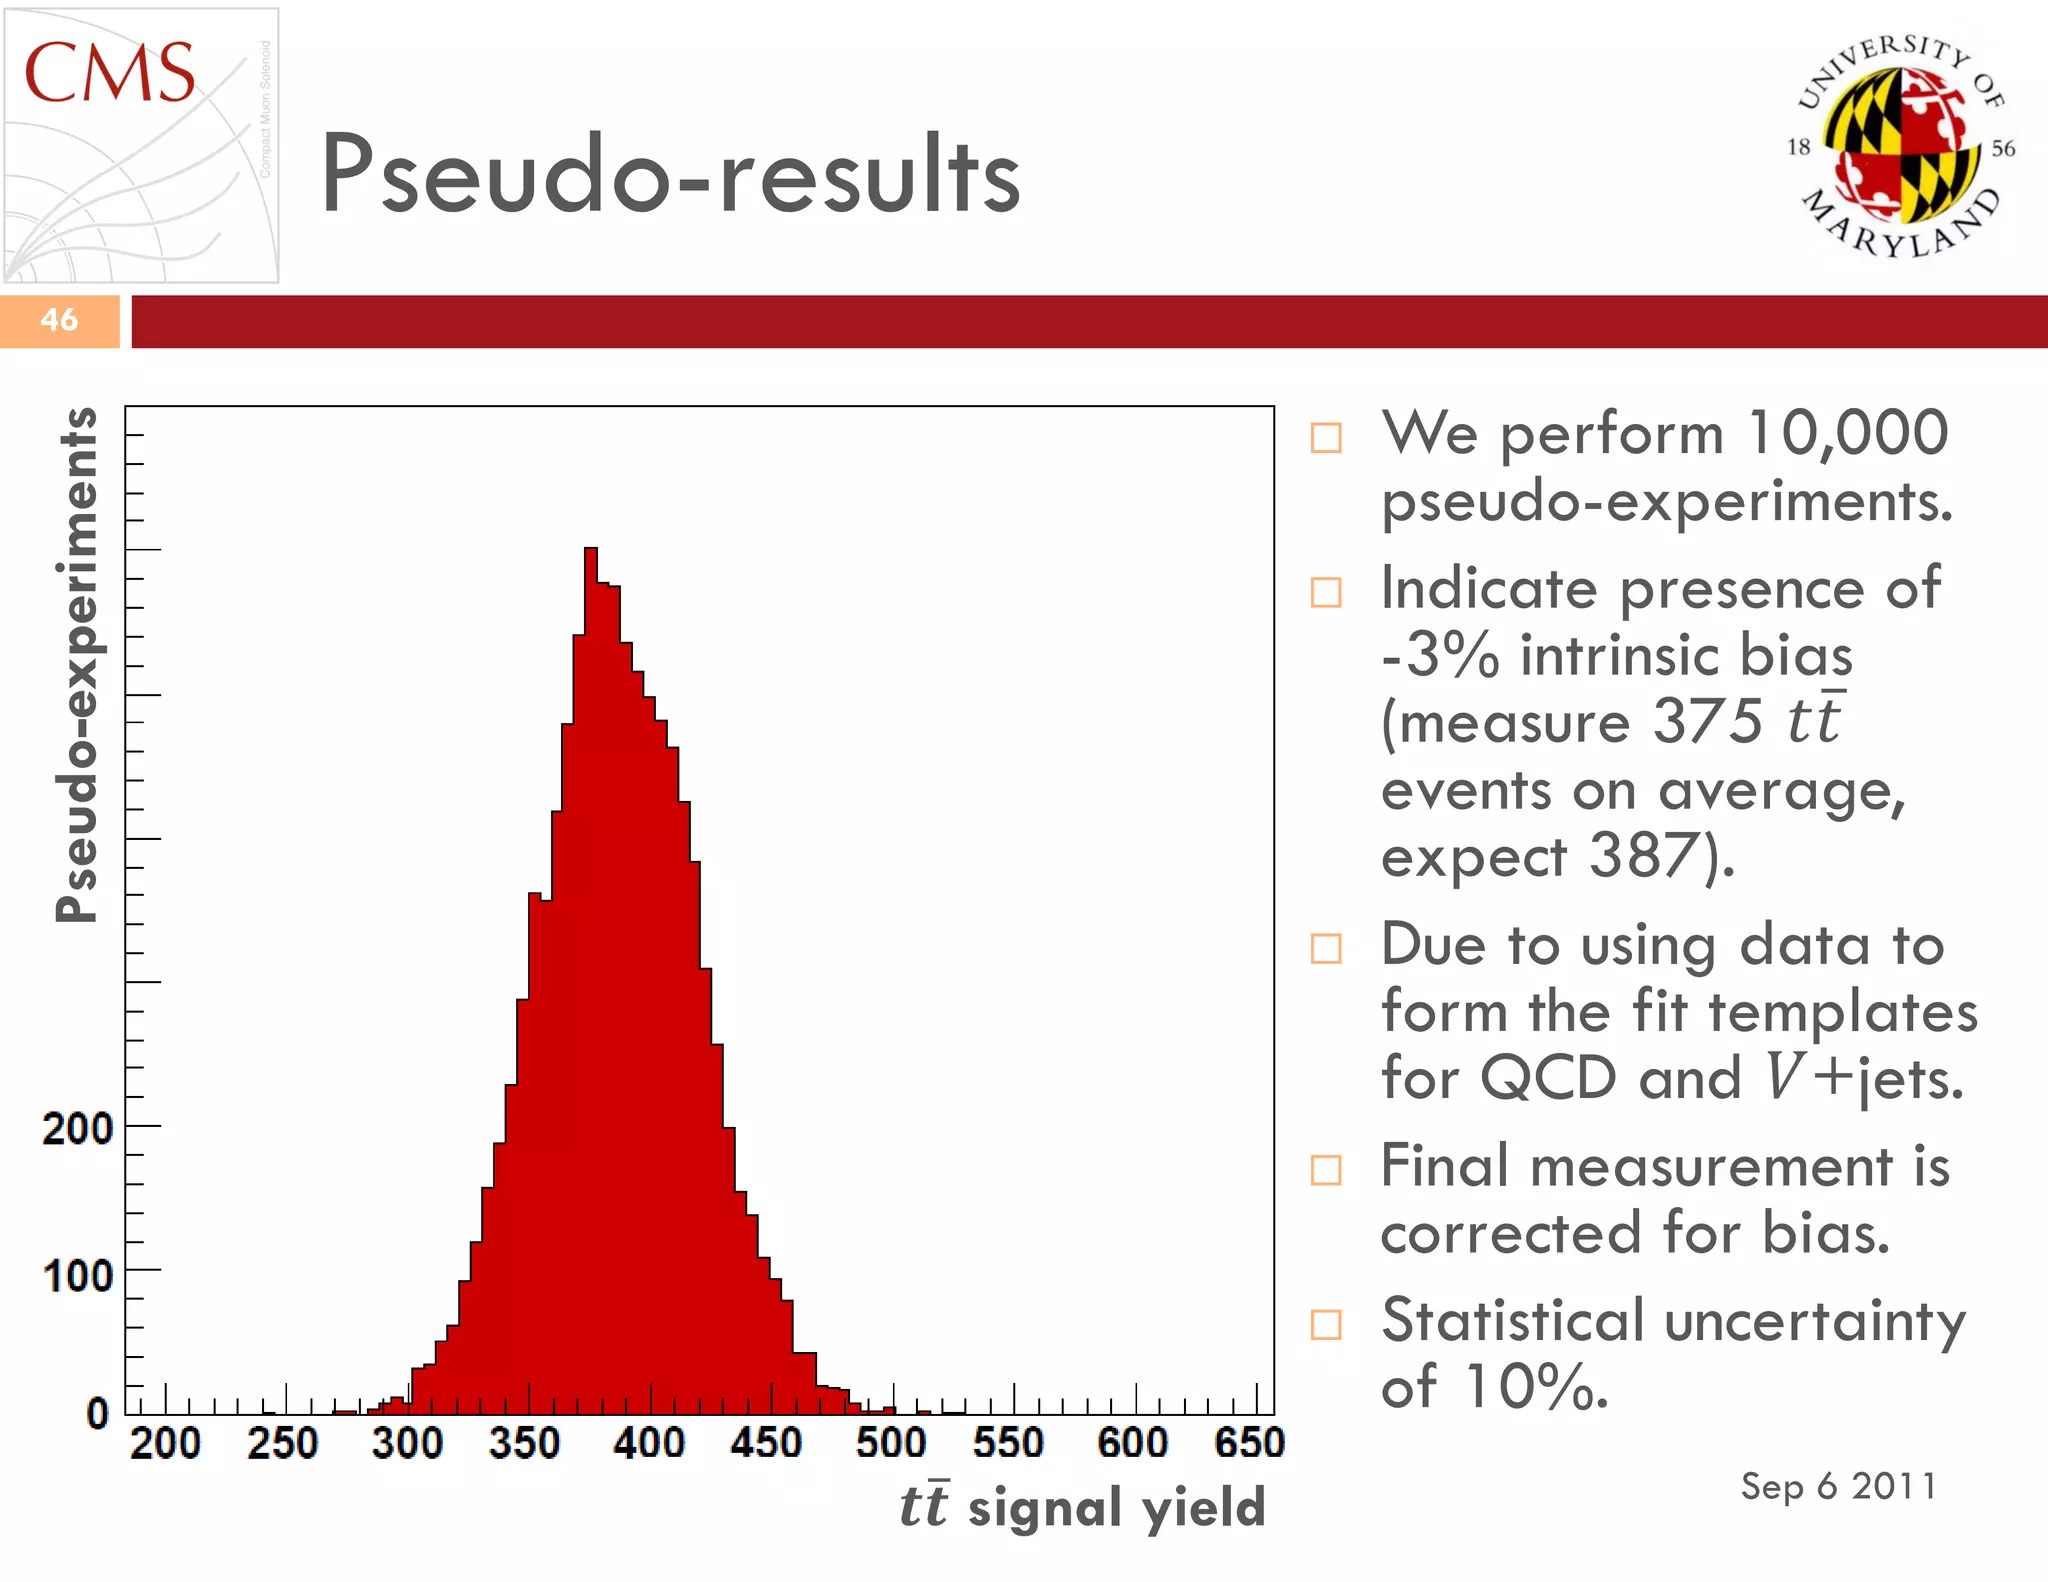
Sep 6 2011
60
Integrate a function from
𝑥1 to 𝑥2.
The analytical form is unknown,
but the value can be calculated.
The minimum, 𝑦1, and maximum,
𝑦2, values of the function in the
range [𝑥1, 𝑥2] are known or can
be approximated.
Throw random points (𝑥, 𝑦) in
the region (𝑥1, 𝑦1) → (𝑥2, 𝑦2).
Calculate the fraction, 𝐹, with
𝑦 < 𝑓(𝑥).
The integral is then
𝐹(𝑥2 − 𝑥1)(𝑦2 − 𝑦1). 𝑥1 𝑥2
𝑦1
𝑦2](https://image.slidesharecdn.com/20110906-kirn-dissertationdefense-181114145033/75/Using-Machine-Learning-to-Measure-the-Cross-Section-of-Top-Quark-Pairs-in-the-Muon-Jets-Channel-at-the-Compact-Muon-Solenoid-60-2048.jpg)