This document discusses population growth trends worldwide and in India, with a focus on urbanization. Some key points:
1) The world population reached 7 billion in 2010 and is projected to reach 7.9-10.9 billion by 2050, with China and India each having over 1 billion people.
2) India's population reached 1 billion in 2000, 1.2 billion in 2011, and is projected to reach 1.8 billion by 2050, with 50% living in urban areas.
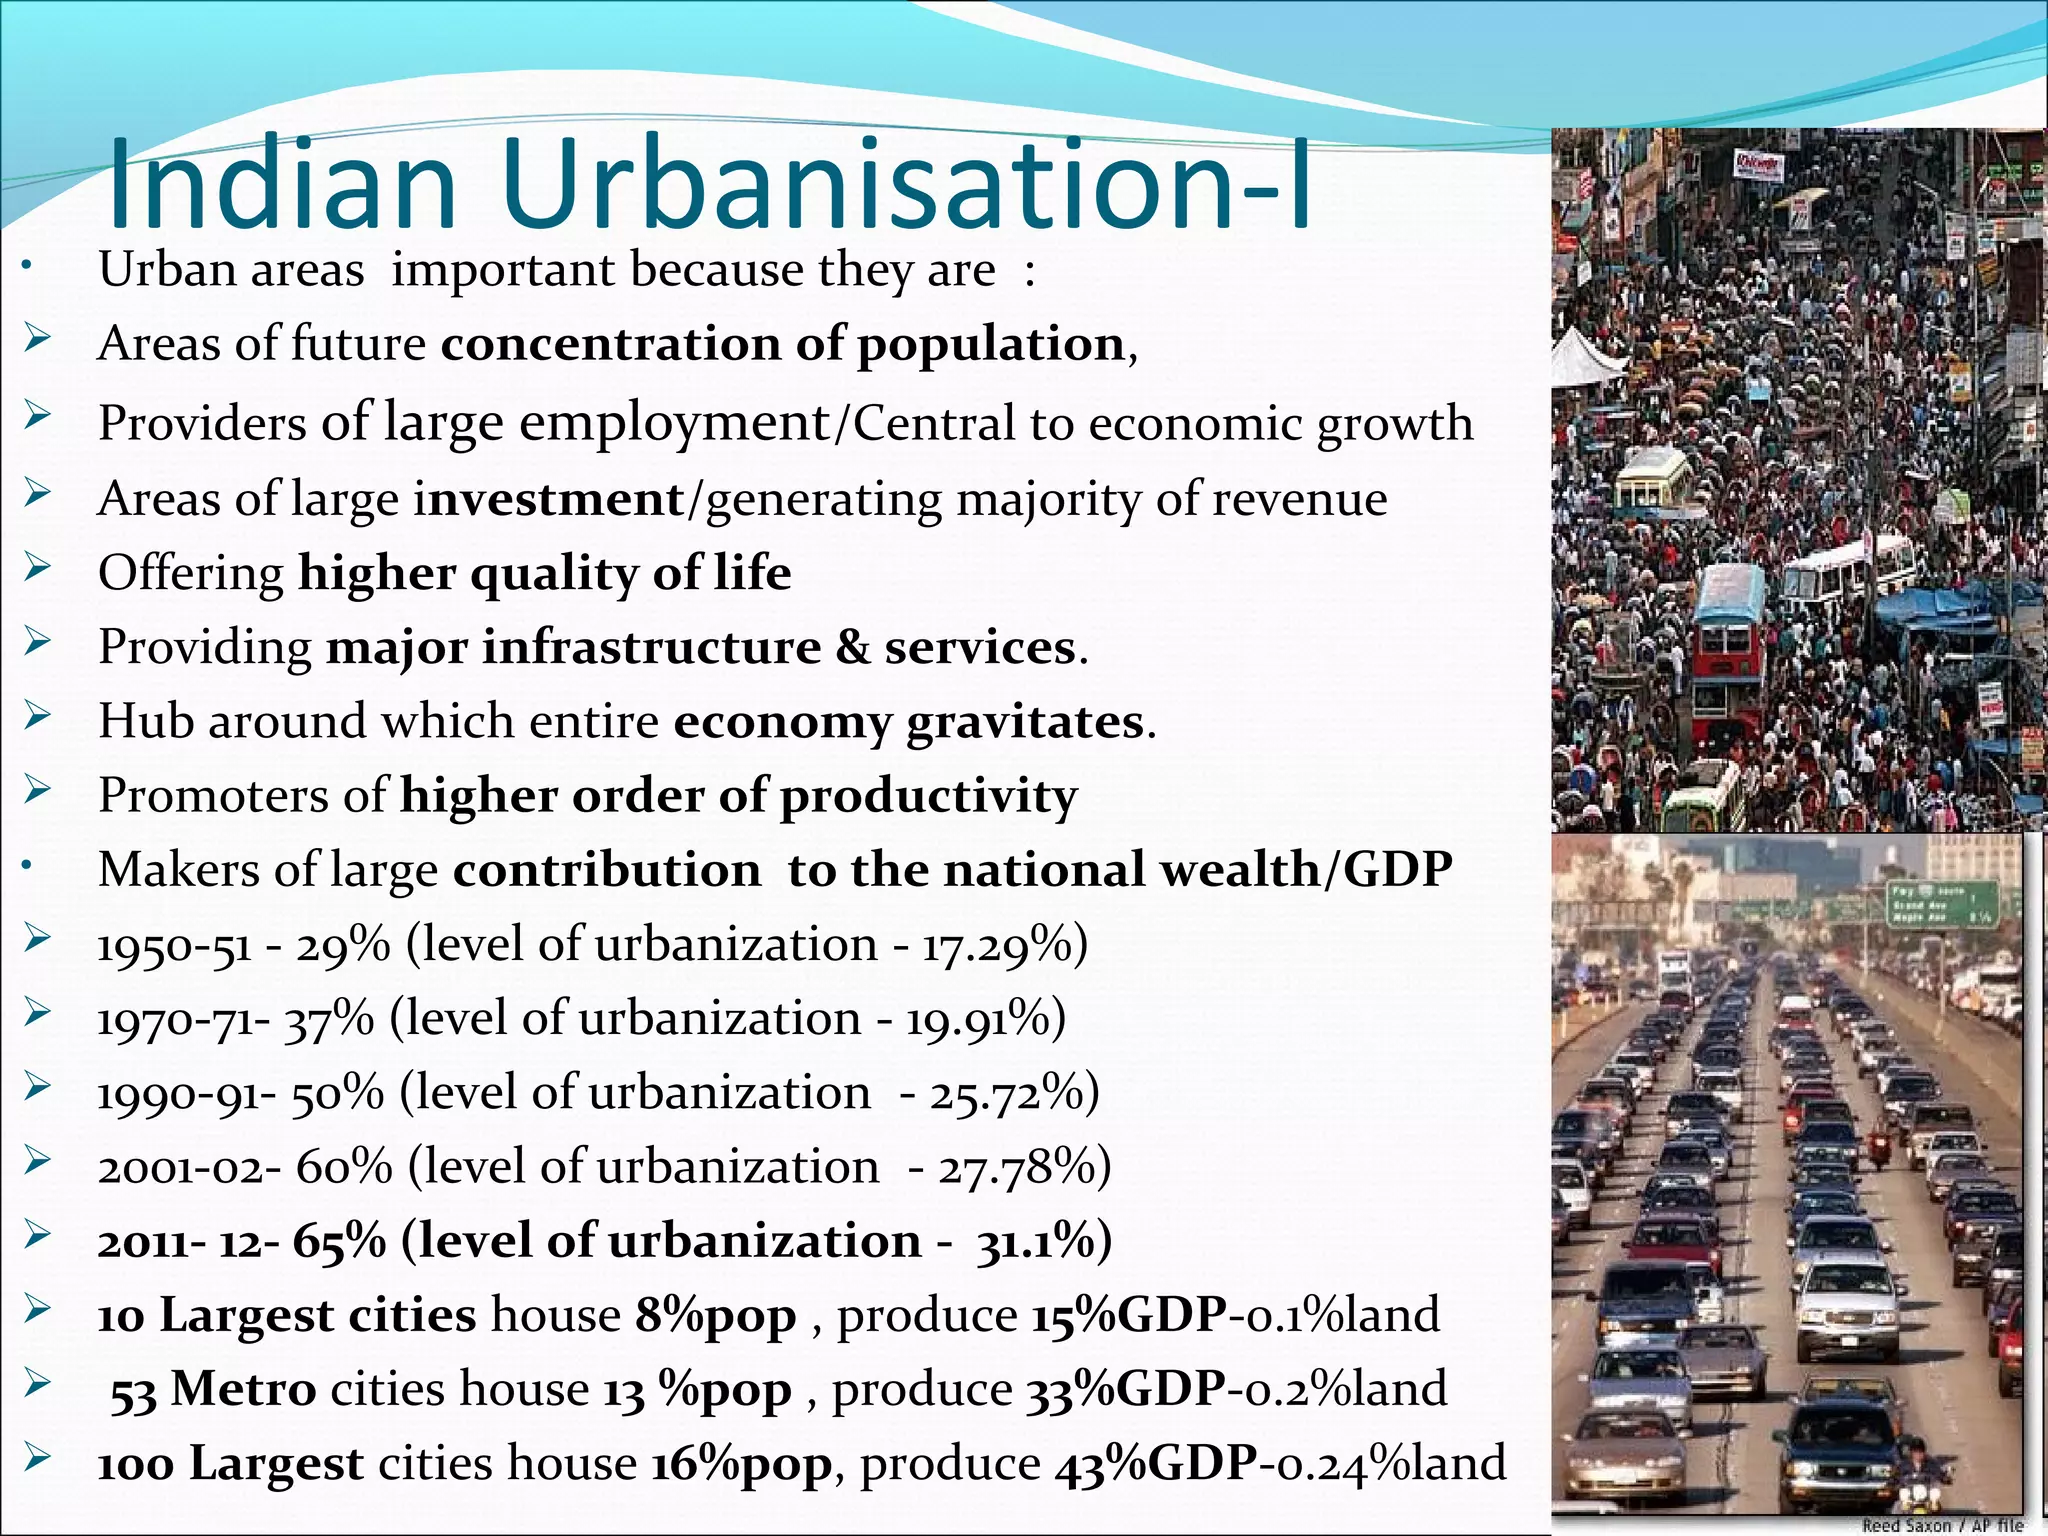
3) Urbanization is seen as both a driver and consequence of economic development. As urban areas generate wealth and tax revenue, their effective management is critical for India's continued growth.
4) By