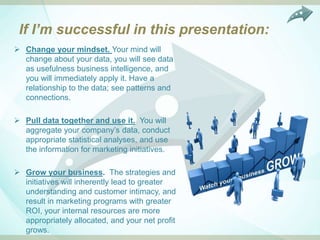
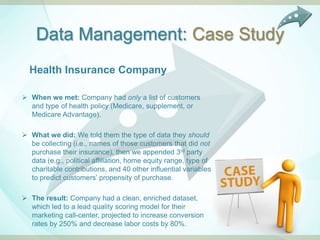
SlideShare a Scribd company logo
Using Customer Data
                             to Build Intimacy,
                             Engagement, and
                             Loyalty
                             Presented by
                             Dr. James Lani, CEO


2627 McCormick Drive, Suite 102, Clearwater, FL 33759
Let‟s break that down…


Using Customer Data
to Build Intimacy (2-way street),
Engagement (your engagement with data),
and Customer Loyalty
The presentation

•What I believe
•What should be done
•The result
What I Believe
 RAW DATA IS A COMPLETELY
 UNDER-USED COMPANY ASSET
What should be done?
 PROGRAMS DEPLOYED TO
 AGGREGATE DATA, CREATE
 PIVOT TABLES AND GRAPHS,
 CONDUCT REGRESSION AND
 CLUSTER ANALYSIS, TO LINK
 AND ORGANIZE YOUR
 INFORMATION.
What results?
 USEABLE BI, CI, YOUR
 KNOWLEDGE OF YOUR
 CUSTOMER INCREASES
 THROUGH ENGAGEMENT WITH
 THE DATA, RESULTING IN
 GREATER LOYALITY
If I’m successful in this presentation:
 Change your mindset. Your mind will
  change about your data, you will see data
  as usefulness business intelligence, and
  you will immediately apply it. Have a
  relationship to the data; see patterns and
  connections.

 Pull data together and use it. You will
  aggregate your company‟s data, conduct
  appropriate statistical analyses, and use
  the information for marketing initiatives.

 Grow your business. The strategies and
  initiatives will inherently lead to greater
  understanding and customer intimacy, and
  result in marketing programs with greater
  ROI, your internal resources are more
  appropriately allocated, and your net profit
  grows.
Why do I believe what I believe?
My experience
 Companies spent a lot of time, money, and effort to collecting or buying
  data—the profit potential from that data lays dormant within the company‟s
  walls.

 Data sits in different silo‟s in the organization (unmerged marketing
  department data with financial department data).

 Companies are not appending 3rd party data to potentially strengthen the
  customer intelligence gleaned from in-house data.

 Don‟t see strategic business and customer intelligence, and marketing
  intelligence as a propriety asset to organization or competitive advantage.
Let‟s Talk
about Data
Data is Messy
                                                              Number
User ID Region   $ Sales   Start Date    End Date    Tokens    Items   Age Type T1v13   T1v14
 37854    N      24840     02/10/2003   02/10/2003              144     42  5     1       5
109450    S      97257     01/09/2010   01/09/2010              233     48  4     2       5
111028    M       99011    02/26/2010   02/26/2010              239     22  3     2       4
120757    M      110282    02/10/2011   02/10/2011              256     41  4     3       4
107447    M      95106     10/21/2009   10/21/2009              243     21  5     1       5
119699   NW      108841    01/13/2011   01/13/2011              260     22  4     3       4
110602   SW      98553     02/08/2010   02/08/2010              267     44  5     1       5
                                                    TFZ8-
89148     E      76110     01/21/2008   01/21/2008 75WHPQ      175     36   4     3      4
                                                    TFZ8-
95408     E      82158     08/26/2008   08/26/2008 VYYEXV      156     32   5     3      5
          E                                         3GVD-
114378           102630    07/01/2010   07/02/2010 DKJS84      261     22   5     2      5
109653    M      97486     01/15/2010   01/15/2010             253     29   5     3      5
          E
60462            48832     06/11/2005   09/11/2005             147     19   5     2      5
53701     M      42205     09/13/2004   09/16/2004             143     21   4     3      5
                                                    TFZ8-
107652   Mid     95334     10/27/2009   10/27/2009 FP3BUP      228     19   5     3      5
115355    S      103666    08/03/2010   08/03/2010             262     30   4     4      5
119629    S      108716    01/11/2011   01/11/2011             266     19   4     4      4
Data CAN be managed,
     then used for
     visualization,
segmentation, scoring,
        and churn
analysis…which will get
    y o u t o l o y a l i t y.
Data Management: Case Study
  Health Insurance Company

 When we met: Company had only a list of customers
  and type of health policy (Medicare, supplement, or
  Medicare Advantage).

 What we did: We told them the type of data they should
  be collecting (i.e., names of those customers that did not
  purchase their insurance), then we appended 3rd party
  data (e.g., political affiliation, home equity range, type of
  charitable contributions, and 40 other influential variables
  to predict customers‟ propensity of purchase.

 The result: Company had a clean, enriched dataset,
  which led to a lead quality scoring model for their
  marketing call-center, projected to increase conversion
  rates by 250% and decrease labor costs by 80%.
Talk about
Data Visualization
             The greatest value of a picture is
            when it forces us to notice what we
                         never expected to see.

                             — John W. Tukey

          Far better an approximate answer to
              the right question, which is often
            vague, than an exact answer to the
          wrong question, which can always be
                                 made precise.

                             — John W. Tukey
What scares us?
Whose twittering?
Napoleon‟s Army by the Month
Data Visualization: Benefits
 Visualize distribution of a variable
  and see patterns (e.g., sales in „000
  over 1 year) with line charts,
  histograms and trend lines.

 See relationships between variables
  with scatter plots (E.g., relationship
  between calls and number of sales)
  and heat maps.

 Classify variables (e.g., percent of
  gross revenue by salesperson) with
  bar charts and figures.
Data Visualization: Case Study
Foreclosure Home Buying Company
 The result: Table 1 showed the home buying company which banks were
  selling homes for relative to the assessed value. This intelligence told
  the company how much to consider bidding for a $100,000 from Wells
  Fargo compared to Wachovia.

Table 1. Sold Price/Assessed Value Percentage by Bank
  Bank                                     Auction priced/
                                           Assessed value
  Wachovia Bank                                45.73
  Bank of New York                             42.60
  Deutsche Bank                                40.36
  BAC Home Loans                               37.68
  US Bank                                      37.68
  Bank of America                              36.92
  Wells Fargo Bank                             34.19
Market Segmentation:
Better understand who you‟re selling to
 and what message appeals to them
Market Segmentation: Benefits
            Determining the number of market
              segments and defining the
              characteristics of the segments.

             Additionally, there‟s strategic
              marketing…
                 Once you know how many segments
                  exist, you can decide on how many to
                  go after.
                 Once you decide to go after a particular
                  segment, you can now develop a
                  marketing program and message to go
                  after that segment.
                 Once you decide to go after a segment,
                  you can now position your company
                  brand between that segment and your
                  strategy.
Market Segmentation:
Customers have differentiated needs/buying process

Segmentation has the advantage of differentiating customers
        by profitability and needs/buying process

 High
  Profitability


Low
                  Homogeneous      Customer       Differentiated
                  needs/buying                    needs/buying
                  process                         process
Market Segmentation: Example
   An auto insurance study found its customers to have three segments: Price
    conscious, Brand loyalists, and Internet buyers.
   Mercury Auto Insurance company pursued the price conscious customer segment
    with “low rates from $29.99/month” and positioned themselves as the “low-cost auto
    insurance leader.”

                            70

                            60
     Percent of Customers


                            50

                            40

                            30

                            20

                            10

                             0
                                 Price conscious    Brand loyalists   Internet buyers
                                                   Type of Customer
Market Segmentation: Case Study
Eyeglass Company
   When we met: Company had data (n=947) relating to 45 variables such as staff, location, type glasses, and sale
    price of the glasses.
   What we did: We segmented data into 5 distinct segments with descriptions, and built an Excel algorithm so that
    future stores could be categorized into one of the 5 segments. Validation using a hold-out sample identified a
    misclassification of just 2.42%.
   The results: Smaller free-standing stores have a similarly diverse frame selection as larger stores, and moderate
    size stores in strip malls sold largest percent of high-end glasses.

                                               Segment 1       Segment 2        Segment 3        Segment 4      Segment 5
Q1: How is your practice staffed             Optometrist:80% Ophthalmologist: Optometrist:79% Optometrist:79% Optometrist:
(Credentials)?                                                    40%                                               90%
Q2: How is your practice staffed (Presence)?   Owner:85%       Owner:47%        Owner:70%       Owner:71%      Owner:72%
Q3: Where is this practice located?           Free standing   Free standing    Free standing   Strip mall:44% Strip mall:84%
                                              building:94%    building:64%     building:64%
Q4: In-house lab                                No in-house    In-house lab on-   In-house lab on-   No in-house    In-house lab
                                               services:100%       site:87%           site:93%       services:99%   on-site:95%
Q5: In-house Lens Jobs per week                     10.0             172.7               57.7             0.0           65.4
Q6: In-house percentage of total unit volume        30.2              54.5               42.5             0.0           43.9
Q7: Square feet                                   485.6             1249.8              810.2            630.4        768.6
Q8: Optical frames                                813.9              870.8              913.1            615.8         955.6
Q9: Sunglasses                                     74.2              124.2              139.0            96.7          149.9
Q10: Children optical frames                       65.1              158.7               79.2            83.4          127.0
Q11: Percentage of frame sales: Under $100         15.8               20.7               17.5            15.0          16.3
Q12: Percentage of frame sales: $100 - $200        52.3               40.1               45.1            48.5          32.5
Q13: Percentage of frame sales: $201 - $300        23.4               24.9               26.2            26.9          39.6
Lead Quality Scoring:
Who has the propensity to
         buy?
Lead Quality Scoring: Getting to the
               Right Customers

 Identifying those most likely to buy your
  product or service
     Minimizing your marketing efforts to
      reach those with a high propensity to
      purchase
       Response rate increases
       Cost per sale decreases
       ROI of your campaign increases
Lead Quality Scoring: Case Study
Health Insurance Company
   When we met: Company had data on
    current clients (n=16,947): name, billing
    information, and type of insurance (that‟s
    it).
   What we did: First, we requested data on
    an additional 2,000 NON-customers, then
    appended data to these nearly 19,000
    individuals.
                           The appended data included:


   Age range (18-24, 25-29, …75+)                          Political affiliation (Democratic, Republican, Independent…)
   Marital status (single, married,…)                      Vehicle manufacturer (Acura, Audi, Buick, …Volvo)
   Gender     (Male, Female, Unknown)                      Neilson Region (East, metro chicago, West, …)
   Religion (catholic, Hindu, Jewish…)                     Mean years of schooling (HS, Some college, Graduate)
   Credit card type (Bank, retail, oil…)                   Languages spoken (English, Russian, Spanish…)
   Net worth Rank (Top, 2nd, 3rd, …15th)                   Heavy internet user (1=most likely, 10=least likely)
   Home value ($1-$50k, $51k-$100k…)                       Boat population type (Inboard, Outboard, Other)
   Mortgage loan type (Cash, FHA, VA…)
   Occupation (Business owner, Prof, health services,
    teacher, military)
Lead Quality Scoring: Getting to the
           right prospects


                           Response Rate with Lead Scoring


% of leads
purchasing                     Response Rate without Lead Scoring

product or
  service


                % of leads contacted
Lead Quality Scoring: the results

   New leads scored for
                               4
    quality.
                               3     Platinum
   Scoring algorithm to use
                               2     Gold
    for new leads as they
                                     Silver
    come in.                   1
                                     Bronze
                               0
Retention / LTV Analysis
Retention Analysis: Benefits
              The greatest benefits of retention
                analysis are:
                 Identify customers who will likely
                  churn, and implement interventions to
                  halt churn.
                 Identify unprofitable customers and
                  force churn.
                 Identify employees that are likely to
                  quit.
                 Increase retention rates
                 Improve customer loyalty by offering
                  customized incentives.
Retention Analysis: Case Study


   Farmer‟s insurance has been in business for over 80 years with 15 million
    customers and $15 billion in revenue, and no predictive analytics.
   They found that the top 5% of customers yielded the company about
    $16,000 in customer LTV, the bottom 5% yielded just $400!
   Churn analysis and LTV can tell you which customers to shed and which to
    keep.
Questions about your
 business concerns
   and Answers

More Related Content

Viewers also liked

What are customer value,satisfaction,and loyalty, and how companies deliver t...
What are customer value,satisfaction,and loyalty, and how companies deliver t...What are customer value,satisfaction,and loyalty, and how companies deliver t...
What are customer value,satisfaction,and loyalty, and how companies deliver t...
Sameer Mathur
 
Presentacion powerpoint
Presentacion powerpointPresentacion powerpoint
Presentacion powerpoint
Alejandro Arenas
 
Customer intimacy
Customer intimacyCustomer intimacy
Customer intimacy
Nur Aqilah Ahmad Khairi
 
Building customer loyalty
Building customer loyaltyBuilding customer loyalty
Building customer loyalty
Bolaji Okusaga
 
Customer Intimacy Using IBM SPSS
Customer Intimacy Using IBM SPSS  Customer Intimacy Using IBM SPSS
Customer Intimacy Using IBM SPSS
Mayur Nanotkar
 
How to get great customer experiences
How to get great  customer experiencesHow to get great  customer experiences
How to get great customer experiences
Athalie Stegeman
 
Building customer loyalty programs
Building customer loyalty programsBuilding customer loyalty programs
Building customer loyalty programs
smittal
 
12 Days of Productivity
12 Days of Productivity12 Days of Productivity
12 Days of Productivity
Redbooth
 

Viewers also liked (8)

What are customer value,satisfaction,and loyalty, and how companies deliver t...
What are customer value,satisfaction,and loyalty, and how companies deliver t...What are customer value,satisfaction,and loyalty, and how companies deliver t...
What are customer value,satisfaction,and loyalty, and how companies deliver t...
 
Presentacion powerpoint
Presentacion powerpointPresentacion powerpoint
Presentacion powerpoint
 
Customer intimacy
Customer intimacyCustomer intimacy
Customer intimacy
 
Building customer loyalty
Building customer loyaltyBuilding customer loyalty
Building customer loyalty
 
Customer Intimacy Using IBM SPSS
Customer Intimacy Using IBM SPSS  Customer Intimacy Using IBM SPSS
Customer Intimacy Using IBM SPSS
 
How to get great customer experiences
How to get great  customer experiencesHow to get great  customer experiences
How to get great customer experiences
 
Building customer loyalty programs
Building customer loyalty programsBuilding customer loyalty programs
Building customer loyalty programs
 
12 Days of Productivity
12 Days of Productivity12 Days of Productivity
12 Days of Productivity
 

Similar to Using Customer Data to Build Intimacy, Engagement, and Loyalty

Intelli-Global Overview 051313
Intelli-Global Overview 051313Intelli-Global Overview 051313
Intelli-Global Overview 051313
Intelli-Global
 
Explicato Company Overview
Explicato Company OverviewExplicato Company Overview
Explicato Company Overview
George Yankov
 
Trust & Transparency: Consumer & Innovation Trends
Trust & Transparency: Consumer & Innovation TrendsTrust & Transparency: Consumer & Innovation Trends
Trust & Transparency: Consumer & Innovation Trends
ReportLinker.com
 
Herramientas - Project
Herramientas - ProjectHerramientas - Project
Herramientas - Project
majito2010
 
Principles - Ch3 - Segmentation and Targeting
Principles - Ch3 - Segmentation and TargetingPrinciples - Ch3 - Segmentation and Targeting
Principles - Ch3 - Segmentation and Targeting
German Jordanian University
 
Latest Frost & Sullivan’s Toolkit -Customer Strategy (Sample)
Latest Frost & Sullivan’s Toolkit -Customer Strategy (Sample)Latest Frost & Sullivan’s Toolkit -Customer Strategy (Sample)
Latest Frost & Sullivan’s Toolkit -Customer Strategy (Sample)
srizzo84
 
201007 Nolan QNL: Strategic Priorities Persist
201007 Nolan QNL: Strategic Priorities Persist201007 Nolan QNL: Strategic Priorities Persist
201007 Nolan QNL: Strategic Priorities Persist
Steven Callahan
 
A Capability Model for Driving Customer Engagement in a Connected World
A Capability Model for Driving Customer Engagement in a Connected WorldA Capability Model for Driving Customer Engagement in a Connected World
A Capability Model for Driving Customer Engagement in a Connected World
Acxiom Corporation
 
Bank Customer Segmentation & Insurance Claim Prediction
Bank Customer Segmentation & Insurance Claim PredictionBank Customer Segmentation & Insurance Claim Prediction
Bank Customer Segmentation & Insurance Claim Prediction
IRJET Journal
 
Donor Profiles and Data Analytics 101
Donor Profiles and Data Analytics 101Donor Profiles and Data Analytics 101
Donor Profiles and Data Analytics 101
InfoCision Management Corporation
 
Product Reviews Software Market Size, Share, & Trends Estimation Report By Ty...
Product Reviews Software Market Size, Share, & Trends Estimation Report By Ty...Product Reviews Software Market Size, Share, & Trends Estimation Report By Ty...
Product Reviews Software Market Size, Share, & Trends Estimation Report By Ty...
subishsam
 
Data MiningData MiningData MiningData Mining
Data MiningData MiningData MiningData MiningData MiningData MiningData MiningData Mining
Data MiningData MiningData MiningData Mining
abdulraqeebalareqi1
 
Digital Experience: Are Brands Meeting Consumer Expectations?
Digital Experience: Are Brands Meeting Consumer Expectations?Digital Experience: Are Brands Meeting Consumer Expectations?
Digital Experience: Are Brands Meeting Consumer Expectations?
Dmytro Lysiuk
 
Dymanic beneifts enrollment & data driven marketing ppt
Dymanic  beneifts enrollment & data driven marketing ppt Dymanic  beneifts enrollment & data driven marketing ppt
Dymanic beneifts enrollment & data driven marketing ppt
Robertafinium
 
Customer analytics. Turn big data into big value
Customer analytics. Turn big data into big valueCustomer analytics. Turn big data into big value
Customer analytics. Turn big data into big value
Josep Arroyo
 
Sample.pdXcf
Sample.pdXcfSample.pdXcf
Sample.pdXcf
FroilanBanal1
 
Como fazer Análise de Clientes para Maximizar Resultados, Experiência e Vendas
Como fazer Análise de Clientes para Maximizar Resultados, Experiência e VendasComo fazer Análise de Clientes para Maximizar Resultados, Experiência e Vendas
Como fazer Análise de Clientes para Maximizar Resultados, Experiência e Vendas
Lilian Strassacappa
 
Customer Analytics for Dummies
Customer Analytics for DummiesCustomer Analytics for Dummies
Customer Analytics for Dummies
Liberteks
 
Business Segmentation
Business SegmentationBusiness Segmentation
Business Segmentation
beckerdave
 
Craig Rispin Keynote for Cincom 16 December 2016
Craig Rispin Keynote for Cincom 16 December 2016Craig Rispin Keynote for Cincom 16 December 2016
Craig Rispin Keynote for Cincom 16 December 2016
Craig Rispin
 

Similar to Using Customer Data to Build Intimacy, Engagement, and Loyalty (20)

Intelli-Global Overview 051313
Intelli-Global Overview 051313Intelli-Global Overview 051313
Intelli-Global Overview 051313
 
Explicato Company Overview
Explicato Company OverviewExplicato Company Overview
Explicato Company Overview
 
Trust & Transparency: Consumer & Innovation Trends
Trust & Transparency: Consumer & Innovation TrendsTrust & Transparency: Consumer & Innovation Trends
Trust & Transparency: Consumer & Innovation Trends
 
Herramientas - Project
Herramientas - ProjectHerramientas - Project
Herramientas - Project
 
Principles - Ch3 - Segmentation and Targeting
Principles - Ch3 - Segmentation and TargetingPrinciples - Ch3 - Segmentation and Targeting
Principles - Ch3 - Segmentation and Targeting
 
Latest Frost & Sullivan’s Toolkit -Customer Strategy (Sample)
Latest Frost & Sullivan’s Toolkit -Customer Strategy (Sample)Latest Frost & Sullivan’s Toolkit -Customer Strategy (Sample)
Latest Frost & Sullivan’s Toolkit -Customer Strategy (Sample)
 
201007 Nolan QNL: Strategic Priorities Persist
201007 Nolan QNL: Strategic Priorities Persist201007 Nolan QNL: Strategic Priorities Persist
201007 Nolan QNL: Strategic Priorities Persist
 
A Capability Model for Driving Customer Engagement in a Connected World
A Capability Model for Driving Customer Engagement in a Connected WorldA Capability Model for Driving Customer Engagement in a Connected World
A Capability Model for Driving Customer Engagement in a Connected World
 
Bank Customer Segmentation & Insurance Claim Prediction
Bank Customer Segmentation & Insurance Claim PredictionBank Customer Segmentation & Insurance Claim Prediction
Bank Customer Segmentation & Insurance Claim Prediction
 
Donor Profiles and Data Analytics 101
Donor Profiles and Data Analytics 101Donor Profiles and Data Analytics 101
Donor Profiles and Data Analytics 101
 
Product Reviews Software Market Size, Share, & Trends Estimation Report By Ty...
Product Reviews Software Market Size, Share, & Trends Estimation Report By Ty...Product Reviews Software Market Size, Share, & Trends Estimation Report By Ty...
Product Reviews Software Market Size, Share, & Trends Estimation Report By Ty...
 
Data MiningData MiningData MiningData Mining
Data MiningData MiningData MiningData MiningData MiningData MiningData MiningData Mining
Data MiningData MiningData MiningData Mining
 
Digital Experience: Are Brands Meeting Consumer Expectations?
Digital Experience: Are Brands Meeting Consumer Expectations?Digital Experience: Are Brands Meeting Consumer Expectations?
Digital Experience: Are Brands Meeting Consumer Expectations?
 
Dymanic beneifts enrollment & data driven marketing ppt
Dymanic  beneifts enrollment & data driven marketing ppt Dymanic  beneifts enrollment & data driven marketing ppt
Dymanic beneifts enrollment & data driven marketing ppt
 
Customer analytics. Turn big data into big value
Customer analytics. Turn big data into big valueCustomer analytics. Turn big data into big value
Customer analytics. Turn big data into big value
 
Sample.pdXcf
Sample.pdXcfSample.pdXcf
Sample.pdXcf
 
Como fazer Análise de Clientes para Maximizar Resultados, Experiência e Vendas
Como fazer Análise de Clientes para Maximizar Resultados, Experiência e VendasComo fazer Análise de Clientes para Maximizar Resultados, Experiência e Vendas
Como fazer Análise de Clientes para Maximizar Resultados, Experiência e Vendas
 
Customer Analytics for Dummies
Customer Analytics for DummiesCustomer Analytics for Dummies
Customer Analytics for Dummies
 
Business Segmentation
Business SegmentationBusiness Segmentation
Business Segmentation
 
Craig Rispin Keynote for Cincom 16 December 2016
Craig Rispin Keynote for Cincom 16 December 2016Craig Rispin Keynote for Cincom 16 December 2016
Craig Rispin Keynote for Cincom 16 December 2016
 

More from Statistics Solutions

Dissertation Library Search
Dissertation Library SearchDissertation Library Search
Dissertation Library Search
Statistics Solutions
 
Navigating Writing Advice to Get Your Dissertation Moving
Navigating Writing Advice to Get Your Dissertation MovingNavigating Writing Advice to Get Your Dissertation Moving
Navigating Writing Advice to Get Your Dissertation Moving
Statistics Solutions
 
Navigating the IRB
Navigating the IRBNavigating the IRB
Navigating the IRB
Statistics Solutions
 
How to Conduct and Interpret Tests of Differences
How to Conduct and Interpret Tests of DifferencesHow to Conduct and Interpret Tests of Differences
How to Conduct and Interpret Tests of Differences
Statistics Solutions
 
Confidently Present Your Quantitative Results Chapter
Confidently Present Your Quantitative Results Chapter Confidently Present Your Quantitative Results Chapter
Confidently Present Your Quantitative Results Chapter
Statistics Solutions
 
How to Conduct and Interpret Correlation Tests
How to Conduct and Interpret Correlation TestsHow to Conduct and Interpret Correlation Tests
How to Conduct and Interpret Correlation Tests
Statistics Solutions
 
How to Deal With Missing Data
How to Deal With Missing DataHow to Deal With Missing Data
How to Deal With Missing Data
Statistics Solutions
 
Choosing your Methodology
Choosing your Methodology Choosing your Methodology
Choosing your Methodology
Statistics Solutions
 
Breakdown of Regression Models
Breakdown of Regression ModelsBreakdown of Regression Models
Breakdown of Regression Models
Statistics Solutions
 
Qualitative Data Collection
Qualitative Data CollectionQualitative Data Collection
Qualitative Data Collection
Statistics Solutions
 
Why is Theory Important?
Why is Theory Important?Why is Theory Important?
Why is Theory Important?
Statistics Solutions
 
Simplify Your Quantitative Results Chapter
Simplify Your Quantitative Results ChapterSimplify Your Quantitative Results Chapter
Simplify Your Quantitative Results Chapter
Statistics Solutions
 
How to Conduct and Interpret T-Tests
How to Conduct and Interpret T-TestsHow to Conduct and Interpret T-Tests
How to Conduct and Interpret T-Tests
Statistics Solutions
 
Defense Preparation for Quantitative Methods
Defense Preparation for Quantitative MethodsDefense Preparation for Quantitative Methods
Defense Preparation for Quantitative Methods
Statistics Solutions
 
Conducting Tests of Differences
Conducting Tests of DifferencesConducting Tests of Differences
Conducting Tests of Differences
Statistics Solutions
 
Preparing to Defend Your Research
Preparing to Defend Your Research Preparing to Defend Your Research
Preparing to Defend Your Research
Statistics Solutions
 
Attitude, Committee Selection, and Topic Development
Attitude, Committee Selection, and Topic DevelopmentAttitude, Committee Selection, and Topic Development
Attitude, Committee Selection, and Topic Development
Statistics Solutions
 
How to Conduct and Interpret ANOVAs
How to Conduct and Interpret ANOVAsHow to Conduct and Interpret ANOVAs
How to Conduct and Interpret ANOVAs
Statistics Solutions
 
7 Secrets to Completing your Dissertation in One Year
7 Secrets to Completing your Dissertation in One Year7 Secrets to Completing your Dissertation in One Year
7 Secrets to Completing your Dissertation in One Year
Statistics Solutions
 
Addressing Feedback- Getting Through Quickly and Efficiently
Addressing Feedback- Getting Through Quickly and EfficientlyAddressing Feedback- Getting Through Quickly and Efficiently
Addressing Feedback- Getting Through Quickly and Efficiently
Statistics Solutions
 

More from Statistics Solutions (20)

Dissertation Library Search
Dissertation Library SearchDissertation Library Search
Dissertation Library Search
 
Navigating Writing Advice to Get Your Dissertation Moving
Navigating Writing Advice to Get Your Dissertation MovingNavigating Writing Advice to Get Your Dissertation Moving
Navigating Writing Advice to Get Your Dissertation Moving
 
Navigating the IRB
Navigating the IRBNavigating the IRB
Navigating the IRB
 
How to Conduct and Interpret Tests of Differences
How to Conduct and Interpret Tests of DifferencesHow to Conduct and Interpret Tests of Differences
How to Conduct and Interpret Tests of Differences
 
Confidently Present Your Quantitative Results Chapter
Confidently Present Your Quantitative Results Chapter Confidently Present Your Quantitative Results Chapter
Confidently Present Your Quantitative Results Chapter
 
How to Conduct and Interpret Correlation Tests
How to Conduct and Interpret Correlation TestsHow to Conduct and Interpret Correlation Tests
How to Conduct and Interpret Correlation Tests
 
How to Deal With Missing Data
How to Deal With Missing DataHow to Deal With Missing Data
How to Deal With Missing Data
 
Choosing your Methodology
Choosing your Methodology Choosing your Methodology
Choosing your Methodology
 
Breakdown of Regression Models
Breakdown of Regression ModelsBreakdown of Regression Models
Breakdown of Regression Models
 
Qualitative Data Collection
Qualitative Data CollectionQualitative Data Collection
Qualitative Data Collection
 
Why is Theory Important?
Why is Theory Important?Why is Theory Important?
Why is Theory Important?
 
Simplify Your Quantitative Results Chapter
Simplify Your Quantitative Results ChapterSimplify Your Quantitative Results Chapter
Simplify Your Quantitative Results Chapter
 
How to Conduct and Interpret T-Tests
How to Conduct and Interpret T-TestsHow to Conduct and Interpret T-Tests
How to Conduct and Interpret T-Tests
 
Defense Preparation for Quantitative Methods
Defense Preparation for Quantitative MethodsDefense Preparation for Quantitative Methods
Defense Preparation for Quantitative Methods
 
Conducting Tests of Differences
Conducting Tests of DifferencesConducting Tests of Differences
Conducting Tests of Differences
 
Preparing to Defend Your Research
Preparing to Defend Your Research Preparing to Defend Your Research
Preparing to Defend Your Research
 
Attitude, Committee Selection, and Topic Development
Attitude, Committee Selection, and Topic DevelopmentAttitude, Committee Selection, and Topic Development
Attitude, Committee Selection, and Topic Development
 
How to Conduct and Interpret ANOVAs
How to Conduct and Interpret ANOVAsHow to Conduct and Interpret ANOVAs
How to Conduct and Interpret ANOVAs
 
7 Secrets to Completing your Dissertation in One Year
7 Secrets to Completing your Dissertation in One Year7 Secrets to Completing your Dissertation in One Year
7 Secrets to Completing your Dissertation in One Year
 
Addressing Feedback- Getting Through Quickly and Efficiently
Addressing Feedback- Getting Through Quickly and EfficientlyAddressing Feedback- Getting Through Quickly and Efficiently
Addressing Feedback- Getting Through Quickly and Efficiently
 

Recently uploaded

Understanding User Needs and Satisfying Them
Understanding User Needs and Satisfying ThemUnderstanding User Needs and Satisfying Them
Understanding User Needs and Satisfying Them
Aggregage
 
一比一原版新西兰奥塔哥大学毕业证(otago毕业证)如何办理
一比一原版新西兰奥塔哥大学毕业证(otago毕业证)如何办理一比一原版新西兰奥塔哥大学毕业证(otago毕业证)如何办理
一比一原版新西兰奥塔哥大学毕业证(otago毕业证)如何办理
taqyea
 
Top mailing list providers in the USA.pptx
Top mailing list providers in the USA.pptxTop mailing list providers in the USA.pptx
Top mailing list providers in the USA.pptx
JeremyPeirce1
 
3 Simple Steps To Buy Verified Payoneer Account In 2024
3 Simple Steps To Buy Verified Payoneer Account In 20243 Simple Steps To Buy Verified Payoneer Account In 2024
3 Simple Steps To Buy Verified Payoneer Account In 2024
SEOSMMEARTH
 
Satta Matka Dpboss Matka Guessing Kalyan Chart Indian Matka Kalyan panel Chart
Satta Matka Dpboss Matka Guessing Kalyan Chart Indian Matka Kalyan panel ChartSatta Matka Dpboss Matka Guessing Kalyan Chart Indian Matka Kalyan panel Chart
Satta Matka Dpboss Matka Guessing Kalyan Chart Indian Matka Kalyan panel Chart
➒➌➎➏➑➐➋➑➐➐Dpboss Matka Guessing Satta Matka Kalyan Chart Indian Matka
 
How to Implement a Strategy: Transform Your Strategy with BSC Designer's Comp...
How to Implement a Strategy: Transform Your Strategy with BSC Designer's Comp...How to Implement a Strategy: Transform Your Strategy with BSC Designer's Comp...
How to Implement a Strategy: Transform Your Strategy with BSC Designer's Comp...
Aleksey Savkin
 
Observation Lab PowerPoint Assignment for TEM 431
Observation Lab PowerPoint Assignment for TEM 431Observation Lab PowerPoint Assignment for TEM 431
Observation Lab PowerPoint Assignment for TEM 431
ecamare2
 
The 10 Most Influential Leaders Guiding Corporate Evolution, 2024.pdf
The 10 Most Influential Leaders Guiding Corporate Evolution, 2024.pdfThe 10 Most Influential Leaders Guiding Corporate Evolution, 2024.pdf
The 10 Most Influential Leaders Guiding Corporate Evolution, 2024.pdf
thesiliconleaders
 
2022 Vintage Roman Numerals Men Rings
2022 Vintage Roman  Numerals  Men  Rings2022 Vintage Roman  Numerals  Men  Rings
2022 Vintage Roman Numerals Men Rings
aragme
 
Best practices for project execution and delivery
Best practices for project execution and deliveryBest practices for project execution and delivery
Best practices for project execution and delivery
CLIVE MINCHIN
 
2024-6-01-IMPACTSilver-Corp-Presentation.pdf
2024-6-01-IMPACTSilver-Corp-Presentation.pdf2024-6-01-IMPACTSilver-Corp-Presentation.pdf
2024-6-01-IMPACTSilver-Corp-Presentation.pdf
hartfordclub1
 
Digital Transformation Frameworks: Driving Digital Excellence
Digital Transformation Frameworks: Driving Digital ExcellenceDigital Transformation Frameworks: Driving Digital Excellence
Digital Transformation Frameworks: Driving Digital Excellence
Operational Excellence Consulting
 
Creative Web Design Company in Singapore
Creative Web Design Company in SingaporeCreative Web Design Company in Singapore
Creative Web Design Company in Singapore
techboxsqauremedia
 
Lundin Gold Corporate Presentation - June 2024
Lundin Gold Corporate Presentation - June 2024Lundin Gold Corporate Presentation - June 2024
Lundin Gold Corporate Presentation - June 2024
Adnet Communications
 
Part 2 Deep Dive: Navigating the 2024 Slowdown
Part 2 Deep Dive: Navigating the 2024 SlowdownPart 2 Deep Dive: Navigating the 2024 Slowdown
Part 2 Deep Dive: Navigating the 2024 Slowdown
jeffkluth1
 
Hamster Kombat' Telegram Game Surpasses 100 Million Players—Token Release Sch...
Hamster Kombat' Telegram Game Surpasses 100 Million Players—Token Release Sch...Hamster Kombat' Telegram Game Surpasses 100 Million Players—Token Release Sch...
Hamster Kombat' Telegram Game Surpasses 100 Million Players—Token Release Sch...
SOFTTECHHUB
 
amptalk_RecruitingDeck_english_2024.06.05
amptalk_RecruitingDeck_english_2024.06.05amptalk_RecruitingDeck_english_2024.06.05
amptalk_RecruitingDeck_english_2024.06.05
marketing317746
 
Organizational Change Leadership Agile Tour Geneve 2024
Organizational Change Leadership Agile Tour Geneve 2024Organizational Change Leadership Agile Tour Geneve 2024
Organizational Change Leadership Agile Tour Geneve 2024
Kirill Klimov
 
Building Your Employer Brand with Social Media
Building Your Employer Brand with Social MediaBuilding Your Employer Brand with Social Media
Building Your Employer Brand with Social Media
LuanWise
 
The Heart of Leadership_ How Emotional Intelligence Drives Business Success B...
The Heart of Leadership_ How Emotional Intelligence Drives Business Success B...The Heart of Leadership_ How Emotional Intelligence Drives Business Success B...
The Heart of Leadership_ How Emotional Intelligence Drives Business Success B...
Stephen Cashman
 

Recently uploaded (20)

Understanding User Needs and Satisfying Them
Understanding User Needs and Satisfying ThemUnderstanding User Needs and Satisfying Them
Understanding User Needs and Satisfying Them
 
一比一原版新西兰奥塔哥大学毕业证(otago毕业证)如何办理
一比一原版新西兰奥塔哥大学毕业证(otago毕业证)如何办理一比一原版新西兰奥塔哥大学毕业证(otago毕业证)如何办理
一比一原版新西兰奥塔哥大学毕业证(otago毕业证)如何办理
 
Top mailing list providers in the USA.pptx
Top mailing list providers in the USA.pptxTop mailing list providers in the USA.pptx
Top mailing list providers in the USA.pptx
 
3 Simple Steps To Buy Verified Payoneer Account In 2024
3 Simple Steps To Buy Verified Payoneer Account In 20243 Simple Steps To Buy Verified Payoneer Account In 2024
3 Simple Steps To Buy Verified Payoneer Account In 2024
 
Satta Matka Dpboss Matka Guessing Kalyan Chart Indian Matka Kalyan panel Chart
Satta Matka Dpboss Matka Guessing Kalyan Chart Indian Matka Kalyan panel ChartSatta Matka Dpboss Matka Guessing Kalyan Chart Indian Matka Kalyan panel Chart
Satta Matka Dpboss Matka Guessing Kalyan Chart Indian Matka Kalyan panel Chart
 
How to Implement a Strategy: Transform Your Strategy with BSC Designer's Comp...
How to Implement a Strategy: Transform Your Strategy with BSC Designer's Comp...How to Implement a Strategy: Transform Your Strategy with BSC Designer's Comp...
How to Implement a Strategy: Transform Your Strategy with BSC Designer's Comp...
 
Observation Lab PowerPoint Assignment for TEM 431
Observation Lab PowerPoint Assignment for TEM 431Observation Lab PowerPoint Assignment for TEM 431
Observation Lab PowerPoint Assignment for TEM 431
 
The 10 Most Influential Leaders Guiding Corporate Evolution, 2024.pdf
The 10 Most Influential Leaders Guiding Corporate Evolution, 2024.pdfThe 10 Most Influential Leaders Guiding Corporate Evolution, 2024.pdf
The 10 Most Influential Leaders Guiding Corporate Evolution, 2024.pdf
 
2022 Vintage Roman Numerals Men Rings
2022 Vintage Roman  Numerals  Men  Rings2022 Vintage Roman  Numerals  Men  Rings
2022 Vintage Roman Numerals Men Rings
 
Best practices for project execution and delivery
Best practices for project execution and deliveryBest practices for project execution and delivery
Best practices for project execution and delivery
 
2024-6-01-IMPACTSilver-Corp-Presentation.pdf
2024-6-01-IMPACTSilver-Corp-Presentation.pdf2024-6-01-IMPACTSilver-Corp-Presentation.pdf
2024-6-01-IMPACTSilver-Corp-Presentation.pdf
 
Digital Transformation Frameworks: Driving Digital Excellence
Digital Transformation Frameworks: Driving Digital ExcellenceDigital Transformation Frameworks: Driving Digital Excellence
Digital Transformation Frameworks: Driving Digital Excellence
 
Creative Web Design Company in Singapore
Creative Web Design Company in SingaporeCreative Web Design Company in Singapore
Creative Web Design Company in Singapore
 
Lundin Gold Corporate Presentation - June 2024
Lundin Gold Corporate Presentation - June 2024Lundin Gold Corporate Presentation - June 2024
Lundin Gold Corporate Presentation - June 2024
 
Part 2 Deep Dive: Navigating the 2024 Slowdown
Part 2 Deep Dive: Navigating the 2024 SlowdownPart 2 Deep Dive: Navigating the 2024 Slowdown
Part 2 Deep Dive: Navigating the 2024 Slowdown
 
Hamster Kombat' Telegram Game Surpasses 100 Million Players—Token Release Sch...
Hamster Kombat' Telegram Game Surpasses 100 Million Players—Token Release Sch...Hamster Kombat' Telegram Game Surpasses 100 Million Players—Token Release Sch...
Hamster Kombat' Telegram Game Surpasses 100 Million Players—Token Release Sch...
 
amptalk_RecruitingDeck_english_2024.06.05
amptalk_RecruitingDeck_english_2024.06.05amptalk_RecruitingDeck_english_2024.06.05
amptalk_RecruitingDeck_english_2024.06.05
 
Organizational Change Leadership Agile Tour Geneve 2024
Organizational Change Leadership Agile Tour Geneve 2024Organizational Change Leadership Agile Tour Geneve 2024
Organizational Change Leadership Agile Tour Geneve 2024
 
Building Your Employer Brand with Social Media
Building Your Employer Brand with Social MediaBuilding Your Employer Brand with Social Media
Building Your Employer Brand with Social Media
 
The Heart of Leadership_ How Emotional Intelligence Drives Business Success B...
The Heart of Leadership_ How Emotional Intelligence Drives Business Success B...The Heart of Leadership_ How Emotional Intelligence Drives Business Success B...
The Heart of Leadership_ How Emotional Intelligence Drives Business Success B...
 

Using Customer Data to Build Intimacy, Engagement, and Loyalty

  • 1. Using Customer Data to Build Intimacy, Engagement, and Loyalty Presented by Dr. James Lani, CEO 2627 McCormick Drive, Suite 102, Clearwater, FL 33759
  • 2. Let‟s break that down… Using Customer Data to Build Intimacy (2-way street), Engagement (your engagement with data), and Customer Loyalty
  • 3. The presentation •What I believe •What should be done •The result
  • 4. What I Believe RAW DATA IS A COMPLETELY UNDER-USED COMPANY ASSET
  • 5. What should be done? PROGRAMS DEPLOYED TO AGGREGATE DATA, CREATE PIVOT TABLES AND GRAPHS, CONDUCT REGRESSION AND CLUSTER ANALYSIS, TO LINK AND ORGANIZE YOUR INFORMATION.
  • 6. What results? USEABLE BI, CI, YOUR KNOWLEDGE OF YOUR CUSTOMER INCREASES THROUGH ENGAGEMENT WITH THE DATA, RESULTING IN GREATER LOYALITY
  • 7. If I’m successful in this presentation:  Change your mindset. Your mind will change about your data, you will see data as usefulness business intelligence, and you will immediately apply it. Have a relationship to the data; see patterns and connections.  Pull data together and use it. You will aggregate your company‟s data, conduct appropriate statistical analyses, and use the information for marketing initiatives.  Grow your business. The strategies and initiatives will inherently lead to greater understanding and customer intimacy, and result in marketing programs with greater ROI, your internal resources are more appropriately allocated, and your net profit grows.
  • 8. Why do I believe what I believe? My experience  Companies spent a lot of time, money, and effort to collecting or buying data—the profit potential from that data lays dormant within the company‟s walls.  Data sits in different silo‟s in the organization (unmerged marketing department data with financial department data).  Companies are not appending 3rd party data to potentially strengthen the customer intelligence gleaned from in-house data.  Don‟t see strategic business and customer intelligence, and marketing intelligence as a propriety asset to organization or competitive advantage.
  • 10. Data is Messy Number User ID Region $ Sales Start Date End Date Tokens Items Age Type T1v13 T1v14 37854 N 24840 02/10/2003 02/10/2003 144 42 5 1 5 109450 S 97257 01/09/2010 01/09/2010 233 48 4 2 5 111028 M 99011 02/26/2010 02/26/2010 239 22 3 2 4 120757 M 110282 02/10/2011 02/10/2011 256 41 4 3 4 107447 M 95106 10/21/2009 10/21/2009 243 21 5 1 5 119699 NW 108841 01/13/2011 01/13/2011 260 22 4 3 4 110602 SW 98553 02/08/2010 02/08/2010 267 44 5 1 5 TFZ8- 89148 E 76110 01/21/2008 01/21/2008 75WHPQ 175 36 4 3 4 TFZ8- 95408 E 82158 08/26/2008 08/26/2008 VYYEXV 156 32 5 3 5 E 3GVD- 114378 102630 07/01/2010 07/02/2010 DKJS84 261 22 5 2 5 109653 M 97486 01/15/2010 01/15/2010 253 29 5 3 5 E 60462 48832 06/11/2005 09/11/2005 147 19 5 2 5 53701 M 42205 09/13/2004 09/16/2004 143 21 4 3 5 TFZ8- 107652 Mid 95334 10/27/2009 10/27/2009 FP3BUP 228 19 5 3 5 115355 S 103666 08/03/2010 08/03/2010 262 30 4 4 5 119629 S 108716 01/11/2011 01/11/2011 266 19 4 4 4
  • 11. Data CAN be managed, then used for visualization, segmentation, scoring, and churn analysis…which will get y o u t o l o y a l i t y.
  • 12. Data Management: Case Study Health Insurance Company  When we met: Company had only a list of customers and type of health policy (Medicare, supplement, or Medicare Advantage).  What we did: We told them the type of data they should be collecting (i.e., names of those customers that did not purchase their insurance), then we appended 3rd party data (e.g., political affiliation, home equity range, type of charitable contributions, and 40 other influential variables to predict customers‟ propensity of purchase.  The result: Company had a clean, enriched dataset, which led to a lead quality scoring model for their marketing call-center, projected to increase conversion rates by 250% and decrease labor costs by 80%.
  • 13. Talk about Data Visualization The greatest value of a picture is when it forces us to notice what we never expected to see. — John W. Tukey Far better an approximate answer to the right question, which is often vague, than an exact answer to the wrong question, which can always be made precise. — John W. Tukey
  • 16. Napoleon‟s Army by the Month
  • 17. Data Visualization: Benefits  Visualize distribution of a variable and see patterns (e.g., sales in „000 over 1 year) with line charts, histograms and trend lines.  See relationships between variables with scatter plots (E.g., relationship between calls and number of sales) and heat maps.  Classify variables (e.g., percent of gross revenue by salesperson) with bar charts and figures.
  • 18. Data Visualization: Case Study Foreclosure Home Buying Company  The result: Table 1 showed the home buying company which banks were selling homes for relative to the assessed value. This intelligence told the company how much to consider bidding for a $100,000 from Wells Fargo compared to Wachovia. Table 1. Sold Price/Assessed Value Percentage by Bank Bank Auction priced/ Assessed value Wachovia Bank 45.73 Bank of New York 42.60 Deutsche Bank 40.36 BAC Home Loans 37.68 US Bank 37.68 Bank of America 36.92 Wells Fargo Bank 34.19
  • 19. Market Segmentation: Better understand who you‟re selling to and what message appeals to them
  • 20. Market Segmentation: Benefits Determining the number of market segments and defining the characteristics of the segments.  Additionally, there‟s strategic marketing…  Once you know how many segments exist, you can decide on how many to go after.  Once you decide to go after a particular segment, you can now develop a marketing program and message to go after that segment.  Once you decide to go after a segment, you can now position your company brand between that segment and your strategy.
  • 21. Market Segmentation: Customers have differentiated needs/buying process Segmentation has the advantage of differentiating customers by profitability and needs/buying process High Profitability Low Homogeneous Customer Differentiated needs/buying needs/buying process process
  • 22. Market Segmentation: Example  An auto insurance study found its customers to have three segments: Price conscious, Brand loyalists, and Internet buyers.  Mercury Auto Insurance company pursued the price conscious customer segment with “low rates from $29.99/month” and positioned themselves as the “low-cost auto insurance leader.” 70 60 Percent of Customers 50 40 30 20 10 0 Price conscious Brand loyalists Internet buyers Type of Customer
  • 23. Market Segmentation: Case Study Eyeglass Company  When we met: Company had data (n=947) relating to 45 variables such as staff, location, type glasses, and sale price of the glasses.  What we did: We segmented data into 5 distinct segments with descriptions, and built an Excel algorithm so that future stores could be categorized into one of the 5 segments. Validation using a hold-out sample identified a misclassification of just 2.42%.  The results: Smaller free-standing stores have a similarly diverse frame selection as larger stores, and moderate size stores in strip malls sold largest percent of high-end glasses. Segment 1 Segment 2 Segment 3 Segment 4 Segment 5 Q1: How is your practice staffed Optometrist:80% Ophthalmologist: Optometrist:79% Optometrist:79% Optometrist: (Credentials)? 40% 90% Q2: How is your practice staffed (Presence)? Owner:85% Owner:47% Owner:70% Owner:71% Owner:72% Q3: Where is this practice located? Free standing Free standing Free standing Strip mall:44% Strip mall:84% building:94% building:64% building:64% Q4: In-house lab No in-house In-house lab on- In-house lab on- No in-house In-house lab services:100% site:87% site:93% services:99% on-site:95% Q5: In-house Lens Jobs per week 10.0 172.7 57.7 0.0 65.4 Q6: In-house percentage of total unit volume 30.2 54.5 42.5 0.0 43.9 Q7: Square feet 485.6 1249.8 810.2 630.4 768.6 Q8: Optical frames 813.9 870.8 913.1 615.8 955.6 Q9: Sunglasses 74.2 124.2 139.0 96.7 149.9 Q10: Children optical frames 65.1 158.7 79.2 83.4 127.0 Q11: Percentage of frame sales: Under $100 15.8 20.7 17.5 15.0 16.3 Q12: Percentage of frame sales: $100 - $200 52.3 40.1 45.1 48.5 32.5 Q13: Percentage of frame sales: $201 - $300 23.4 24.9 26.2 26.9 39.6
  • 24. Lead Quality Scoring: Who has the propensity to buy?
  • 25. Lead Quality Scoring: Getting to the Right Customers  Identifying those most likely to buy your product or service  Minimizing your marketing efforts to reach those with a high propensity to purchase  Response rate increases  Cost per sale decreases  ROI of your campaign increases
  • 26. Lead Quality Scoring: Case Study Health Insurance Company  When we met: Company had data on current clients (n=16,947): name, billing information, and type of insurance (that‟s it).  What we did: First, we requested data on an additional 2,000 NON-customers, then appended data to these nearly 19,000 individuals. The appended data included:  Age range (18-24, 25-29, …75+)  Political affiliation (Democratic, Republican, Independent…)  Marital status (single, married,…)  Vehicle manufacturer (Acura, Audi, Buick, …Volvo)  Gender (Male, Female, Unknown)  Neilson Region (East, metro chicago, West, …)  Religion (catholic, Hindu, Jewish…)  Mean years of schooling (HS, Some college, Graduate)  Credit card type (Bank, retail, oil…)  Languages spoken (English, Russian, Spanish…)  Net worth Rank (Top, 2nd, 3rd, …15th)  Heavy internet user (1=most likely, 10=least likely)  Home value ($1-$50k, $51k-$100k…)  Boat population type (Inboard, Outboard, Other)  Mortgage loan type (Cash, FHA, VA…)  Occupation (Business owner, Prof, health services, teacher, military)
  • 27. Lead Quality Scoring: Getting to the right prospects Response Rate with Lead Scoring % of leads purchasing Response Rate without Lead Scoring product or service % of leads contacted
  • 28. Lead Quality Scoring: the results  New leads scored for 4 quality. 3 Platinum  Scoring algorithm to use 2 Gold for new leads as they Silver come in. 1 Bronze 0
  • 29. Retention / LTV Analysis
  • 30. Retention Analysis: Benefits The greatest benefits of retention analysis are:  Identify customers who will likely churn, and implement interventions to halt churn.  Identify unprofitable customers and force churn.  Identify employees that are likely to quit.  Increase retention rates  Improve customer loyalty by offering customized incentives.
  • 31. Retention Analysis: Case Study  Farmer‟s insurance has been in business for over 80 years with 15 million customers and $15 billion in revenue, and no predictive analytics.  They found that the top 5% of customers yielded the company about $16,000 in customer LTV, the bottom 5% yielded just $400!  Churn analysis and LTV can tell you which customers to shed and which to keep.
  • 32. Questions about your business concerns and Answers

Editor's Notes

  1. Let’s passionately sell it 
  2. Let’s passionately sell it 
  3. We do 5 things.
  4. We do 5 things.
  5. We do 5 things.
  6. We do 5 things.
  7. See data as valuable, let us analyze it, and grow.
  8. JOHN WITH $1.3 M in data, can’t find it.
  9. The key point is that when you see products ABC you can look to do something about June and July, or create an initiative to increase calls, reward George and Joe (and let them mentor Fred and Cindy--seriously!).
  10. We do 5 things.
  11. The key point is that when you see products ABC you can look to do something about June and July, or create an initiative to increase calls, reward George and Joe (and let them mentor Fred and Cindy--seriously!).
  12. You have to get the right data (health)
  13. The key point is that when you see products ABC you can look to do something about June and July, or create an initiative to increase calls, reward George and Joe (and let them mentor Fred and Cindy--seriously!).
  14. The key point is that when you see products ABC you can look to do something about June and July, or create an initiative to increase calls, reward George and Joe (and let them mentor Fred and Cindy--seriously!).
  15. The key point is that when you see products ABC you can look to do something about June and July, or create an initiative to increase calls, reward George and Joe (and let them mentor Fred and Cindy--seriously!).
  16. Shows a decrease in nov/dec 2010; deutsche/wachovia track each other tilsept 11; spikes down in dec 2011.
  17. Number of segments, characteristics of segments.
  18. Number of segments, characteristics of segments.
  19. If you treat everyone the same, you don’t know who are the profitable customers to go after and the unprofitable one to shed.
  20. Number of segments, characteristics of segments.
  21. Number of segments, characteristics of segments.
  22. Number of segments, characteristics of segments.
  23. Number of segments, characteristics of segments.
  24. Number of segments, characteristics of segments.
  25. Number of segments, characteristics of segments.
  26. Number of segments, characteristics of segments.
  27. Number of segments, characteristics of segments.
  28. Thanks for your attention!!!