Download to read offline
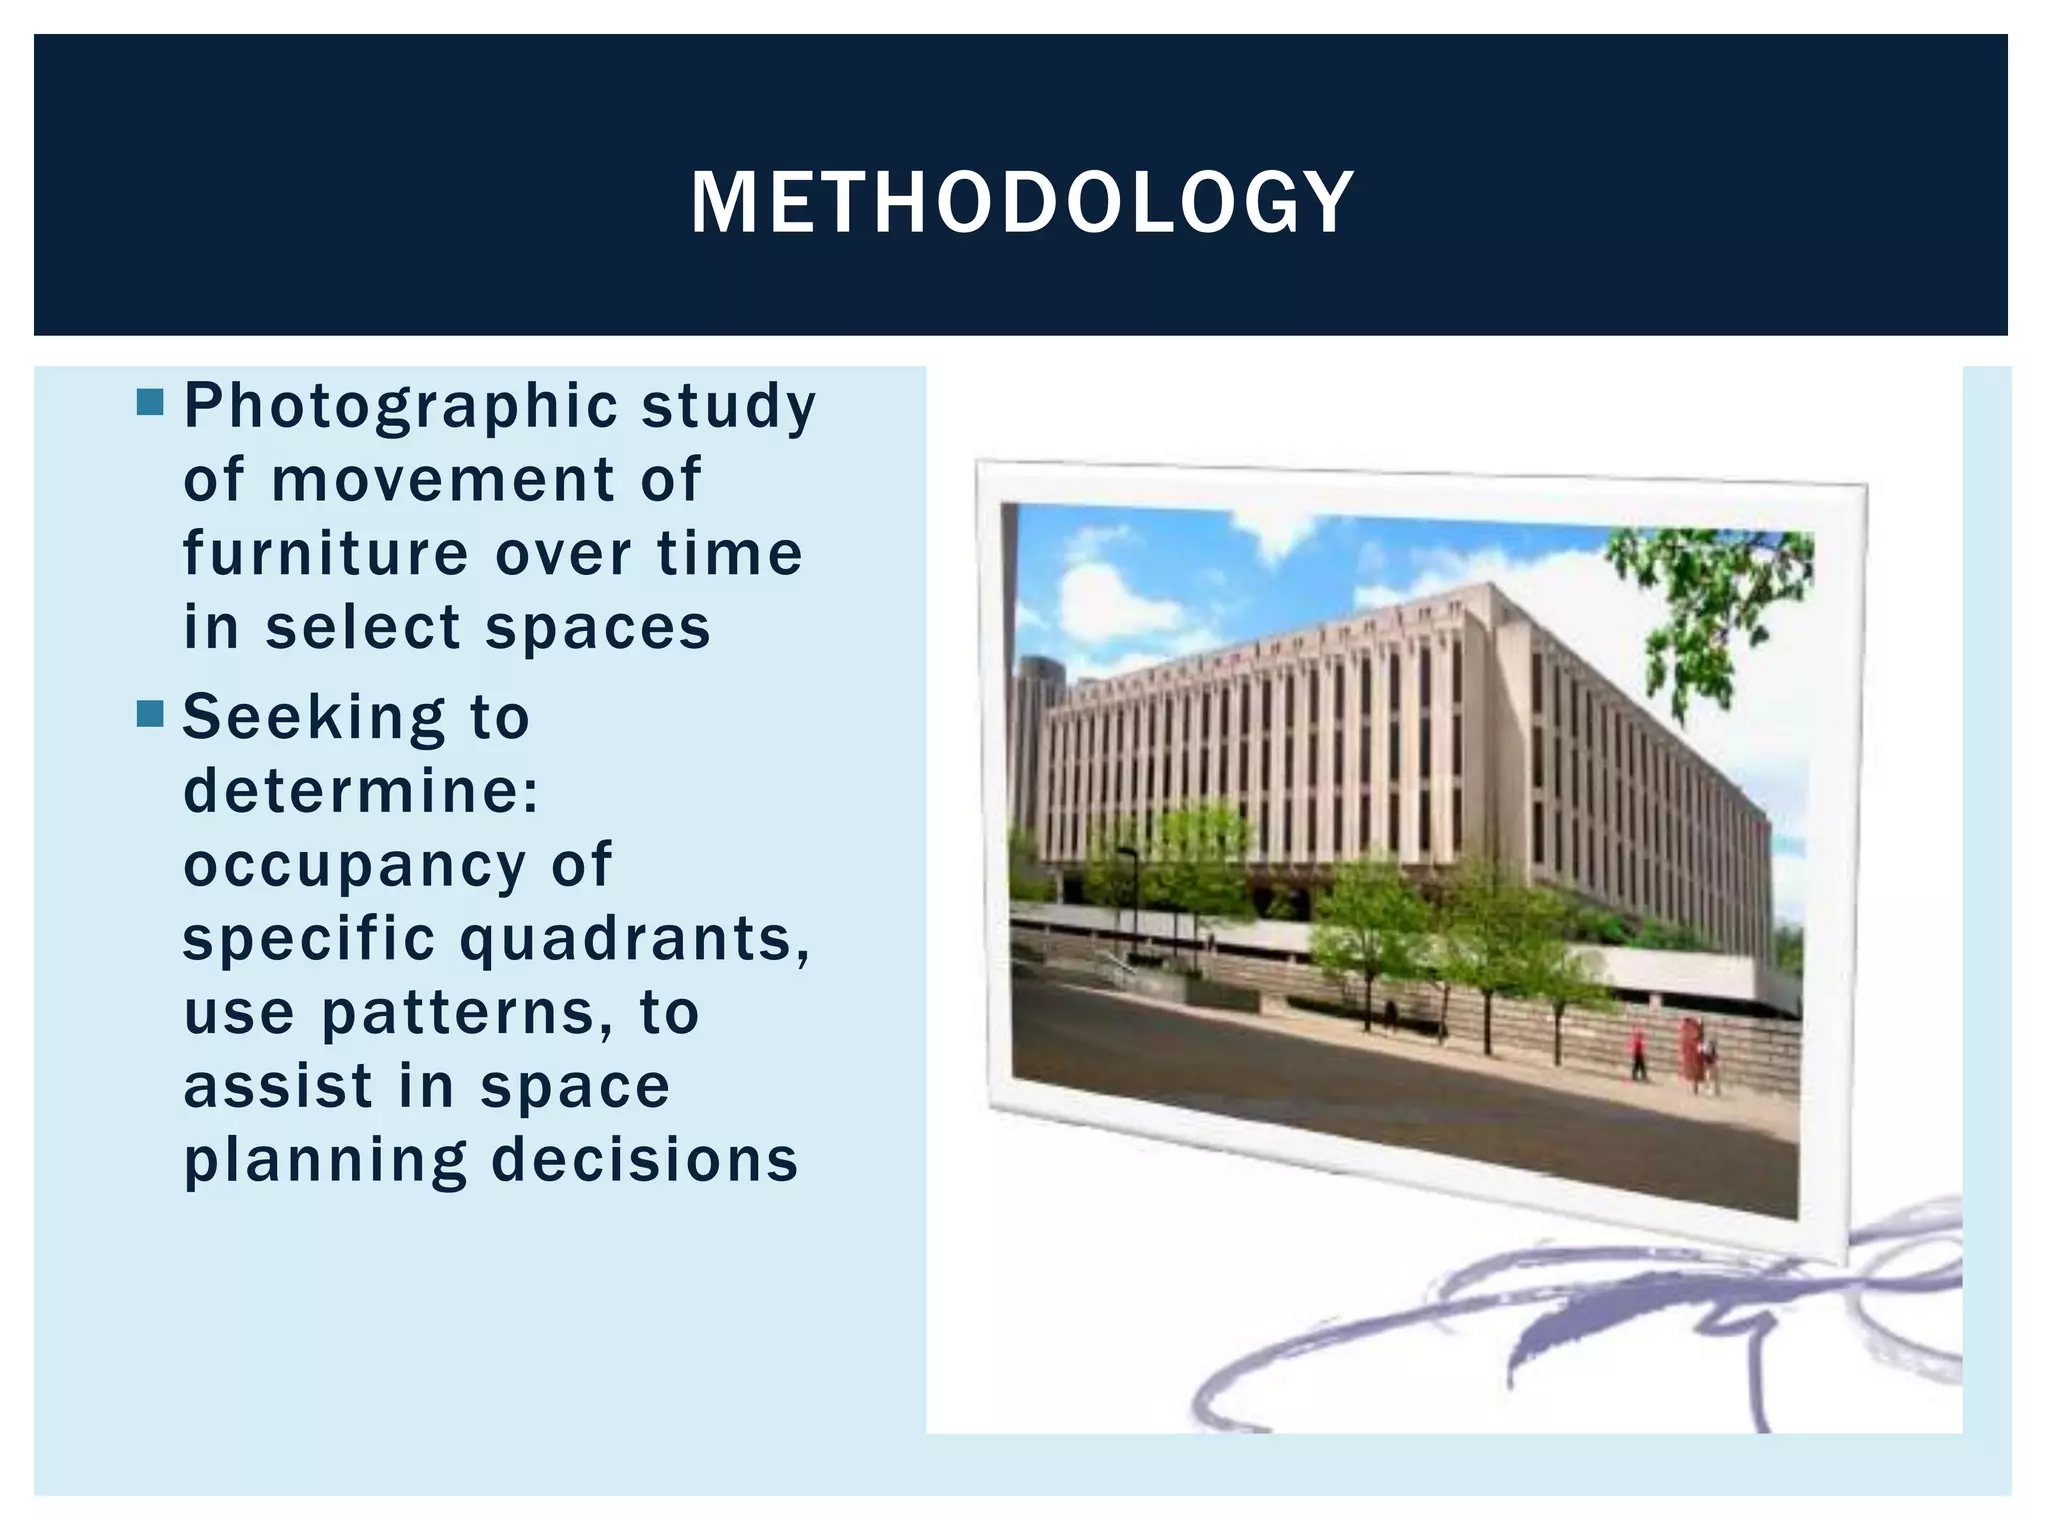
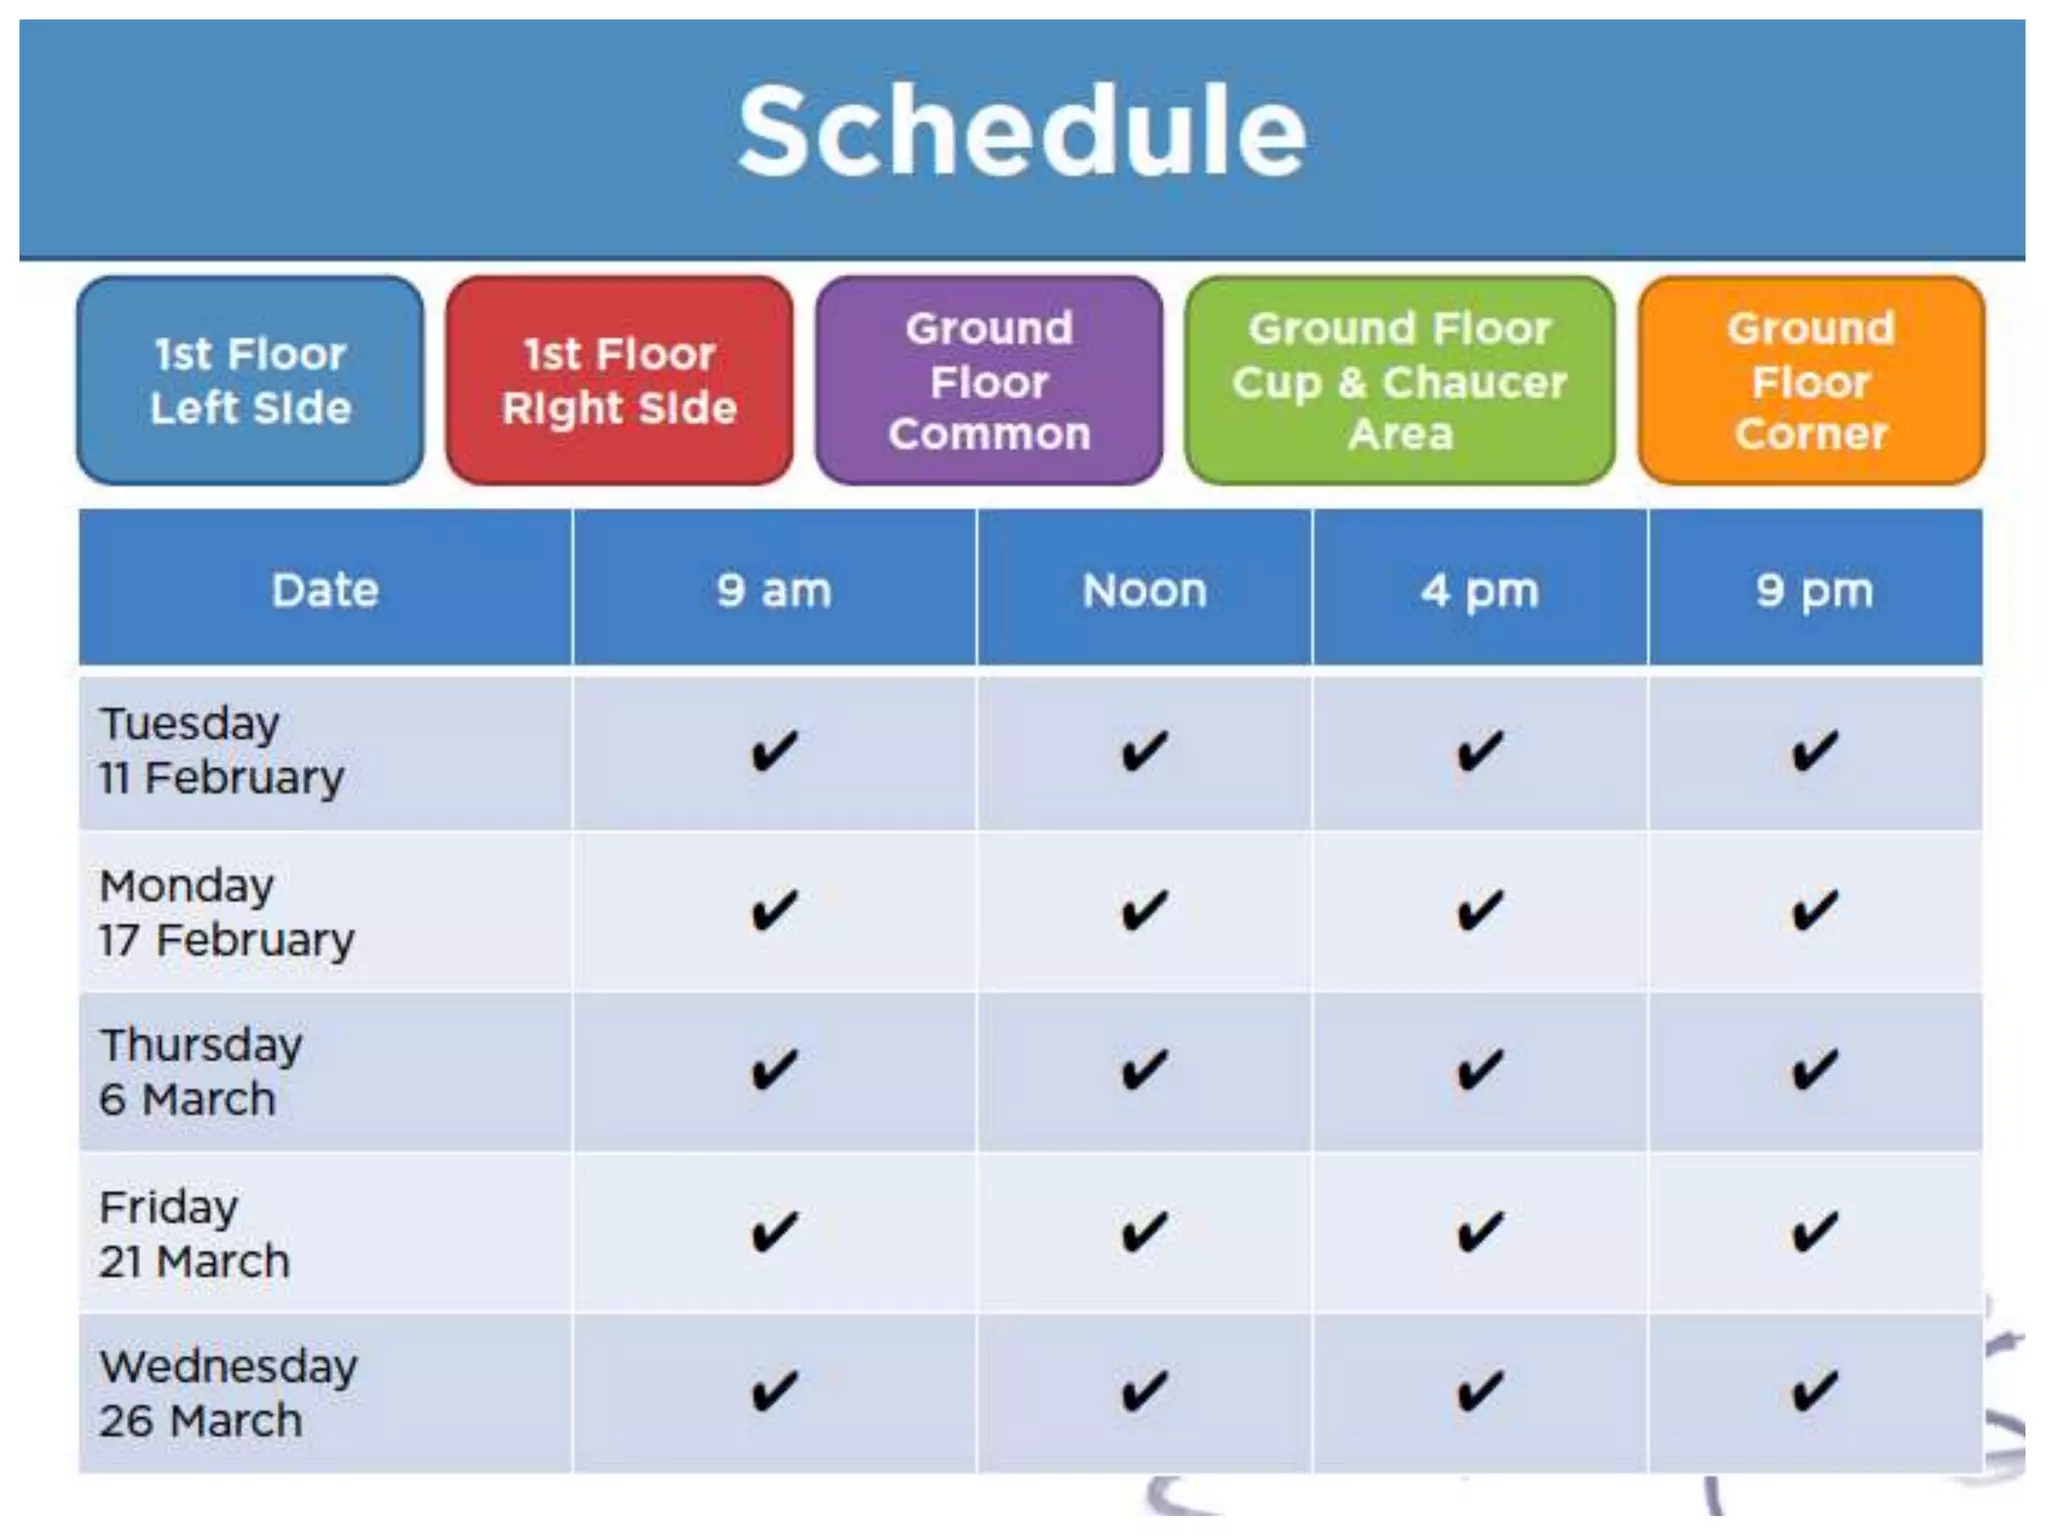
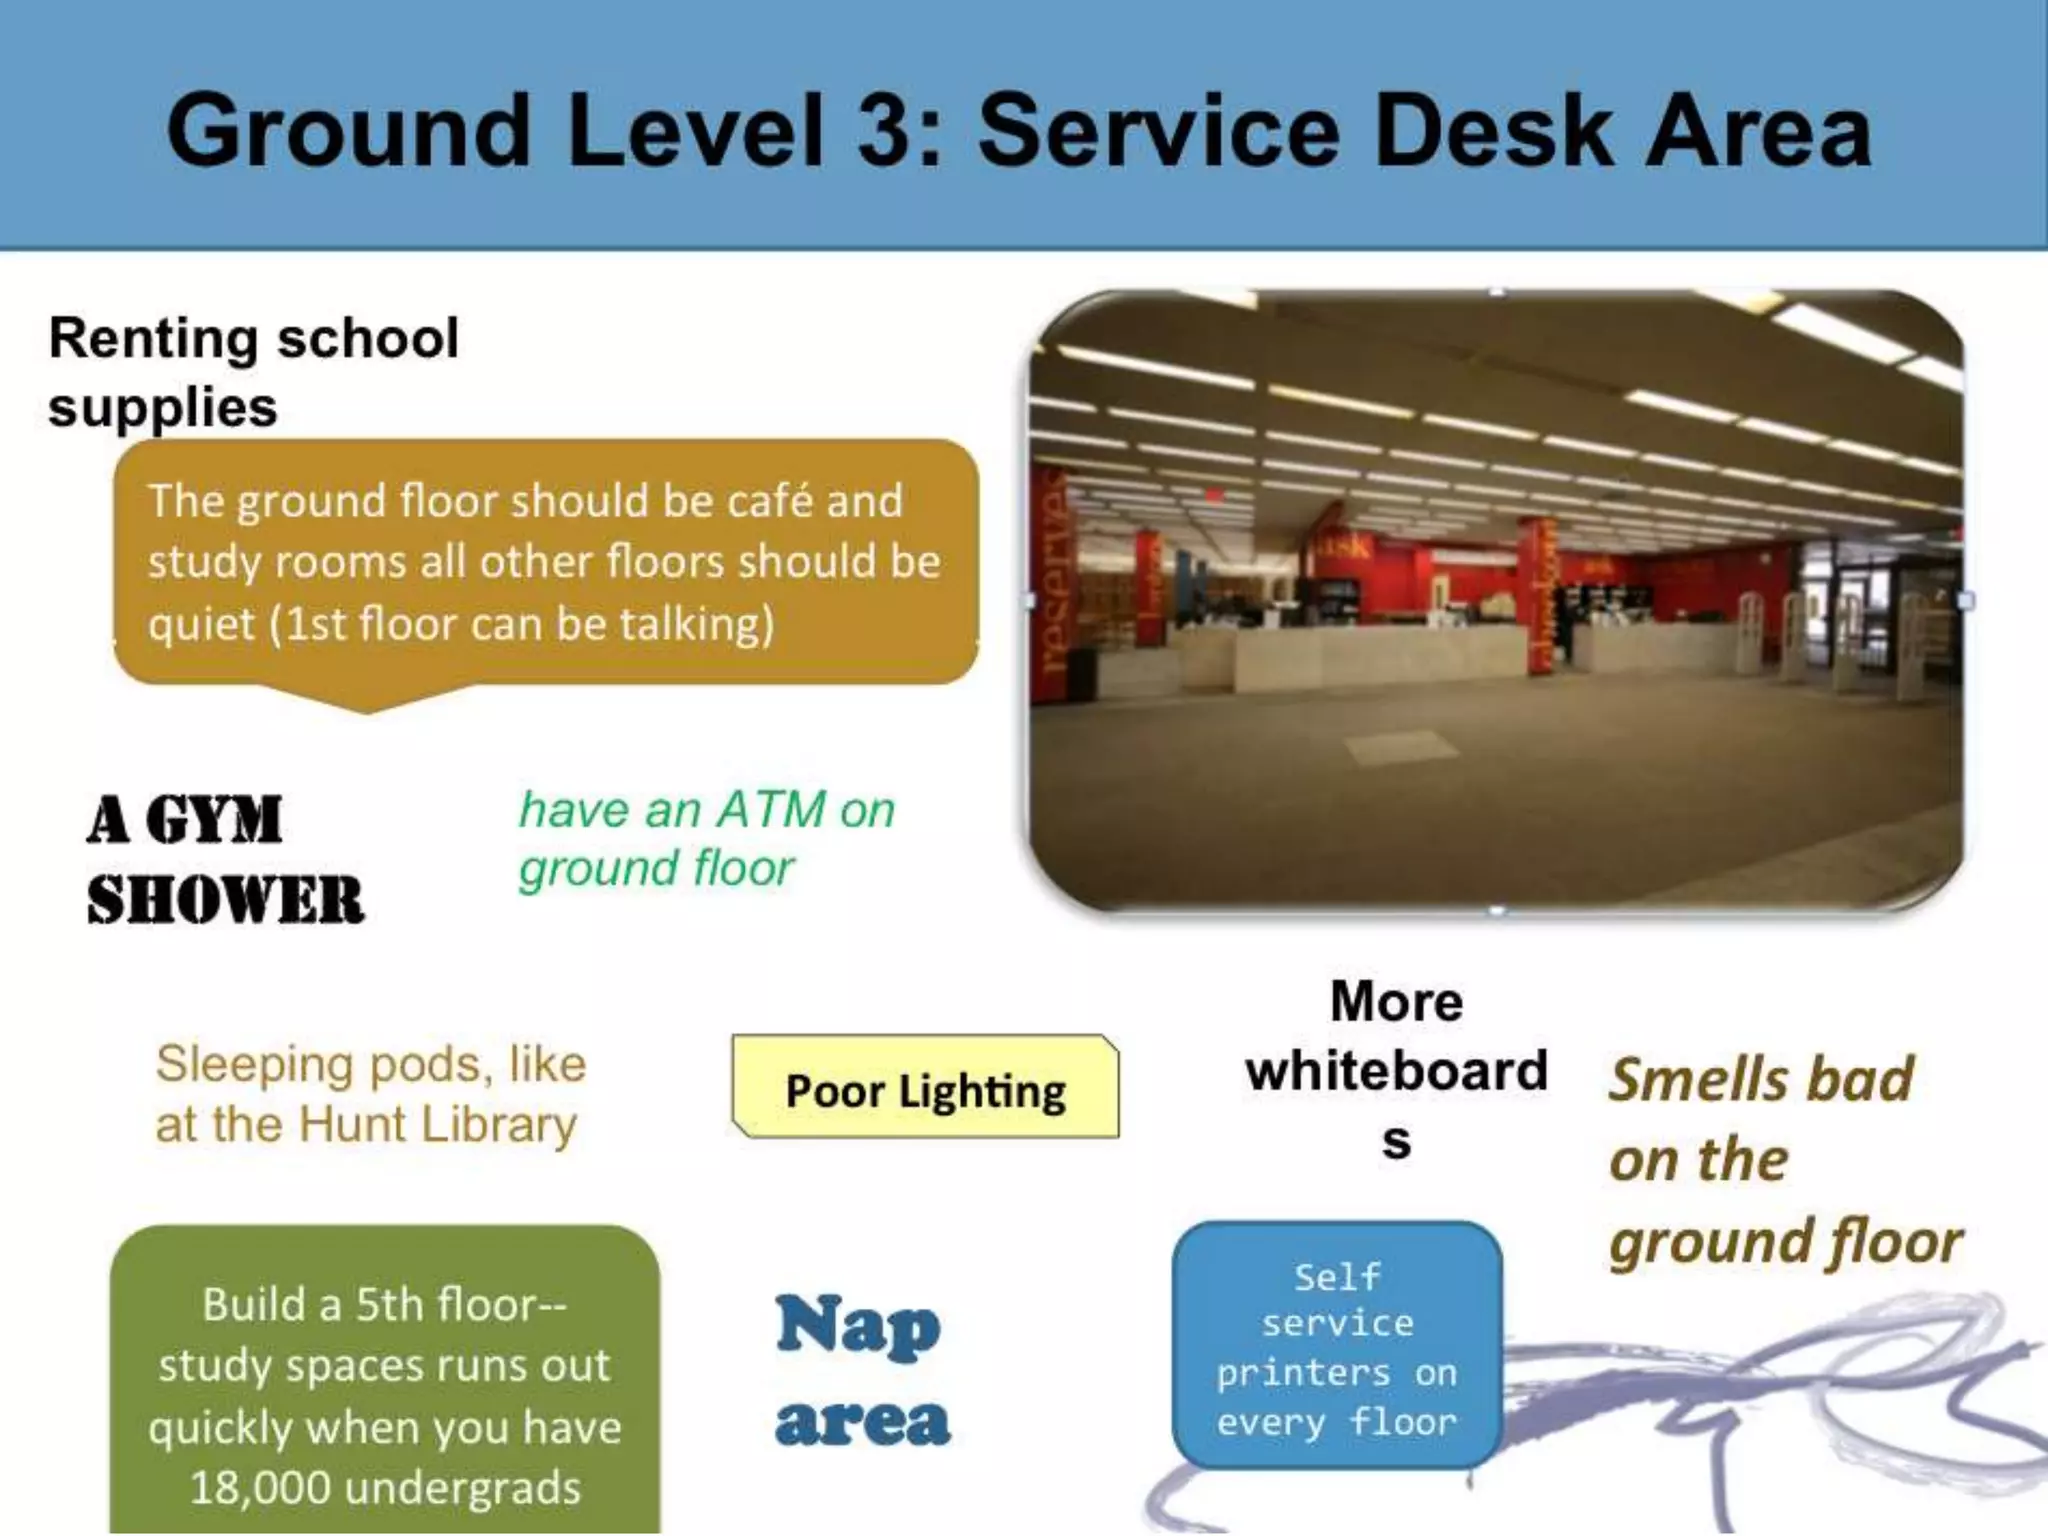
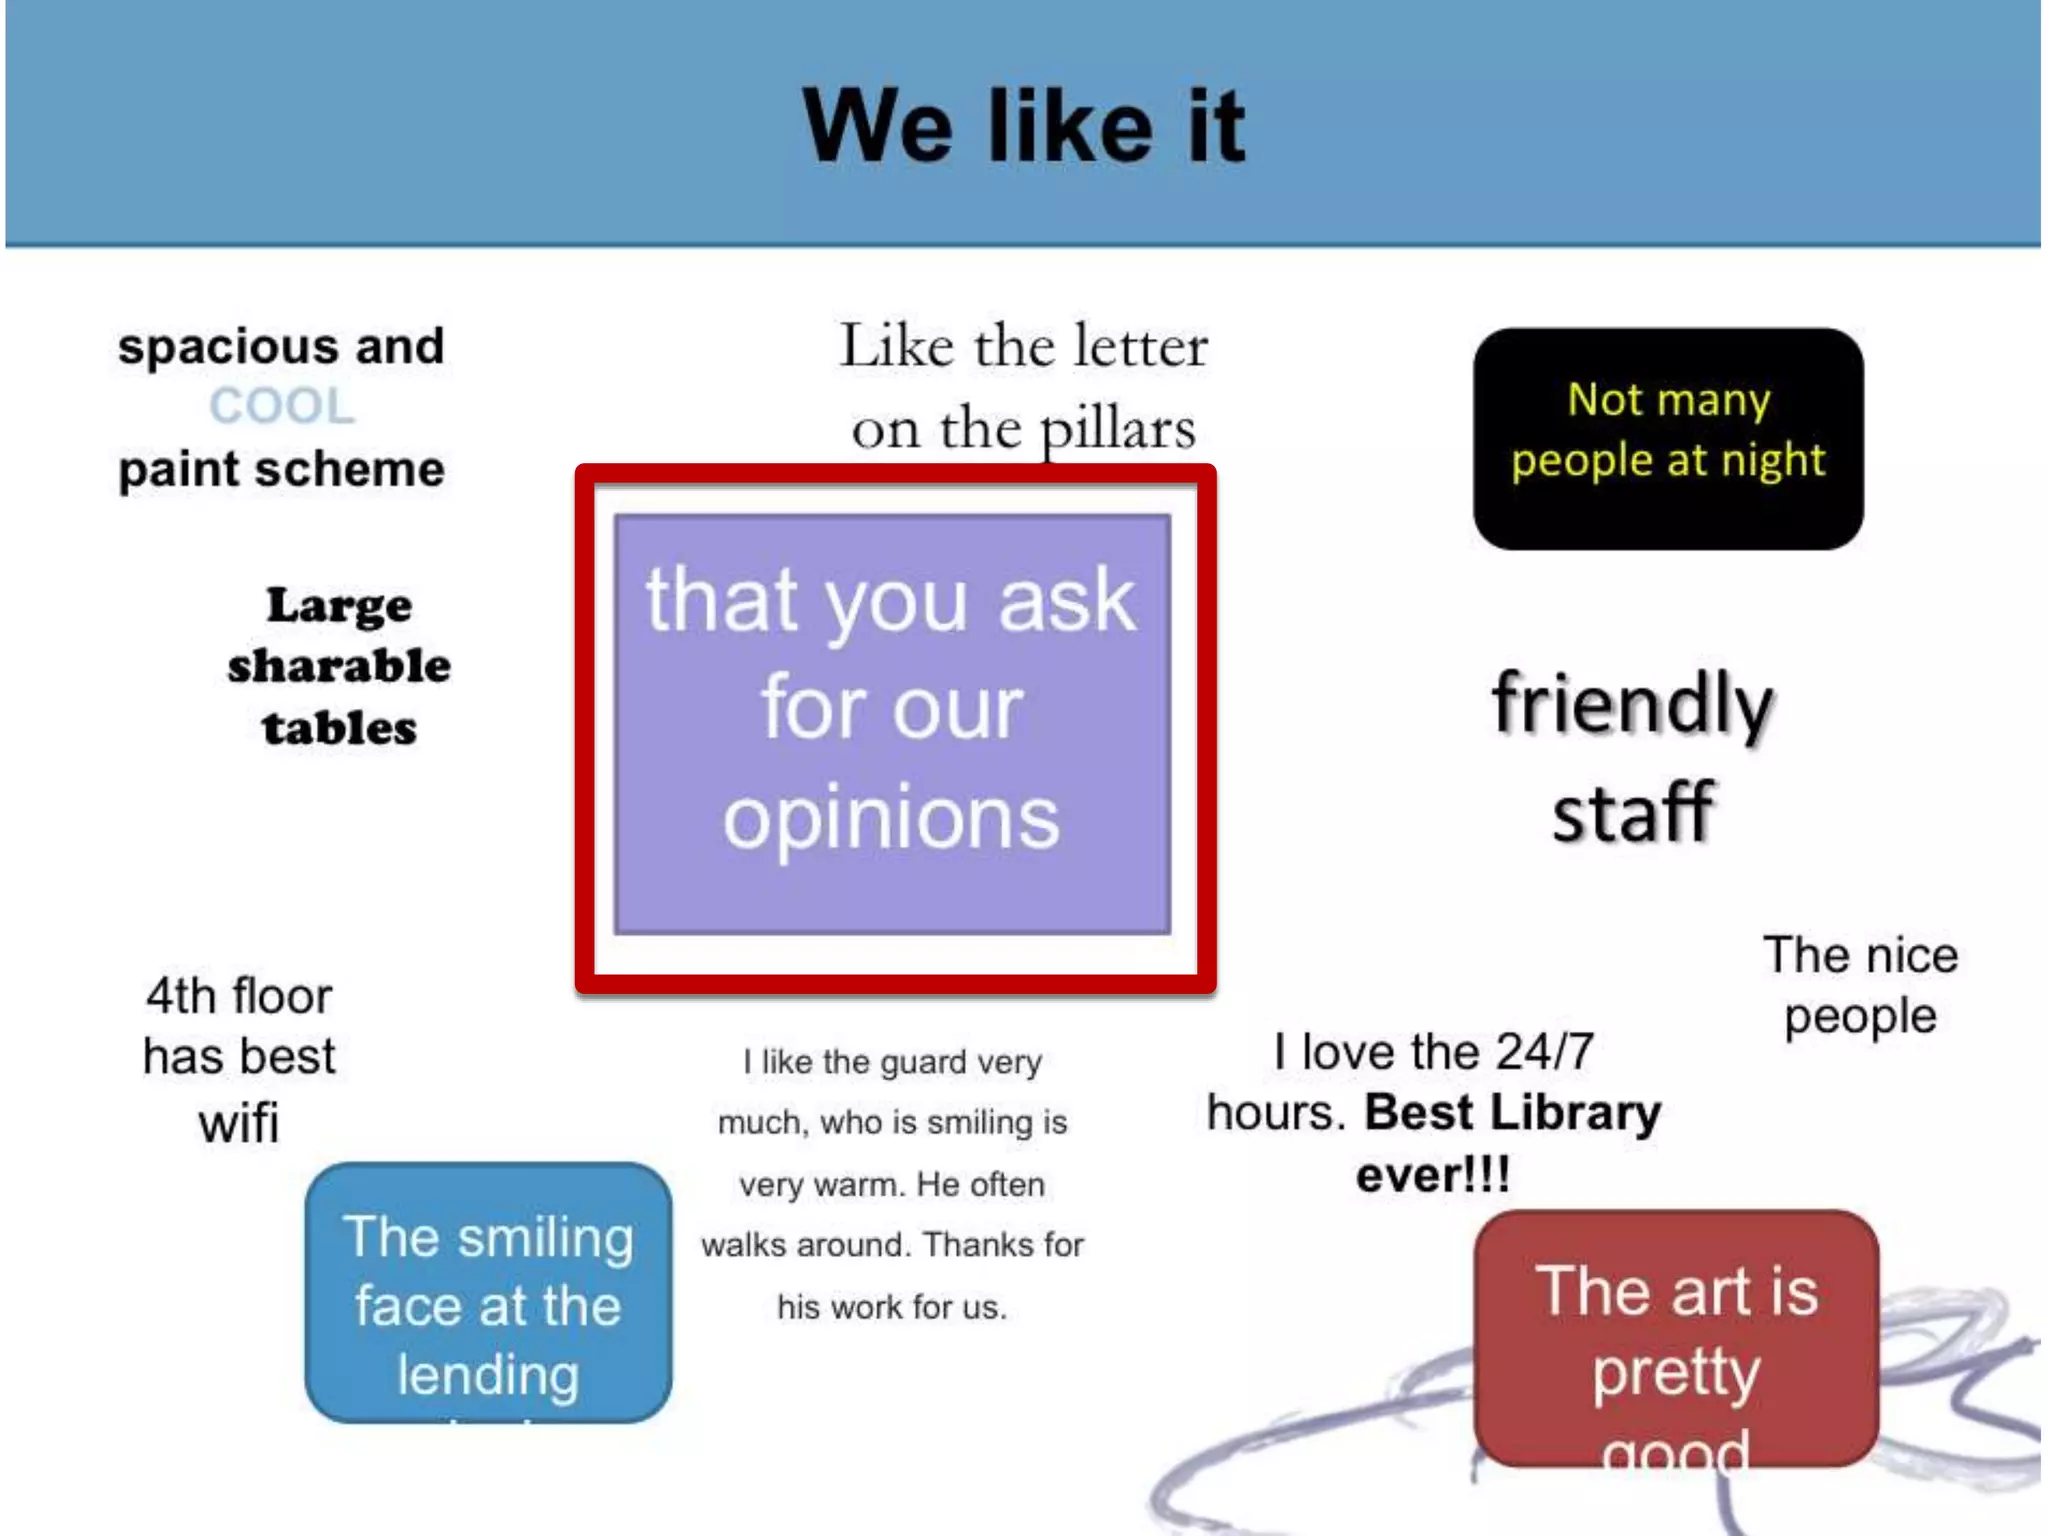
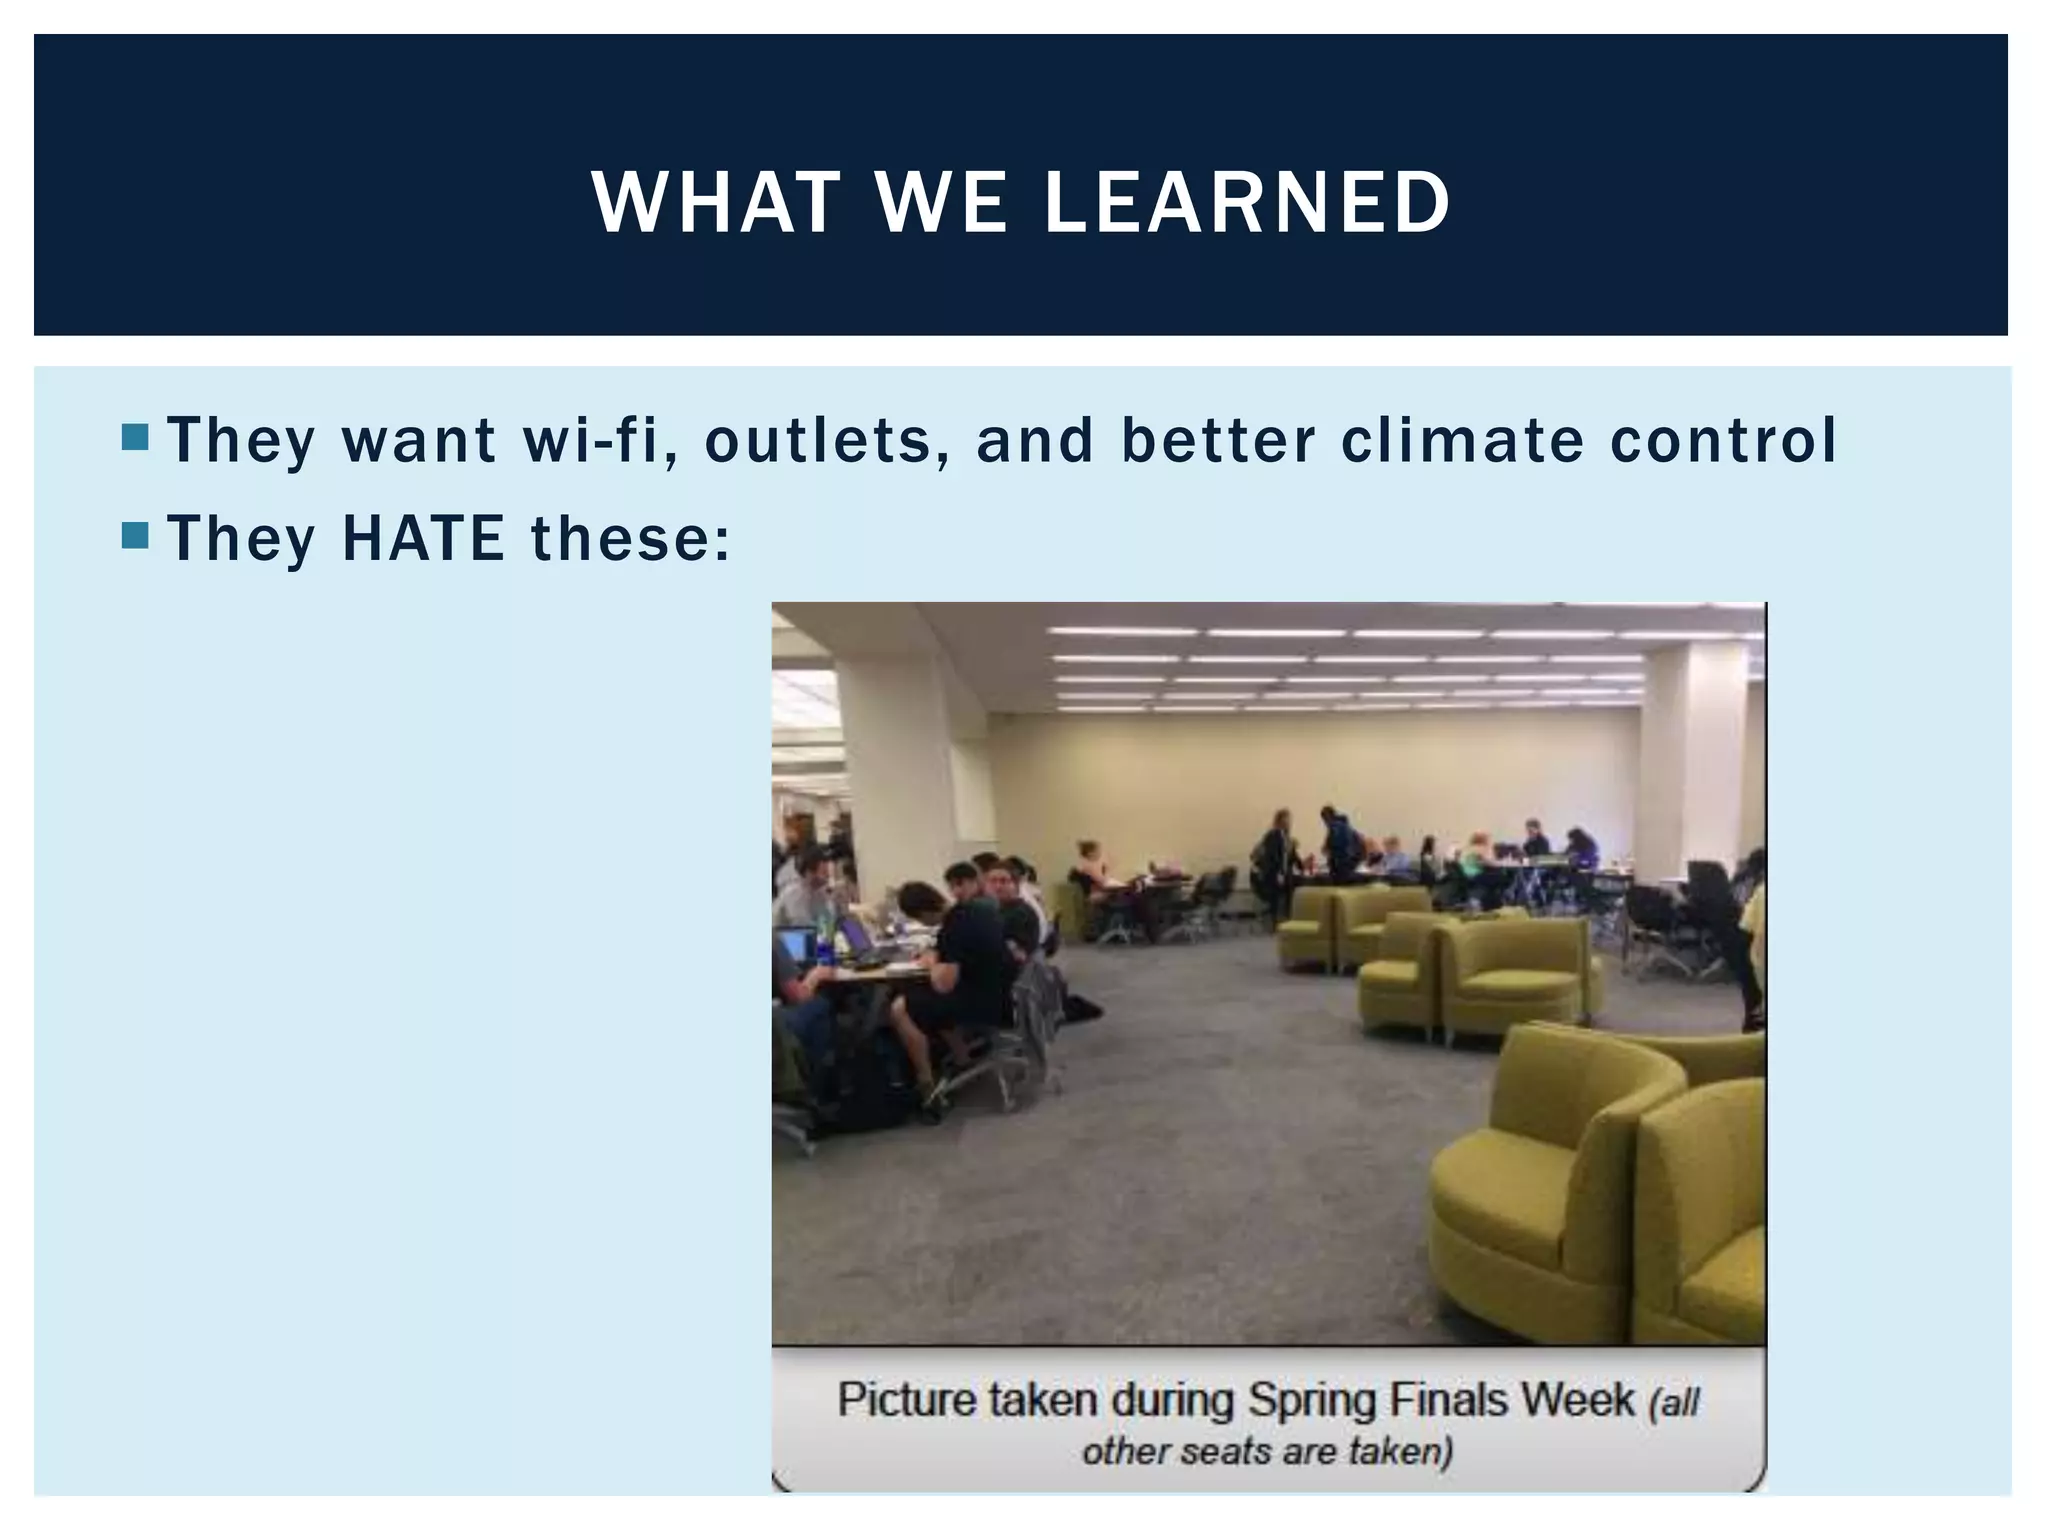
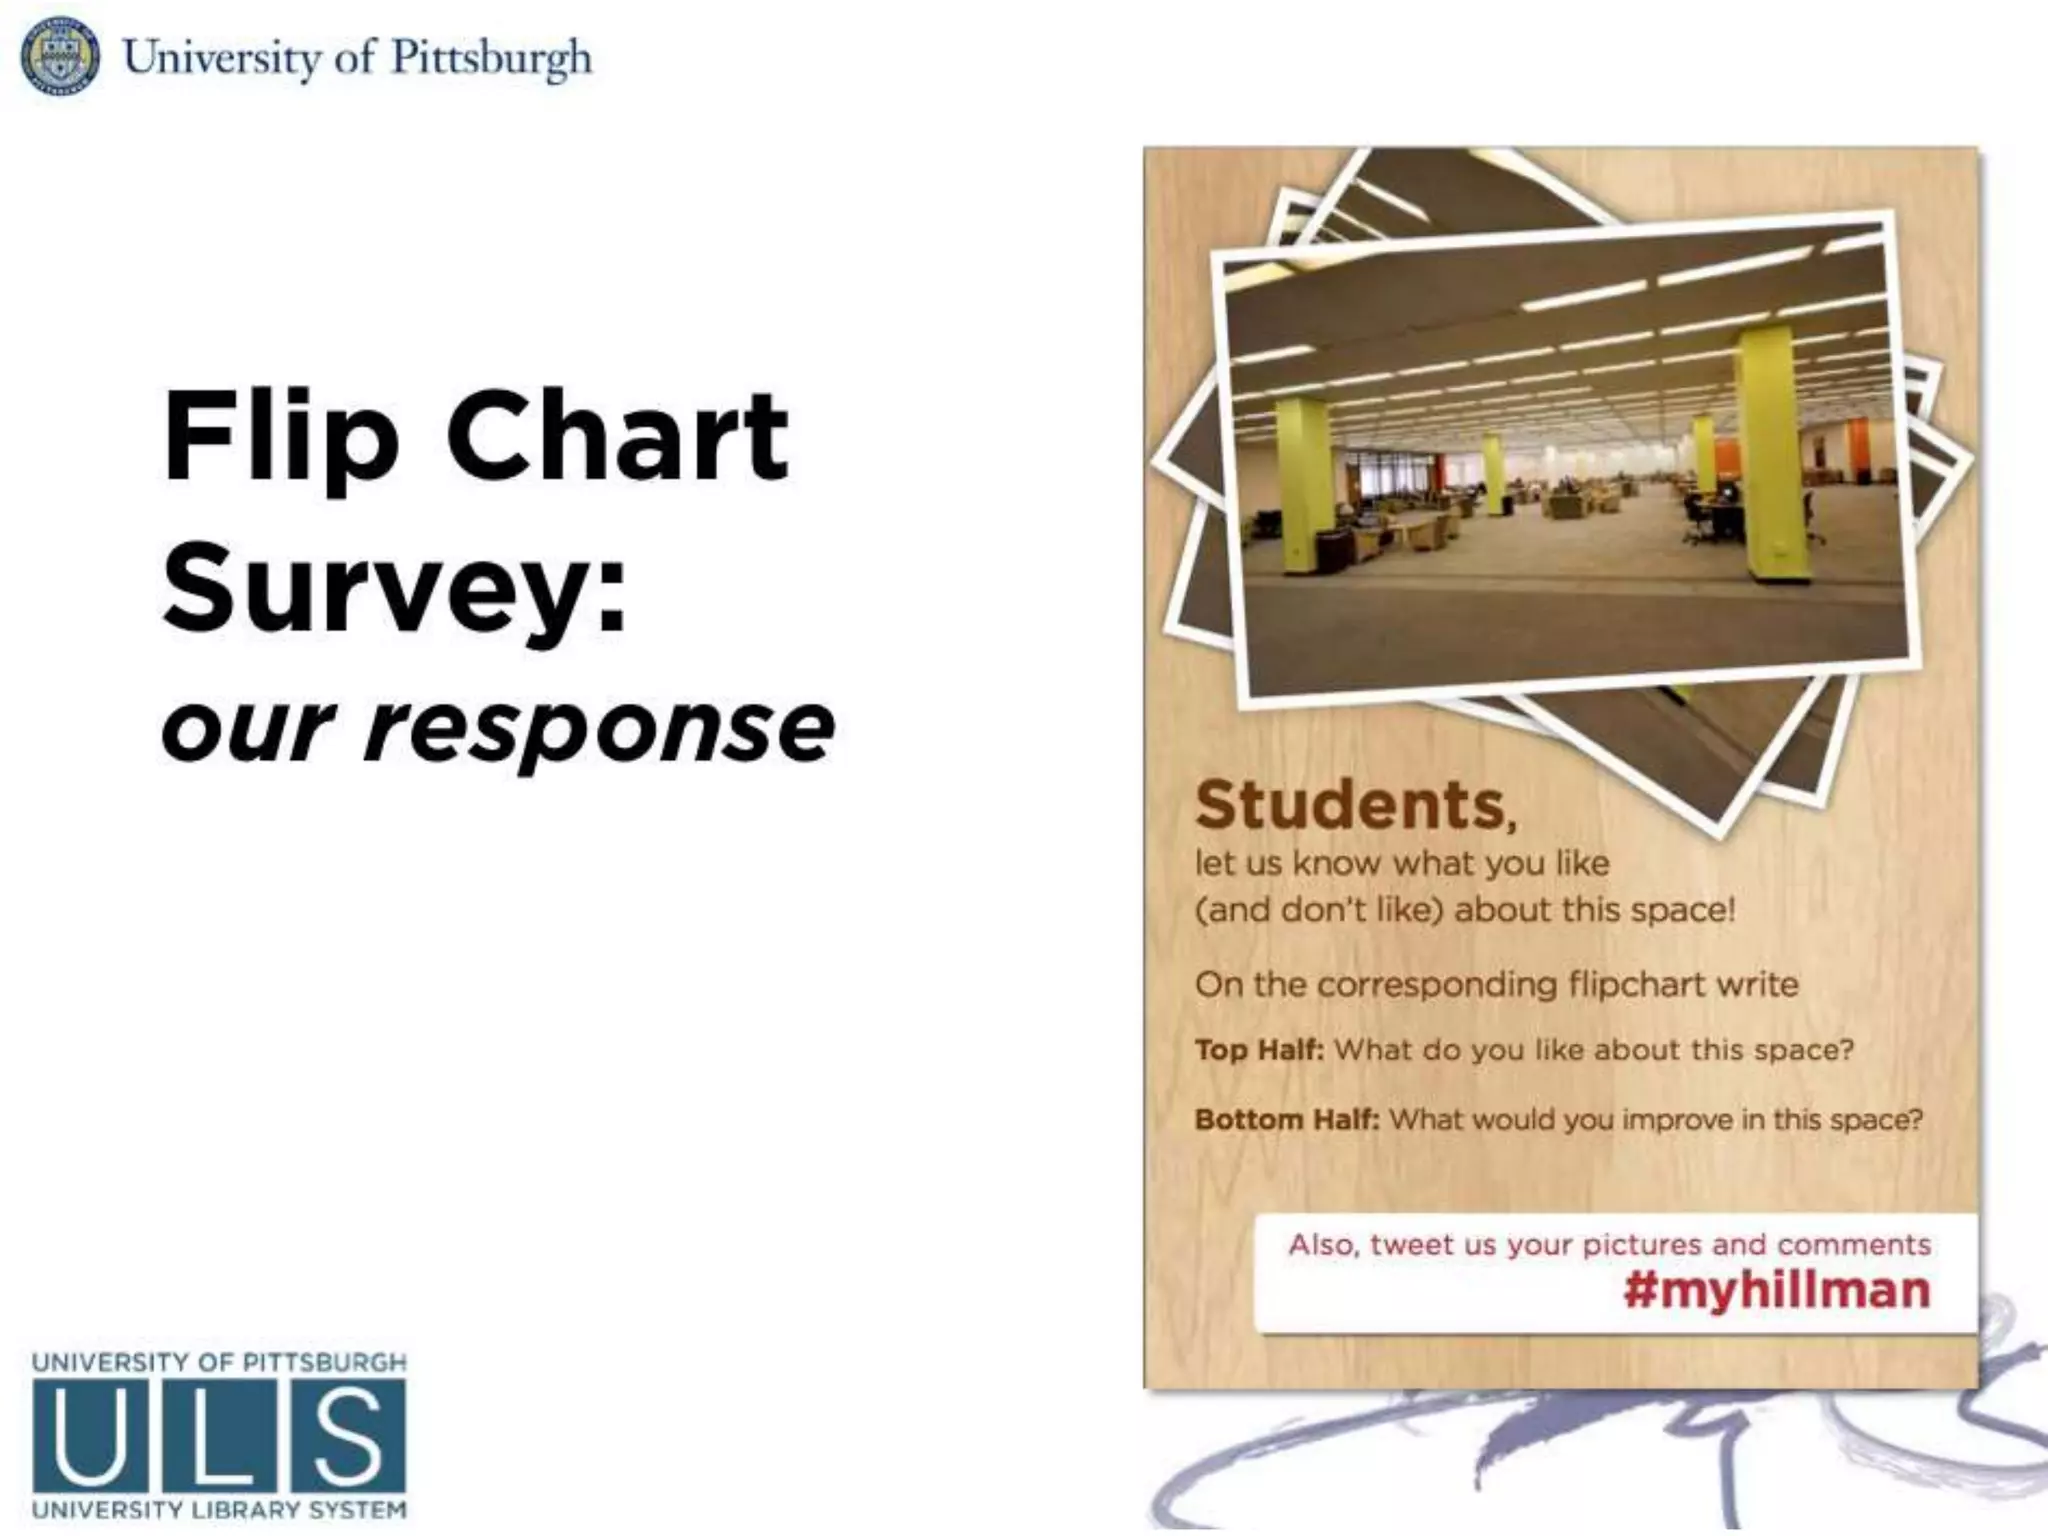
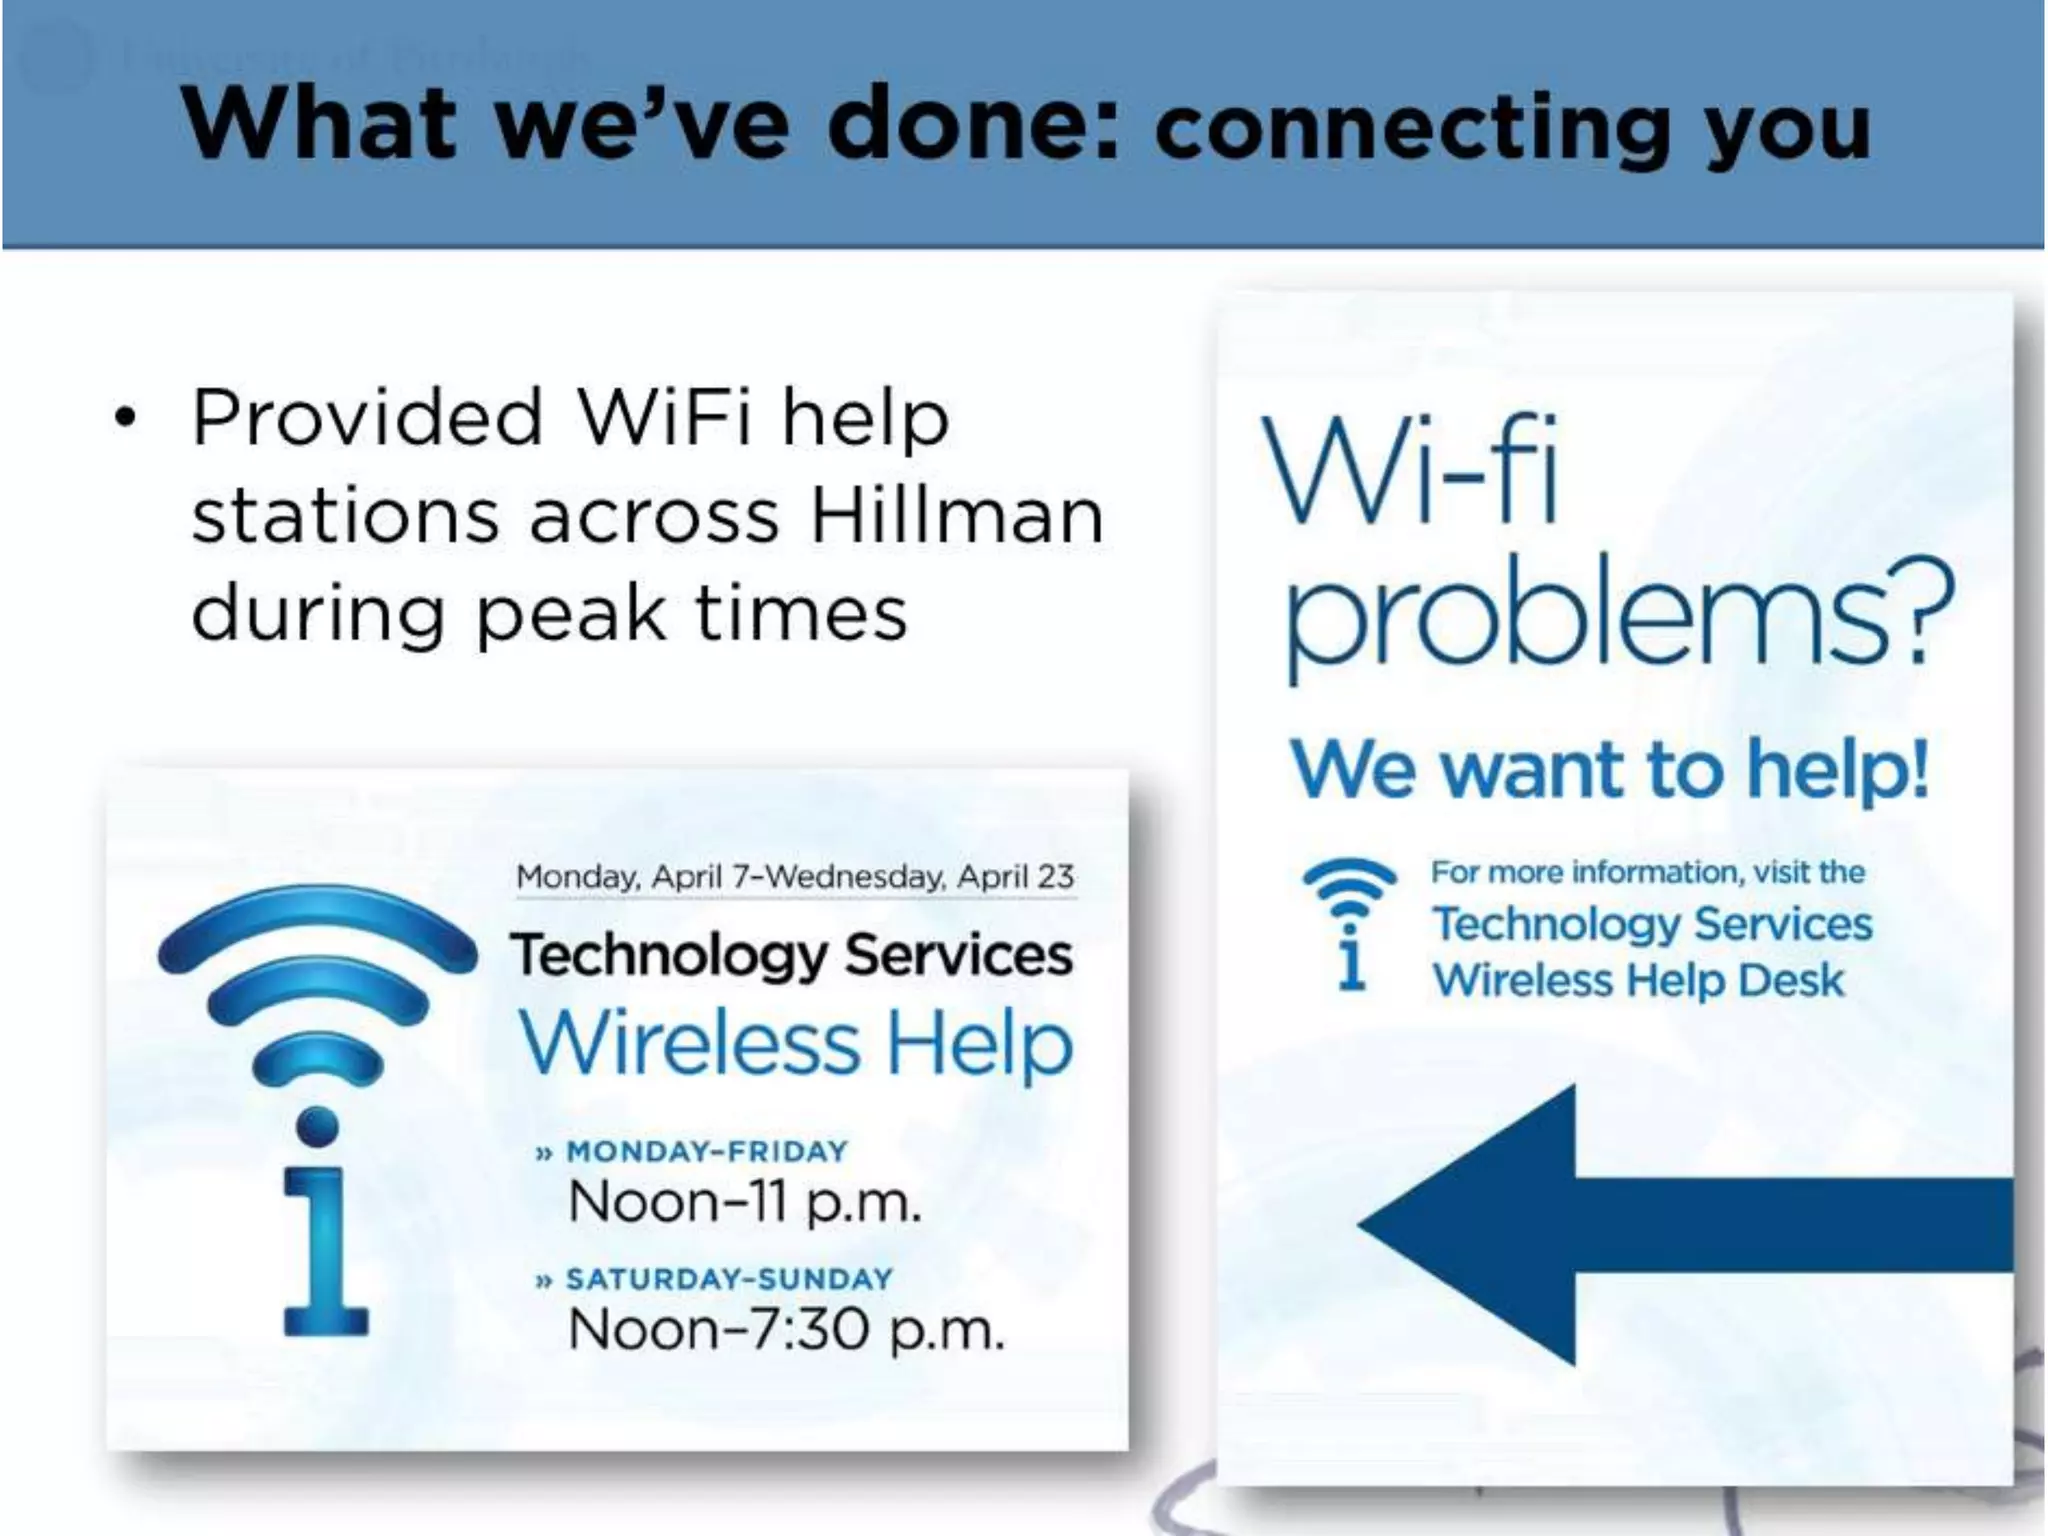

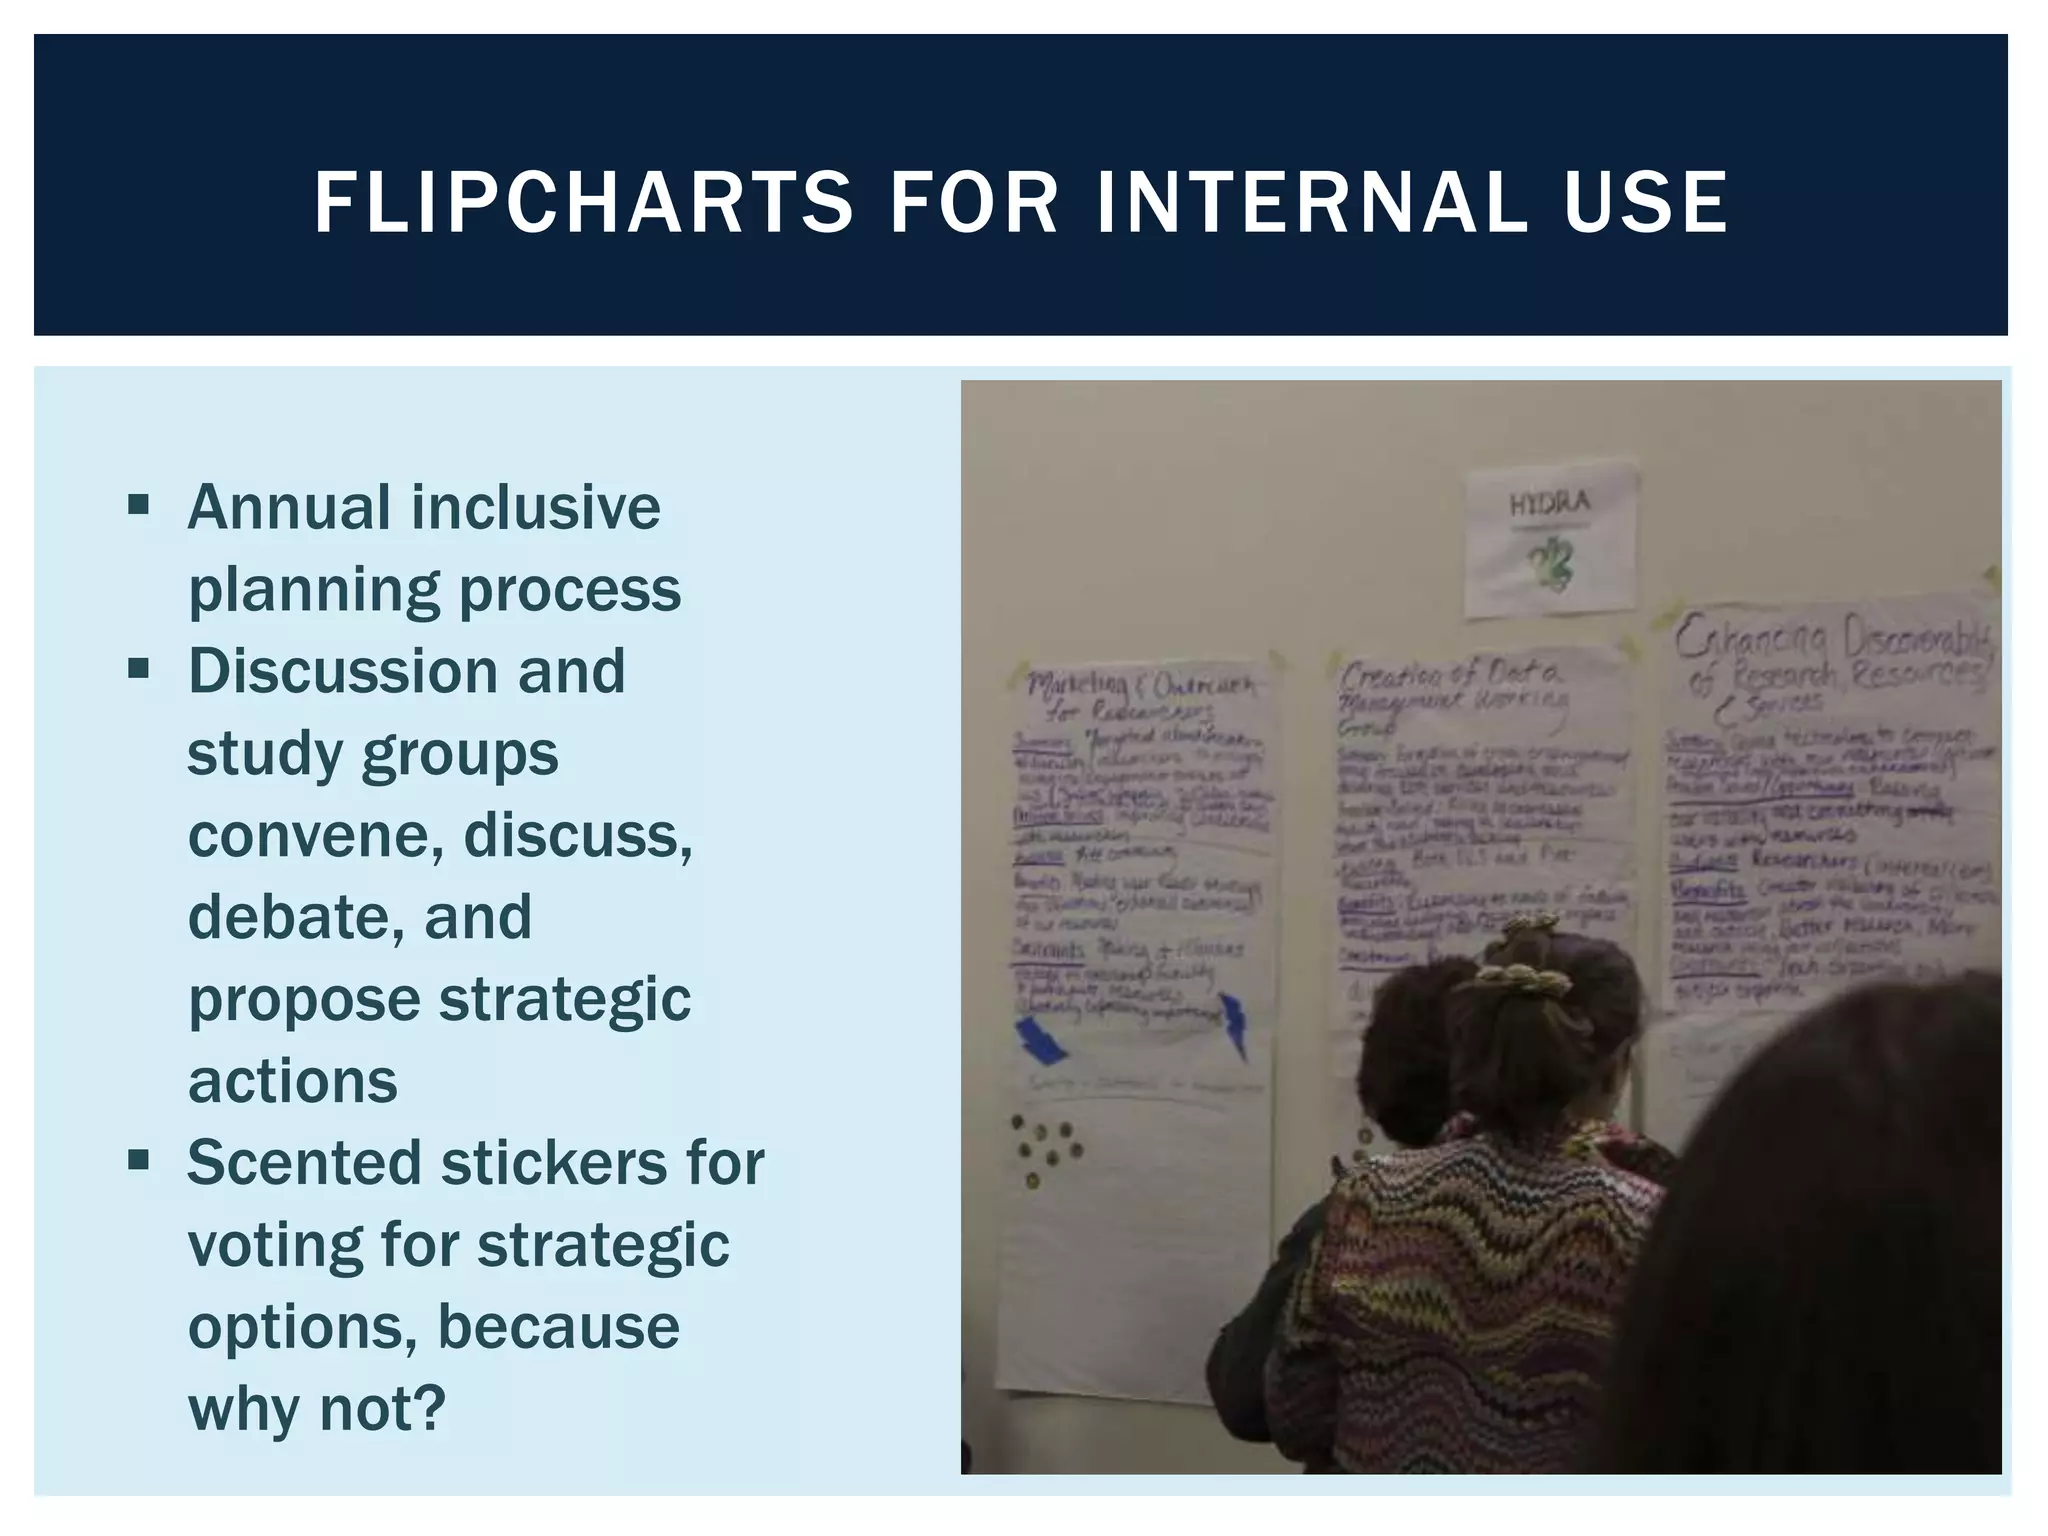
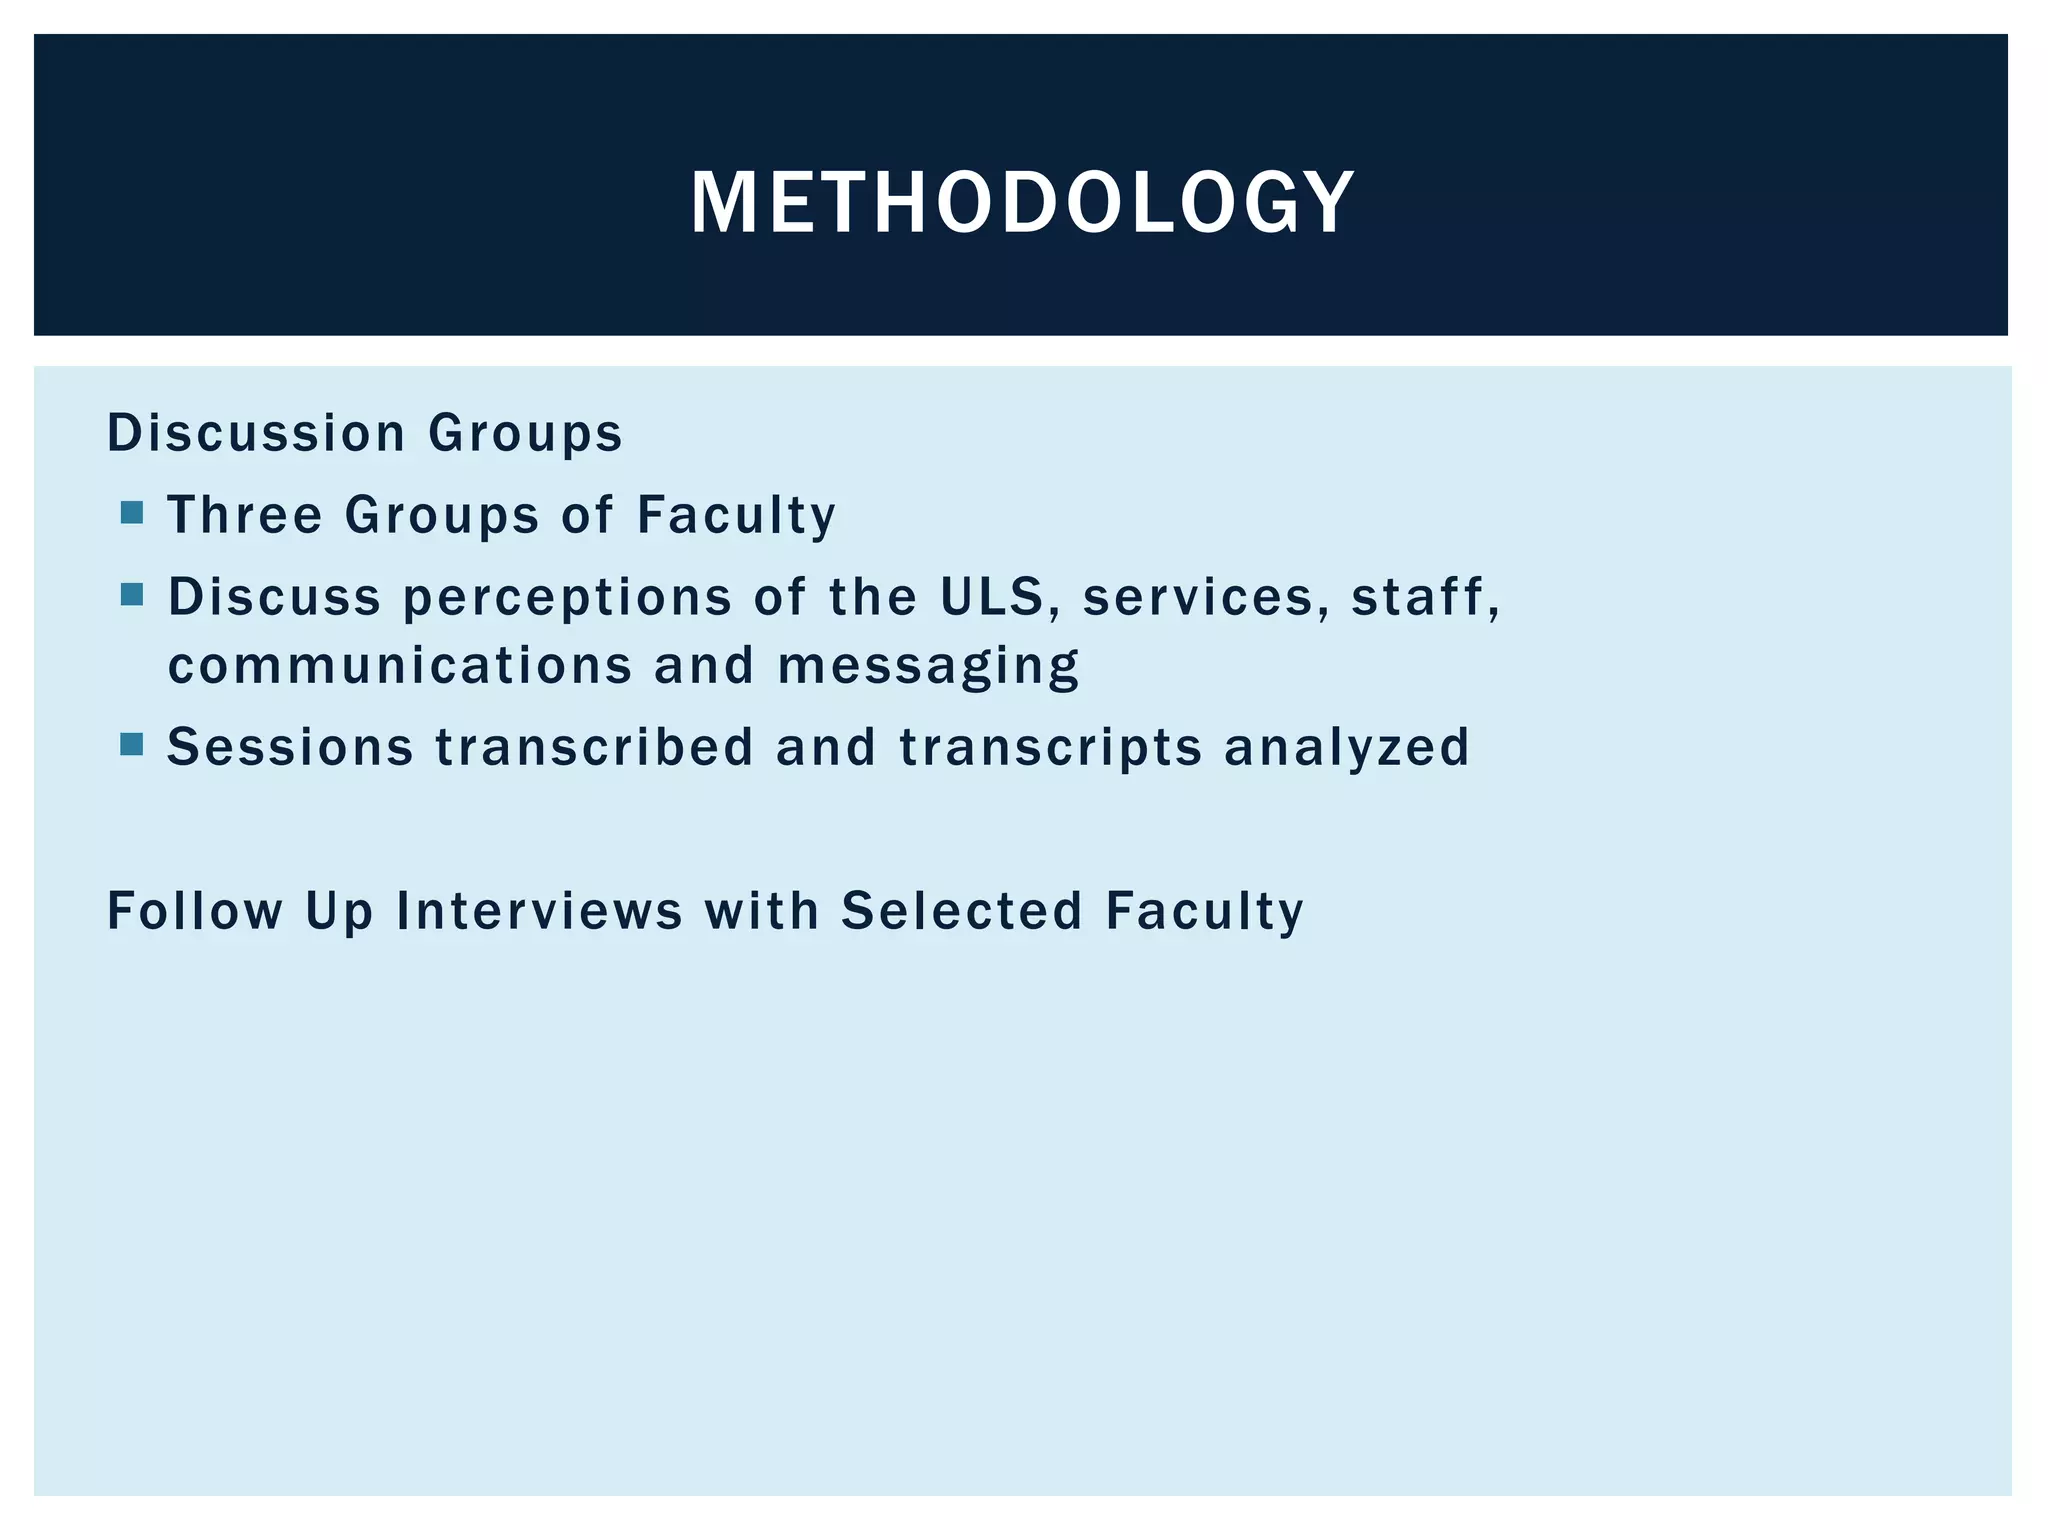
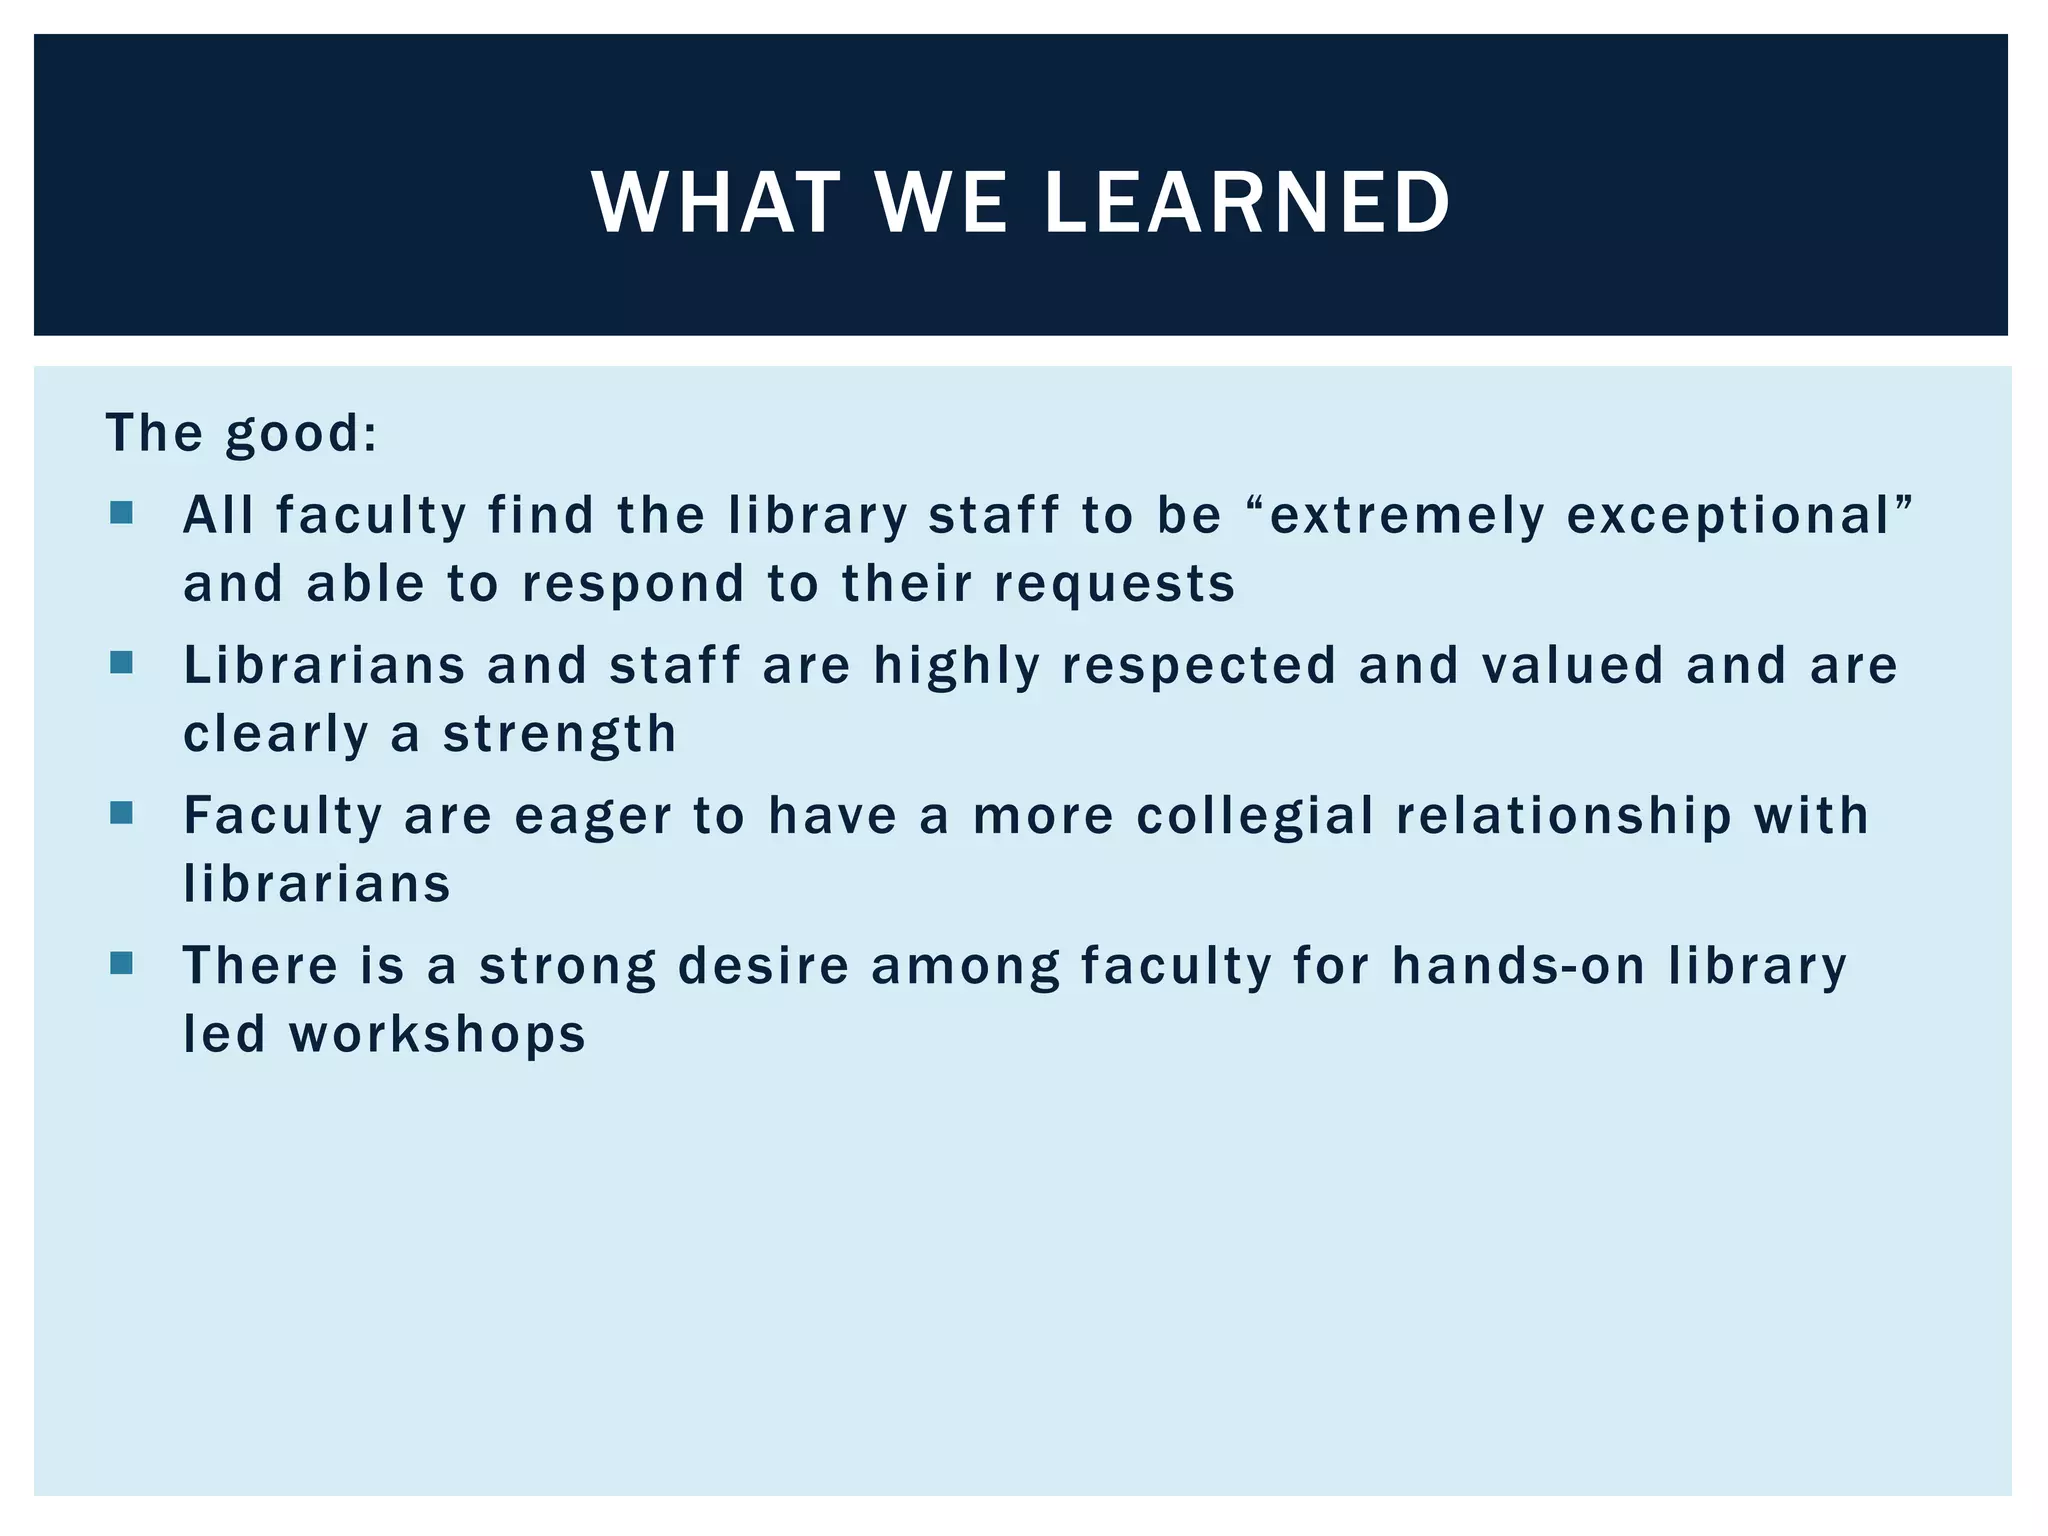


The document discusses various methodologies for gathering user feedback at the University of Pittsburgh's library, including surveys, observational studies, and discussion groups. Key findings indicate that while users appreciate the library's staff and social atmosphere, there are requests for improved facilities, such as more power outlets and better Wi-Fi. The document emphasizes the importance of engaging users to enhance library services and adapt to their needs.


