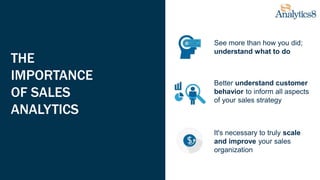
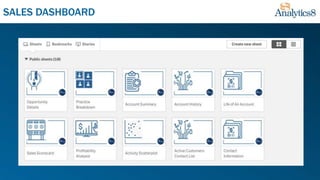
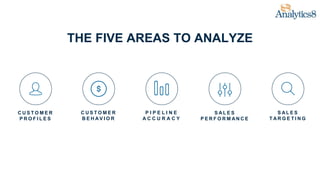
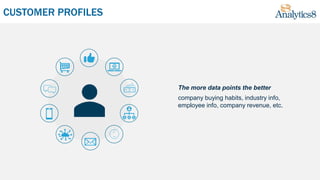
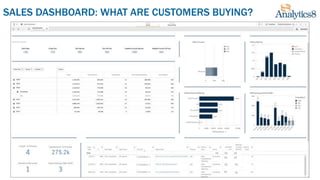
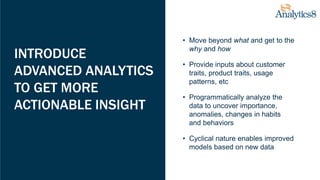
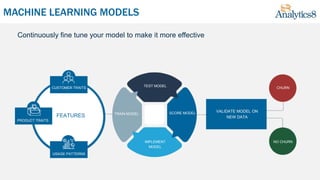
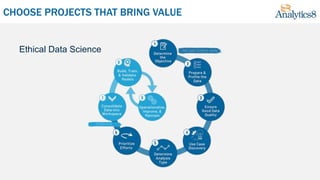
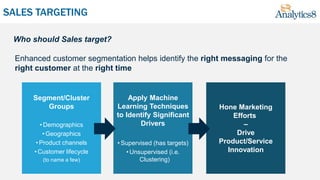
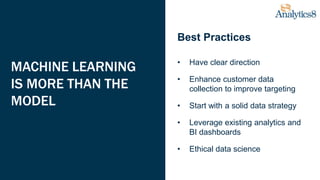
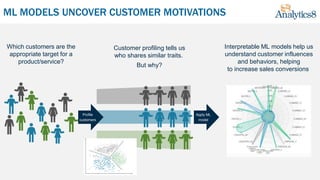
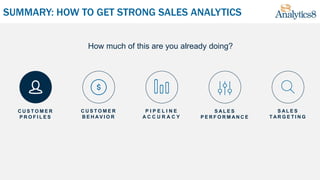
This document discusses how companies can leverage sales analytics to improve business performance. It recommends analyzing five key areas: sales pipeline accuracy, sales performance, customer profiles, customer behavior, and sales targeting. Advanced analytical techniques like machine learning can provide deeper insights into customer motivations and traits to better inform sales strategies. Maintaining a data-driven approach that prioritizes ethics can help companies enhance customer segmentation and identify the best prospects to target.
The demand for BI continues to grow, and while there's no question that analytics brings value, there is often uncertainty about how BI initiatives will deliver bottom-line benefits. Your business case for BI should prove ROI, but this is not always a straightforward process.
Webinar: Develop Workplace Diversity and Inclusion Programs Supported by Data...Analytics8
We believe there are two aspects to achieving workplace diversity, inclusion, and equity: developing smart programs and using data to measure, learn, improve, and hold everyone accountable.
In this webinar with the CEO of Kaleidoscope Group, Doug Harris, we discuss real and actionable diversity and inclusion strategies and how to use data and analytics to ensure their effectiveness.
Data Con LA 2020
Description
The role of Financial Analysts and Accountants is changing due to digitzation. Based on our research through analysis of job advertisements, we reflect the impact on the skill set and requirements of the job market.
*New Role Financial Analyst: How is role changing through new skills needed?
*Digital instruments to steer business: What are new KPIs to steer the business? How can you ensure to focus on value driven business steering?
*Predictive Analytics: How ycan a company use predictive analytics to steeer the business?
*BI and AI: What can we expect and how will Finance 2025 look like?
Speaker
Rafi Wadan, Stargazr, CEO & Co-Founder
How to turn traditional Industrial Companies into Modern, Digital-Data Driven...Data Con LA
Data Con LA 2020
Description
The talk will describe how a $2B traditional, asset and human-capital intensive company which owns and operates a million machines was turned into a modern, digital-data driven company any deploying IoT and advanced analytics. The talk will describe how every aspect of customer/consumer experience and company operations (convenience based use, pricing, optimized service, collections and refunds) was transformed using new data driven tools, visualizations and insights.
Speaker
Sugath Warnakulasuriya, Thalamus Labs, Managing Director
Career Development Programmes for Data Scientists and Data Analysts (for indi...NUS-ISS
Specially designed for future Data Science and Analytics Professionals, this session is for individuals (PMEs) who wish to know more about the Industry Transformation Programme landscape. We provide an overview of all NUS-ISS career development schemes and pathways.
We will also deep dive into the specific programme modules in detail. Be guided through frequently asked questions related to the programmes and get your questions answered at our Q&A session.
Learn how you can drive your business forward with confidence by making decisions based on actionable insights gained from organizational data in real-time.
Being Right Starts By Knowing You're WrongData Con LA
Data Con LA 2020
Description
The recent proliferation of predictive analytics within companies is of limited benefit unless these companies learn to measure, understand, and embrace a critical concept: error. There is no such thing as a perfect predictive model and all tools using any sort of predictive model will have error. Despite being relatively easy to implement and understand, consistent error measurement continues to be underutilized or even completely avoided. In this session we will discuss
*Why embracing error is so valuable to companies.
*We will then review basic ways to measure error in commonly used models and in data source systems such as CRMs and ERPs.
*Most importantly, we will review some ways to approach company leadership with the concept of error.
Speaker
Ryan Johnson, GoGuardian, Director of Science and Analytics
Customer Intimacy is one of 3 value propositions that define company strategy. These slides tell more about how it's implemented in Data Science outsourcing projects.
Kickstart a Data Quality Strategy to Build Trust in Your DataPrecisely
The success or failure of your data-driven business initiatives relies on your ability to trust your data. But as data volumes grow, it becomes a major challenge to understand, measure, monitor, cleanse, and govern all that data. Join this on-demand session to learn key metrics and steps you can take to kickstart a data quality strategy.
Your smarter data analytics strategy - Social Media Strategies Summit (SMSS) ...Clark Boyd
The volume and velocity of available data brings with it a huge amount of new opportunities for marketers. However, without the analytics know-how to avail of this data, these are opportunities that are often missed. Moreover, the variety of different data sources and analytics platforms only add to this complexity.
This presentation covers:
- How to define and communicate an analytics framework
- How to set up analytics dashboards for a range of stakeholders
- The people and skills you need for an optimal analytics team
- Practical tips for improving your campaign measurement
A contact center enables agents to communicate with consumers via various communication channels. Businesses should carefully decide the bundle of the channels for the success of operations. Here are the factors to consider to choose the channels for your contact center.
"Planning Your Analytics Implementation" by Bachtiar Rifai (Kofera Technology)Tech in Asia ID
Bachtiar is a tech startup & science enthusiast with more than 7 years experience in digital marketing, ecommerce, analytics and product development. Bachtiar has spend his career life as marketing leader at top ecommerce such as Lazada & Blanja.com. Currently Bachtiar develop a startup called Kofera, a technology company who provides Software as a Service (SaaS) marketing automation platform powered by Artificial Intelligence (AI) and machine learning. Established in 2016, Kofera helps companies build & optimize PPC campaign using machine learning algorithm to maximize business ROI. Kofera has helped many clients from various industries. Recently, Kofera received pra-series A funding lead by MDI Ventures and followed by Indosterling, DNC & Gunung Sewu.
***
This slide was shared at Tech in Asia Product Development Conference 2017 (PDC'17) on 9-10 August 2017.
Get more insightful updates from TIA by subscribing techin.asia/updateselalu
Business Intelligence (BI) technologies are applied by Charter Global to interpret and manage large amounts of unstructured data to help your company evaluate and develop new strategic business opportunities.
We're building an on-demand workforce for digital tasks. Our goal: Create 25,000 sustainable freelance opportunities in emerging markets by 2020! Learn more on www.tasko.co.
Stay Agile and Competitive with Supplier DiversityScout RFP
Join this this session and hear from Nimfa Delos Santos, Manager of Travel and Purchasing at Zappos,
Linda Chuan, co-founder of Silicon Valley Sourcing Leaders, and Kathleen Wong, Program Manager, Supplier Corporate Responsibility at Adobe, on how their innovative companies have improved business performance with a
focused approach to supplier diversity.
A comprehensive Power point slide on Digital strategy and planning covering topics like Budget Forecasting, Data Visualization, Benchmarking, SWOT Analysis, KPIs and Analytics.
Data-Driven Dynamics Leveraging Analytics for Business GrowthBryce Tychsen
Explore the dynamic landscape of data-driven growth and learn how analytics can propel businesses to success. Discover strategies, tools, and best practices for harnessing data insights to drive growth and innovation.
5 Best Practices Used By Einstein Analytics' Best CustomersHyoun Park
Amalgam Insights recently evaluated customers of Einstein Analytics that achieved high financial ROI within a three year period to see how they prepared and deployed sales analytics. Based on their experiences, we’ve put together this webinar to provide sales teams across all departments the insights necessary for maximizing the ROI from Einstein Analytics.
Acquire Grow & Retain customers - The business imperative for Big DataIBM Software India
The emergence of Big Data and Analytics has changed the way marketing decisions are made. Marketing has moved away from traditional ‘generalisation’ practices such as customer segmentation, geographical targeting etc. and is focussing more on the individual – the ‘Chief Executive Customer’.
The Power of a Proper North Star MetricRocketSource
Nailing your North Star Metrics is critical to your growth and revenue acceleration. This single metric can either shine a light on how well your organization is leading the charge towards sustainable growth or sound alarm bells on a strategy that’s out of alignment.
Finding the right North Star Metric is no small feat. It takes extensive analysis, research and digging. Having the right framework in place to understand what your North Star Metric is and how to leverage it across your team and in the market is crucial.
In this post, you’ll learn what makes a good North Star Metric, how to adopt a solid framework to find that metric, and important means for bringing your business further in alignment with customer expectations
In the recent past, we have learnt that data is the lifeline of any business and it is really important to collect data, more and more of it. But no one is telling us what to do with large volumes of data.
Shailendra has successfully delivered over One Billion Dollars in incremental value and will spend 30 minutes in showcasing how many large organisations are using data to their advantage by creating value through generating incremental revenue and optimising costs using analytics techniques.
Key Takeaways:
(i) Demystify the myths of analytics
(ii) Walkthrough a step-by-step approach to delivering successful projects that created an incremental value of hundreds and millions of dollars.
(iii) Three use cases where large organisations are using analytics to their advantage by creating value by generating incremental revenue and optimising costs.
Changing customer behaviors have dramatically changed the way brands need to measure success. Starting with an analytics frameworks is essential for measuring business ROI.
Whitepaper: Predictive Analytics - Looking to the FutureIconixx
Successful companies move forward. They look to the future. That’s why Predictive Analytics are essential to setting business strategy and leveraging data to look ahead and predict how those potential strategies will meet corporate goals.
[DSC MENA 24] Ahmed_Refaay_- Where to Start Your Data Analytics Journey.pptxDataScienceConferenc1
The world of data analytics is booming, offering exciting opportunities to those who can unlock the power of information. This talk will equip you with a roadmap to kickstart your data analytics journey. We'll explore three key areas to empower your beginning: Business Acumen: Gaining a business understanding is crucial. We'll discuss how to translate business problems into data-driven solutions, ensuring your analysis is relevant and impactful. Six Sigma Foundations: This problem-solving methodology can be a valuable asset. We'll delve into the basic principles of Six Sigma and how they can improve your data analysis approach, leading to more efficient and accurate insights. Data Analytics Fundamentals: We'll introduce essential data analysis concepts like data wrangling, visualization, and basic statistics. Understanding these fundamentals will equip you to handle and interpret data effectively. By combining business acumen, Six Sigma principles, and foundational data analysis skills, you'll be well-positioned to embark on a rewarding data analytics journey. This talk will provide a clear starting point and ignite your curiosity to explore this dynamic field further. at the end we shall share some business cases from our success stories.
More and more companies are requiring their marketing teams to provide ROI for their initiatives. Does your marketing team do this? We invite you to join us to learn how to work with your marketing team to ensure they have the tools, resources and strategies to align marketing initiatives with business objectives.
Marketing Metrics and Analytics Tools for Success- DA PPT.pptx.pdfDigital Aacharya
Digital_Marketing_Courses_in_Pune
Marketing metrics and analytics are the quantitative measurement and analysis of a variety of marketing activities and outcomes to evaluate the efficacy and efficiency of marketing campaigns, strategies, and initiatives.
For many organizations, key performance indicators (KPIs) are "basic" in name only and are tracked to meet compliance regulations or provide retrospective analysis. There is a need for smarter KPIs, says Michael Schrage, a visiting researcher at the MIT Initiative on the Digital Economy (IDE).
Webinar - Build a Better Sales Force using SPM technologyFred Sass
Organizations that use Sales Performance Management technology hire better people, increase sales productivity, improve visibility and insight, increase organizational agility, meet compliance requirements, and reduce errors and cycle time.
Similar to Use Sales Data to Develop a Customer-Centric Sales Approach (20)
The Path to Data and Analytics ModernizationAnalytics8
Learn about the business demands driving modernization, the benefits of doing so, and how to get started.
Can your data and analytics solutions handle today’s challenges?
To stay competitive in today’s market, companies must be able to use their data to make better decisions. However, we are living in a world flooded by data, new technologies, and demands from the business for better and more advanced analytics. Most companies do not have the modern technologies and processes in place to keep up with these growing demands. They need to modernize how they collect, analyze, use, and share their data.
In this webinar, we discuss how you can build modern data and analytics solutions that are future ready, scalable, real-time, high speed, and agile and that can enable better use of data throughout your company.
We cover:
-The business demands and industry shifts that are impacting the need to modernize
-The benefits of data and analytics modernization
-How to approach data and analytics modernization- steps you need to take and how to get it right
-The pillars of modern data management
-Tips for migrating from legacy analytics tools to modern, next-gen platforms
-Lessons learned from companies that have gone through the modernization process
Communicate Data with the Right VisualizationsAnalytics8
While there is an art to dashboard design, the science behind visualization is more important than most people realize. In these webinar slides, we show how to approach data visualization in a systematic way that will unlock the story your data holds.
Demystifying Data Science Webinar - February 14, 2018Analytics8
In this webinar, we talked about data science and machine learning. It is not as hard as you may think to get started; and once you do, you’ll see immediate business value.
SpendView: Get Full Visibility Of Your Spend | Qonnections 2016Analytics8
More details at www.analytics8.com/technologies/spendview
At Qonnections 2016, we presented a break-out session where we demonstrated SpendView and showed how you can utilize Qlik to analyze all your procurement data.
Get more information at
Chatty Kathy - UNC Bootcamp Final Project Presentation - Final Version - 5.23...John Andrews
SlideShare Description for "Chatty Kathy - UNC Bootcamp Final Project Presentation"
Title: Chatty Kathy: Enhancing Physical Activity Among Older Adults
Description:
Discover how Chatty Kathy, an innovative project developed at the UNC Bootcamp, aims to tackle the challenge of low physical activity among older adults. Our AI-driven solution uses peer interaction to boost and sustain exercise levels, significantly improving health outcomes. This presentation covers our problem statement, the rationale behind Chatty Kathy, synthetic data and persona creation, model performance metrics, a visual demonstration of the project, and potential future developments. Join us for an insightful Q&A session to explore the potential of this groundbreaking project.
Project Team: Jay Requarth, Jana Avery, John Andrews, Dr. Dick Davis II, Nee Buntoum, Nam Yeongjin & Mat Nicholas
06-04-2024 - NYC Tech Week - Discussion on Vector Databases, Unstructured Data and AI
Round table discussion of vector databases, unstructured data, ai, big data, real-time, robots and Milvus.
A lively discussion with NJ Gen AI Meetup Lead, Prasad and Procure.FYI's Co-Found
Adjusting OpenMP PageRank : SHORT REPORT / NOTESSubhajit Sahu
For massive graphs that fit in RAM, but not in GPU memory, it is possible to take
advantage of a shared memory system with multiple CPUs, each with multiple cores, to
accelerate pagerank computation. If the NUMA architecture of the system is properly taken
into account with good vertex partitioning, the speedup can be significant. To take steps in
this direction, experiments are conducted to implement pagerank in OpenMP using two
different approaches, uniform and hybrid. The uniform approach runs all primitives required
for pagerank in OpenMP mode (with multiple threads). On the other hand, the hybrid
approach runs certain primitives in sequential mode (i.e., sumAt, multiply).
06-04-2024 - NYC Tech Week - Discussion on Vector Databases, Unstructured Data and AI
Discussion on Vector Databases, Unstructured Data and AI
https://www.meetup.com/unstructured-data-meetup-new-york/
This meetup is for people working in unstructured data. Speakers will come present about related topics such as vector databases, LLMs, and managing data at scale. The intended audience of this group includes roles like machine learning engineers, data scientists, data engineers, software engineers, and PMs.This meetup was formerly Milvus Meetup, and is sponsored by Zilliz maintainers of Milvus.
The Building Blocks of QuestDB, a Time Series Databasejavier ramirez
Talk Delivered at Valencia Codes Meetup 2024-06.
Traditionally, databases have treated timestamps just as another data type. However, when performing real-time analytics, timestamps should be first class citizens and we need rich time semantics to get the most out of our data. We also need to deal with ever growing datasets while keeping performant, which is as fun as it sounds.
It is no wonder time-series databases are now more popular than ever before. Join me in this session to learn about the internal architecture and building blocks of QuestDB, an open source time-series database designed for speed. We will also review a history of some of the changes we have gone over the past two years to deal with late and unordered data, non-blocking writes, read-replicas, or faster batch ingestion.
Learn SQL from basic queries to Advance queriesmanishkhaire30
Dive into the world of data analysis with our comprehensive guide on mastering SQL! This presentation offers a practical approach to learning SQL, focusing on real-world applications and hands-on practice. Whether you're a beginner or looking to sharpen your skills, this guide provides the tools you need to extract, analyze, and interpret data effectively.
Key Highlights:
Foundations of SQL: Understand the basics of SQL, including data retrieval, filtering, and aggregation.
Advanced Queries: Learn to craft complex queries to uncover deep insights from your data.
Data Trends and Patterns: Discover how to identify and interpret trends and patterns in your datasets.
Practical Examples: Follow step-by-step examples to apply SQL techniques in real-world scenarios.
Actionable Insights: Gain the skills to derive actionable insights that drive informed decision-making.
Join us on this journey to enhance your data analysis capabilities and unlock the full potential of SQL. Perfect for data enthusiasts, analysts, and anyone eager to harness the power of data!
#DataAnalysis #SQL #LearningSQL #DataInsights #DataScience #Analytics
Use Sales Data to Develop a Customer-Centric Sales Approach
1.
2. Unleash the power of your data
Analytics8 is a data and analytics consultancy.
We help companies make smart, data-driven decisions by
translating their data into meaningful and actionable information.
For us, data is not just data. It's an opportunity to innovate, support, and
transform. We know data is power and with it, we will help you unleash yours.
6. THE
IMPORTANCE
OF SALES
ANALYTICS
See more than how you did;
understand what to do
Better understand customer
behavior to inform all aspects
of your sales strategy
It's necessary to truly scale
and improve your sales
organization
8. P I P E L I N E
A C C U R A C Y
S A L E S
P E R F O R M A N C E
C U S T O M E R
P R O F I L E S
C U S T O M E R
B E H A V I O R
S A L E S
T A R G E T I N G
THE FIVE AREAS TO ANALYZE
14. INTRODUCE
ADVANCED ANALYTICS
TO GET MORE
ACTIONABLE INSIGHT
• Move beyond what and get to the
why and how
• Provide inputs about customer
traits, product traits, usage
patterns, etc
• Programmatically analyze the
data to uncover importance,
anomalies, changes in habits
and behaviors
• Cyclical nature enables improved
models based on new data
15. VALIDATE MODEL ON
NEW DATA
CUSTOMER TRAITS
FEATURES
USAGE PATTERNS
PRODUCT TRAITS
TEST MODEL
SCORE MODEL
IMPLEMENT
MODEL
TRAIN MODEL
CHURN
NO CHURN
MACHINE LEARNING MODELS
Continuously fine tune your model to make it more effective
18. SALES FORECASTING
NEEDS TO BE
ADJUSTED
What will my sales be this month,
next month, next quarter, etc?
• COVID has thrown a curveball in
sales forecasting
• Can't assume that once
predictable business operations
will behave the same
19. SALES DASHBOARD: ACCOUNT HISTORY + PAID ON TIME
Company A
Company B
Company C
Company D
Company E
Company F
Company G
Company H
Company I
Company J
Company K
Company L
Company M
Company N
Company O
Company P
Company Q
Company R
20. SALES DASHBOARD: OPPORTUNITY DETAILS
Company A
Company B
Company C
Company D
Company E
Company F
Company G
$$
$$
$$
$$
$$
$$
$$
$$
$$
$$
$$
$$
$$
$$
$$
$$
$$
$$
$$
$$
$$
$$
$$
$$
Qlik Sense Development
Migration to Qlik
Supply Chain analytics dashboard
Cloud Migration to AWS
Geospatial Analytics
Qlik and Power BI Training
Mapping Services
22. SALES PERFORMANCE
Sales Reporting:
Who is selling more or
less? Is remote selling
working? How are sales
reps doing?
Sales Analytics:
What techniques are
producing sales?
26. SALES TARGETING
Enhanced customer segmentation helps identify the right messaging for the
right customer at the right time
Who should Sales target?
Segment/Cluster
Groups
• Demographics
• Geographics
• Product channels
• Customer lifecycle
(to name a few)
Apply Machine
Learning Techniques
to Identify Significant
Drivers
• Supervised (has targets)
• Unsupervised (i.e.
Clustering)
Hone Marketing
Efforts
–
Drive
Product/Service
Innovation
27. BEST PRACTICES
• Have clear direction
• Enhance customer data
collection to improve targeting
• Start with a solid data strategy
• Leverage existing analytics and
BI dashboards
• Ethical data science
MACHINE LEARNING
IS MORE THAN THE
MODEL
Best Practices
28. ML MODELS UNCOVER CUSTOMER MOTIVATIONS
Which customers are the
appropriate target for a
product/service?
Interpretable ML models help us
understand customer influences
and behaviors, helping
to increase sales conversions
Customer profiling tells us
who shares similar traits.
But why?
Profile
customers
Apply ML
model
.
.
.
..
.. . . .. .
..
.
.
.
.
.
. .
.. ... . .. .
. .
.. ..
. . .. .
. .
.. .. . .. .
. .. .
.. ..
. .. .
..
. .
.
.
. .
. ......
..
.
.
.
...
. ... .....
..
. ...
.....
..
. ..... ..
.. ..
. ...
.. ..
. .
.
.
.
. . . .. .
..
.
. .
.. ..
.. .
. .
. .. .
. .. .
.. ..
. .. .
..
.
29. SUMMARY: HOW TO GET STRONG SALES ANALYTICS
How much of this are you already doing?
P I P E L I N E
A C C U R A C Y
S A L E S
P E R F O R M A N C E
C U S T O M E R
P R O F I L E S
C U S T O M E R
B E H A V I O R
S A L E S
T A R G E T I N G
31. We know data is power and with it,
we will help you unleash yours.
#salesanalytics
Editor's Notes
When I was a kid and first learning to drive my mom would give me $10 and tell me to go to the grocery store to buy a loaf of bread. Though the grocery store is not an exciting place to go for a a 16 year old, it gave me reprieve from my irritating siblings and she always let me keep the change. Since I always got to keep the change I constantly looked for ways to save a little bit of money on the bread. I’d hunt for coupons and shop the sales. I hit gold when I found the grocery discount card.
You’ve seen these cards. You scan them at the grocery line and get to take advantage of member only discounts. Those little cards give you big savings -- and you give the grocery store your sales data. Think for a moment about the type of information they can glean from your discount cards. They know what kinds of items you like. They know what stores you visit. They know when you like to buy groceries and what groceries you prefer in any given season. They also know how often you shop for certain items, allowing them to stay stocked without letting food rot. Understanding their customer sets the tone for their selling strategy.
When COVID-19 hit, people’s buying habits changed. More people chose to eat at home instead of brave the restraunts. At the same time, going to the grocery store raised concern of exposure. This resulted in the need for larger grocery runs less often and a quick shift to online ordering. Buying habits changed overnight and grocery stores had to shift selling strategies quickly to stay afloat.
Grocery stores paid attention to the customer buying habits during COVID 19 and when toilet paper vanished from US shelves, they did more than just try to restock toilet paper. Instead, they paid attention to how customers were buying and why their buying habits were changing. It’s not that more people came in and bought more items. It’s that fewer people were making fewer trips and buying in bulk. To meet customer demand they began to promote purchasing online where they could ship items directly from the warehouse, control stock, and calm
-----------------------------------------------
TB >> Updated Talk Track 11.11.20
Too often the metric for success in sales comes back to whether you are actually… well… selling. If the grocery stores had ony paid attention to the decrease in stock in toilet paper they would have bought more, stocked their shelves, and waited for customers that would have never come. Keeping track of what you sold only tells you that what you were doing worked when you did it. It does not tell you if you have a successful sales strategy.
What if, prior to covid you had been spending a bit more time trying to understand not if a person bought, but why a person would. What if you better understood each customer’s habits better? If they responded better to calls in the morning vs the afternoon would you change your approach? If you understood if they preferred emails or calls would you change the way you contact them? If you could easily watch the history of a clients interactions and what was happening before each purchase, would it change your approach during a time when no one was purchasing? My guess is it would.
The problem is that getting that level of data is difficult in the best of times. It depends on proper capture mechanisms and ways of gathering that data from multiple sources. At Analytics8 we use Sales Force and Marketo to help manage our incoming pipeline. For years we thought we had it all figured out. We had a little screen from Marketo embedded in SalesForce that would tell us if a customer responded to one of our marketing initiatives. That worked great for understanding when a customer got something from us (downloaded a pamphlet, signed up for a webinar, etc. ) but was clunkcy when trying to determine if a customer got everything they needed from that single touch or if they wanted to talk to us more. We could go to a separate screen and see if the client ever purchased from us (their history) and then another screen to see how many times we reached out before it happened (our effort) and then another screen to find out who we last talked to (our relationships) and then LinkedIn (additional contexteual information). That’s a lot of work just to find out the likely true interest of a customer.
To help, we put a standard BI tool on top of SalesForce and Marketo. It allowed us to see information about a customer across many different Salesforce reports. Not only that, it allowed us easily see our customers behaviors, the opportunities currently in our pipeline, the proven best practices of our senior sales staff. Essentially, it gave us a better view at what was, and was not working, in our sales organization. So, when COVID happened, we could easily see what was causing the dip in Sales, what was working despite the dip, and scale that practice. For those of you who follow us you saw an implantation of our findings last quarter when we leaned in heavily to Recovery Analytics. We saw our customers responding well when we reached out to help in their recovery by leveraging data. That campaign was a direct result of feedback we got from Sales Analytics.
We are not done, we anticipate leveraging machine learning in the near future to better understand customer behavior in ways we can’t. It’ll be great to have this same conversation with some of you next year.
-----------------------------------------------
TB >> Updated Talk Track 12.2.2020
This is the opening page for the dashboard I was talking about. We’ll see a number of screen shots inside this application throughout this webinar but this is the view before we start drilling in to the data. You can see here how we have our reporting broken down into a number of different pages. Each page shows us a different angle of how the customer is responding to us and how we are responding to the customer.
-----------------------------------------------
TB >> Updated Talk Track 11.11.20
So what do we need to Analyze. We already said that looking at how much we sold is not enough. It’s also true that looking at any one of the items listed here by themselves provides a skewed view of your sales organizations.
After all, understanding how your Customer behaves at the end of a quarter can massively change how that customer fits in your pipeline accuracy and forecasting abilities.
At Analytics8 we think a successful sales strategy leverages data from 5 key topics
Customer Profiles
Customer Behavior
Pipeline Accuracy
Sales Performance
Sales Targeting
During this webinar we’re going to look at each of these independently and discuss the value we can gain each.
----------------------------------------------
Customers often share similar characteristics but have small nuances. For example, I spent many years before the consulting world working with a supplemental insurance company. We’ll call them Duck insurance company from now on so I can reference them later. Duck Insurance never started projects in the 4th quarter. 4th quarter was crazy for them trying to get polices out the door and claims paid before the new year. Turns out, this is true of many insurance companies. It’s just how the industry works.
Duck insurance was also great at keeping people around for a long time. It was not abnormal to have 4 people with over 40 years of time at the company at any given moment. Turns out, this was a nuance of Duck Insurance and not an industry standard.
Both facts about the company are important. One is an industry standard and the other is a specific nuance of that client. Knowing 4th quarter is bad means I don’t try to sell things to them then. Knowing they keep people around let’s me know there is a lot of stored information in a few people and spending time with those people will get me places much faster.
-----------------------------------------------
TB >> Updated Talk Track 11.11.20
Some information, such as those I just talked about, come from an intimate knowledge of the customer. This type of information is valuable can be captured in a tool like SFDC and shared with the larger group in the form of say, a scatter chart where the purchase volume or frequency can be set over different timeframes such as quarters or year.
What happens if you don’t know the customer and are simply trying to find new customers. How do you profile a customer you don’t know? You likely drive past an industry that does this really well and never thought about it.
We have a road near where I live that has 5 car dealerships on it. They all sell a different kind of car and they are all competitors. It turns out that if a customer is looking for a car they are likely to visit a number of dealerships. If the dealerships are near each other they have an opportunity to pull from the car buying customer pool that each dealership pulls to the area. Car dealerships have profiled their customer. See, if a car dealership was near a place that sold shoes it wouldn’t make much sense. The budget of a person looking to buy shoes is very different from the budget of a person trying to buy a car.
If you aren’t looking at data that tells you the company industry, the products they use, the revenue of a customer, how much they should could spend on your product, when they normally buy, etc, you may be wasting your time trying to sell a car to a person looking for shoes.
>>> Need to roll in to [SALES DASHBOARD] slide 8 better. Needs a bit more explanation.
-----------------------------------------------
TD >>>
I like the story you tell here, but I think you need to relate it to how someone would use data to build a customer profile. You knew this about Duck Insurance because you worked there- but how would someone who didn’t have this inside knowledge of a company build a customer profile? I think you just need to add some content around this- but keep this story. Might need another slide or two- explain how/ where you can use your data to build profiles about companies.
JM>> could probably accomplish this by discussing the importance of adding contextual data to general customer profile data: when you add contextual details (employee demographics, the technology they use, etc) to obvious external factors that describe your customer profile (like industry data), you discover the value can you provide
--------------------
TB >> Updated Talk Track 12.3.2020
At Analytics8, our version of trying to sell a car to someone shopping for shoes would be trying to sell a software package or consulting engagement to someone heavily invested in something different. Software and the consulting services to scale out a software can be a large investment and switching can be costly. We use our dashboarding tool keep track of what kinds of tools and services a company has already invested in and how often so that we don’t offer something that is completely outside of their wheelhouse.
This is a screenshot of one of the sheets in our internal sales dashboard. It tells when customers have spent money, what they have spent money on and how lucrative that customer is. This particular customer uses a tool called Qlik and has engaged us to help them build with it recently. If I went to them and tried to pitch Tableau, another BI tool, it would likely fall flat.
The customer profile tells me what solutions they are warm to and which they are not; saving me time and social capital with the customer
Matt
MATT
Intro- explain if you want to really understand customer behavior- you need to go beyond traditional analytics and use some more advanced techniques. explain high level what you mean by data science/ ML models.
When it comes to analyzing customer behavior- very important to understand what customers are going to churn or not. You want to be able to keep your customers no matter what phase they are in.
How to do that- look at traits like customer traits, product traits, usuage patterns and put that into your model. These are inputs into your model. You need to be able to find the best model and then validate it.
These models can be further fine tuned to do customer segmentation- when you break up customers by segments- you will get better resutls and can address better targets instead of having a catch all category for all topiocs/ needs/ etc
Customer profiles are input into the customer behavior....
How to assess churn. During this process, can ID different segments.
TD NOTES >>>
I am guessing that once we know more about the talk track, we will probably need to add some slides. I think there is a lot of info to unpack around this topic.
ORIGINAL NOTES >>>>
How have my customers buying habits changed? What products/ services do they want? How do I put my customers into groups so I can better target my messaging and sales efforts?
Trey
-----------------------------------------------
TB >> Updated Talk Track 11.18.20
Now that we understand what our customer looks like and what causes their buying habits to change, we can get a better handle on Pipeline Accuracy and Sales Forecasting. If we go back to the grocery store analogy I used at the beginning we discussed the epic toilet paper shortage of COVID 2020. Grocery stores understood that buying habits had changed but not necessarily usage. Just because more toilet paper was being purchased, it didn’t mean we had found alternative uses for it that would cause demand to continue to increase. Knowing this allowed grocery stores to properly forecast based on customer needs and buying habits and not whether their items had been selling. If instead, they had assumed that sales begot sales that begot sales, their forcast would have been grossly overestimated.
Too often we see people looking at their sales from last year, checking their gut, and assuming that business will continue to grow because their pipeline looks full. In many cases, that would be true. But when the buying habits of billions of people change, growth is far from certain. Instead, they should have used data to look at the reasons customers were buying. When those reasons change, their buying habits change and impact Pipeline accuracy.
This is another sheet I our sales dashboard. This sheet is often used to look at the history of an account. I’ve made some selections to filter to accounts that we’ve done business with in the last 6 months that have been invoiced and which they have paid those invoiced on time. It’s not that I don’t have additional accounts I’ve worked with, they just might not have done work recently or they haven’t paid invoices on time which is not a surprise in the economic situation we are in. These customers on the other hand are doing work. That tells me they have a budget, a need, authority and a timeline; all powerful indicators of continued future work.
Switching to another sheet in the sales dashboard I ‘ve carried the same accounts over to see what open opportunities we have with those clients. Again, this sheet does not tell me all of my open opportunities, but it does show me the pipeline I have with customers I have a high confidence in.
Based on the data, These customers are very likely to result in closed deals and generate income before the end of the year.
By looking at our most resilient customers we’ve overcome the inherint fragility of pipeline accuracy. Now our sales forcasting is built on data driven experience instead of hopeful thinking.
-----------------------------------------------
TB >> Updated Talk Track 11.18.20
Finally we get to Sales Performance. This is what many people thing about when they think Sales reporting. Who’s selling more? Which location or salesperson is making their targets? How many calls are they making and emails are they sending?
Take note that at this point we’ve switched focuse. In all previous sections we’ve talked about the customer but here, we talk about what the seller, or product, is doing.
I have kids and we often drag them to Target. If you don’t have kids, you should know that most kids hate target and see it as a place of torture. That is, until you get to the Toy section. In my Target, the shelves in the toy section are set lower than elsewhere in the store. Just low enough that my kids can see all the things they absolutely *NEED*. If you take them to the bedding section, the shelves are placed higher, where they can’t see them. ( come to think about it, just high enough for my wife to see the things she *NEEDS*.) Target is doing this because they know their target audience, but they are also measuring their assumptions to see if they work. When they aren’t working, the item on the shelves move or get that glorious red sales sticker.
See, the data question here is not how much are you selling, but what techniques are producing sales. In our world we keep track of calls, emails, marketing campaigns, and the like and compare that to what turns in to an engagement. It’s a way for us to validate our techniques and hone what works
This is another page on our sales dashboard. I know it’s a bit difficult to see but the table at top shows the salesperson on the far left and different ways of measuring the dollars brought in.
The tables at the bottom give us a view of the activities.
Another view shows us a scatter plot that compares amount sold to profit gained. This allows us to easily see what products are being sold by who that gain us the most profit.
Matt
MATT
Will add process flow on how to build a clustering model.
Who should the sales people target? How can sales people improve their chances converting a prospect?
Customer segmentation
Different analysis/model for each segment
Further segment by other demographics (region, age range, product channel, etc.)
Identify needs of specific customers
Targeted marketing (e.g. A/B testing) by life-cycle stage and/or demographics
Better innovation through understanding targeted needs not just general needs or follow-on products
Voice of the customer translates to inputs for machine learning models
Data collection, organization and data profiling essential to an effective model and adoption of any machine learning integration
Incorporate results into BI dashboards salespeople already using, or even give them ability to run models based on new inputs on the fly
MATT
What drives your customers? Segment them into groups based on drivers. That only gets you segments- need to understand what those segments are- so you can actually take that to use for marketing etc…
TB >> Updated Talk Track 12.3.2020
Thanks Matt, we’ve made it to the end. To recap we talked about 5 different areas to analyze to improve your overall sales strategy, most focused on the customer, and very little on the number of widgets you’ve sold. My question to you is, how much of this are you already doing? Next, of the items you are doing, what are you doing well?
There are organizations that have most of this figured out but there are a lot more don’t. If you’re one of those that don’t I suggest you pick one area to start instead of trying to do them all. I think the easiest is Customer Profile. Most sales organizations have some sort of CRM tool like Salesforce to manage their customer database. Look in the CRM and see if you track activity there. Do you have the companies net revenue saved at an account level? What about their industry? Can you get information about what types of products they use by doing a job search on a website like Monster to see what roles they are hiring for? Most of this information is freely available and just requires updating the processes used to get the information documented.
All of this information adds to the profile of the customer that helps you understand the who’s, what’s and when’s of a customer. From that point you just need a good way to report on that data. Let me share with you though some things we learned from experience. Your CRM will only get you so far. It’s designed to capture information and telling you what was captured is an afterthought. It’s no surprise Salesforce bought Tableau last year. Salesforce stores data, Tableau visualizaes it.
There are a lot of resources on the web to help build out a Sales Analytics Reporting platform; many of which are at Analytics8.com. However, if you need a hand we’re here to help. After all, we’re doing it now.
>>> Your CRM will only get you so far.
Matt and I have spent a lot of time talking and now would be a good time to hear from all of you. Continue asking questions in the questions box. Matt, have you been looking through those? Any questions you want to jump on?