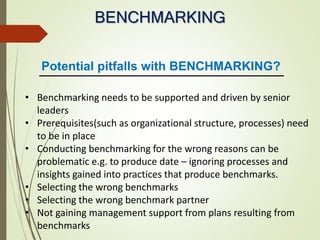
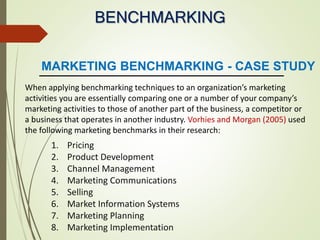
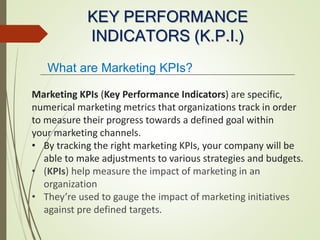
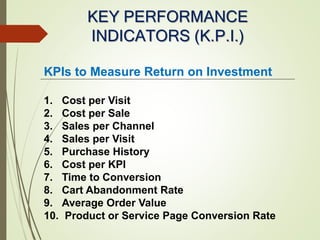
DIGITAL STRATEGY & PLANNING
Table of Contents
• Budget Forecasting
• Data Visualization
• Benchmarking
• SWOT Analysis
• KPIs and Analytics
Forecasting is a key part of the process for
creating marketing plans, both for annual
investment and for individual campaigns.
Creating more accurate forecasts of the
returns from digital marketing is now
essential given the growth in investment in
digital marketing.
WHAT IS BUDGET FORECASTI
WHY CREATE MARKETING FORCASTS?
In an ideal world, you should have a culture that respects data and analytics.
Unfortunately, few organizations are structured this way. The benefits of
developing a data-driven marketing culture are substantial, including:
• Greater Influence for the marketing department
• Greater justification for marketing spend
• Greater accountability
• Strategic Business Advantage
• Staying up-to-date
WHY CREATE MARKETING FORCASTS?
1. Greater Influence for the marketing
department
This is a focus on the output of marketing
(awareness building, generating enquiries, leads and
sales) rather than the inputs (budgets, people,
resources, time) establishes marketing as a revenue
centre to be supported rather than a cost-centre to
be reduced.
WHY CREATE MARKETING FORCASTS?
2. Greater justification of marketing spend
Data-led marketing and forecasting helps build the
business case for marketing spend.
Professional, evidence-based forecasts demonstrate
the impact promotional activities will have on the
bottom line.
WHY CREATE MARKETING FORCASTS?
3. Greater Accountability
When CMOs take on more direct responsibility for
revenue, their renumeration begins to look more like
that of their sales colleagues.
Not every CMO is comfortable with this risk-reward
trade-off.
However, if marketers claim to be able to track and
measure everything they do, then a greater focus on
marketing targets is likely to become the norm.
WHY CREATE MARKETING FORCASTS?
4. Strategic Business
Advantage
Business that better predict the future are better
placed to thrive in it.
History is littered with organizations that failed to
understand how their world was changing. By not
forecasting, organizations are hindered by a ‘business as
usual’ mentality.
This makes them unprepared for the future and
vulnerable to attack from competitors.
WHY CREATE MARKETING FORECASTS?
5. Staying up-to-date
Digital Marketing is constantly changing.
What is leading edge today will quickly become old-
school and dated tomorrow.
By forecasting forwards, marketers are less likely to miss
out on “the next Big Thing” and be left behind.
STEPS TO MARKETING BUDGETING
AND FORECASTING SUCCESS
A new report by Digital Doughnut sister
company London Research, produced in partnership
with business growth acceleration experts weareCrank,
looks at the extent to which companies are
benchmarking their spending and reviewing their
budgets on an on-going basis.
The report, which explores what successful marketers
are doing differently from their peers, contains the
following recommendations:
STEPS TO MARKETING BUDGETING
AND FORECASTING SUCCESS
1. Forecast rather than accept the marketing budget
you’re given.
Marketers need to be in control of their budget, making
sure they own it by forecasting it. Getting into the
numbers improves understanding, helps you manage
agencies, and will ensure you assign budget to the right
channels at the right time. You'll be more agile,
responding to inevitably changing market conditions and
channel switching, therefore improving returns and
growth.
STEPS TO MARKETING BUDGETING
AND FORECASTING SUCCESS
2. Invest more in the digital channels that are
exceeding benchmarks.
Invest more of your marketing spend in channels
where you can see there is more headroom or upside
potential; you will hit a cap but you’ll only know what
that is by testing it. If you don’t have, or can’t get,
more budget then re-allocate from poorly performing
channels online and offline in order to maximize
return on investment.
STEPS TO MARKETING BUDGETING
AND FORECASTING SUCCESS
3. Continually adjust spend at least
every three months.
Continual adjustment and changing of
forecasts and budgets improves
results. Many customers use multiple
devices, so marketers need to
understand not only what channels to
use, but also what assets, messages
and even products and services work
best on what devices in terms of ROI.
STEPS TO MARKETING BUDGETING
AND FORECASTING SUCCESS
4. Know your benchmarks and don't fret so
much about attribution.
Benchmarking works best when businesses
create their own benchmarks, refer to other
third-party benchmark data and monitor any
upward or downward swings over time. This
should be done for both channel and spend,
looking at specific KPIs within each.
Attribution is important but not crucial so
don’t chase the holy grail - get really good at
the basics.
STEPS TO MARKETING BUDGETING
AND FORECASTING SUCCESS
5. Get really good at tracking and tagging.
Although we didn’t ask questions in our
survey about tracking, it is the ultimate
foundation from which you’ll make
decisions about performance and spend. If
you’re not tracking correctly, some media
will end up in the wrong bucket and you’ll
potentially throw money in the wrong
direction. If you’re not already doing so,
ask questions about your direct traffic.
DATA VISUALIZATON
Data: Data is a key tool in the field of
marketing. By using charts, graphs, tables, and
other visual communication tools, you can better
understand where to focus your attention and
how to effectively engage consumers.
Data Visualization: Data visualization is
the process of translating data into a chart, graph,
or other visual component. This makes it easier to
read and analyze the data. Patterns and outliers
are more obvious when you can see them clearly,
rather than having to search for them in a
spreadsheet or database.
STEPS TO VISUALIZING DATA
Step 1: Determine the Best Method for Visualizing Your Data
There are a wide variety of data visualization techniques,
there are so many different types of charts, graphs,
diagrams and other methods of visualizing data that
determining which one isn’t always the most straightforward
decision. Some things to consider is determine how many
data points you plan to include.
e.g, if you have a large number of points spread across a
certain range, a dot graph or scatter plot may be more
effective than a pie chart or table.
STEPS TO VISUALIZING DATA
Step 2: Create Your Chart, Graph, or Other Visual Feature
There are a wide variety of tools you can use to get the job done. Which
is best for you depends on how you intend to use data visualization.
Simple Charts and Graphs, Graphic Design for Data Visualization, Data
Visualization Platforms.
There are some common simple charts & graphs tools like Microsoft
Excel and Google sheets, both offer several visualization options
including bars, charts and plots while Google sheets includes maps and
timelines.
Example of the most common Graphic Design for Data Visualization tools
is Canva.
For sharing and analyzing data with your team, you might consider a
data visualization platform such as Tableau.
STEPS TO VISUALIZING DATA
Step 3: Assess Patterns and Trends and Plan Campaigns
Once your data is visualized, you can start assessing it to shape a more
effective marketing strategy. You’ll particularly want to keep an eye out for
patterns and trends, as these likely indicate areas where you can market
your brand’s products or services successfully:
SWOT ANALYSIS:
SWOT ANALYSIS
:A SWOT analysis helps you
understand internal and
external factors that can
make or break your success
toward your marketing
goal. SWOT is an acronym
that stands for strengths,
weaknesses, opportunities,
and threats.
SWOT ANALYSIS
The four areas it encompasses are
meant to help you explore internal
and external factors:
• Internal(Your resources)
o Strengths
o Weaknesses
• External(Market, competition,
etc.
o Opportunities
o Threats
BENCHMARKING
Benchmarking is the process of measuring a
business’s performance against competitors
and industry standards.
• Companies benchmark to analyze their success
and get a better understanding of how they are
performing relative to their competition.
What is BENCHMARKING?
BENCHMARKING
• Benchmarks provide valuable insights to decision makers in a
company.
• It helps marketers know how their marketing campaigns stack up
against their competitors’, can use this competitive analysis to
differentiate their offers.
• With established benchmarks, employees of a company can more
thoroughly evaluate the success of their company and see where
improvements can be made and what improvements should be made.
• Benchmarking gives businesses the opportunity to optimize their
strengths and exploit their competitors’ weaknesses.
Why BENCHMARKING?
BENCHMARKING
• Benchmarking needs to be supported and driven by senior
leaders
• Prerequisites(such as organizational structure, processes) need
to be in place
• Conducting benchmarking for the wrong reasons can be
problematic e.g. to produce date – ignoring processes and
insights gained into practices that produce benchmarks.
• Selecting the wrong benchmarks
• Selecting the wrong benchmark partner
• Not gaining management support from plans resulting from
benchmarks
Potential pitfalls with BENCHMARKING?
BENCHMARKING
MARKETING BENCHMARKING - CASE STUDY
When applying benchmarking techniques to an organization’s marketing
activities you are essentially comparing one or a number of your company’s
marketing activities to those of another part of the business, a competitor or
a business that operates in another industry. Vorhies and Morgan (2005) used
the following marketing benchmarks in their research:
1. Pricing
2. Product Development
3. Channel Management
4. Marketing Communications
5. Selling
6. Market Information Systems
7. Marketing Planning
8. Marketing Implementation
KEY PERFORMANCE
INDICATORS (K.P.I.)
Marketing KPIs (Key Performance Indicators) are specific,
numerical marketing metrics that organizations track in order
to measure their progress towards a defined goal within
your marketing channels.
• By tracking the right marketing KPIs, your company will be
able to make adjustments to various strategies and budgets.
• (KPIs) help measure the impact of marketing in an
organization
• They’re used to gauge the impact of marketing initiatives
against pre defined targets.
What are Marketing KPIs?
KEY PERFORMANCE
INDICATORS (K.P.I.)
KPIs to Measure Return on Investment
1. Cost per Visit
2. Cost per Sale
3. Sales per Channel
4. Sales per Visit
5. Purchase History
6. Cost per KPI
7. Time to Conversion
8. Cart Abandonment Rate
9. Average Order Value
10. Product or Service Page Conversion Rate
WHY YOU SHOULD MARKET
EFFECTIVELY
ENJOY THE RETURNS OF
EFFECTIVE MARKETING

Digital Strategy & Planning

  • 1.
  • 2.
    Table of Contents •Budget Forecasting • Data Visualization • Benchmarking • SWOT Analysis • KPIs and Analytics
  • 3.
    Forecasting is akey part of the process for creating marketing plans, both for annual investment and for individual campaigns. Creating more accurate forecasts of the returns from digital marketing is now essential given the growth in investment in digital marketing. WHAT IS BUDGET FORECASTI
  • 4.
    WHY CREATE MARKETINGFORCASTS? In an ideal world, you should have a culture that respects data and analytics. Unfortunately, few organizations are structured this way. The benefits of developing a data-driven marketing culture are substantial, including: • Greater Influence for the marketing department • Greater justification for marketing spend • Greater accountability • Strategic Business Advantage • Staying up-to-date
  • 5.
    WHY CREATE MARKETINGFORCASTS? 1. Greater Influence for the marketing department This is a focus on the output of marketing (awareness building, generating enquiries, leads and sales) rather than the inputs (budgets, people, resources, time) establishes marketing as a revenue centre to be supported rather than a cost-centre to be reduced.
  • 6.
    WHY CREATE MARKETINGFORCASTS? 2. Greater justification of marketing spend Data-led marketing and forecasting helps build the business case for marketing spend. Professional, evidence-based forecasts demonstrate the impact promotional activities will have on the bottom line.
  • 7.
    WHY CREATE MARKETINGFORCASTS? 3. Greater Accountability When CMOs take on more direct responsibility for revenue, their renumeration begins to look more like that of their sales colleagues. Not every CMO is comfortable with this risk-reward trade-off. However, if marketers claim to be able to track and measure everything they do, then a greater focus on marketing targets is likely to become the norm.
  • 8.
    WHY CREATE MARKETINGFORCASTS? 4. Strategic Business Advantage Business that better predict the future are better placed to thrive in it. History is littered with organizations that failed to understand how their world was changing. By not forecasting, organizations are hindered by a ‘business as usual’ mentality. This makes them unprepared for the future and vulnerable to attack from competitors.
  • 9.
    WHY CREATE MARKETINGFORECASTS? 5. Staying up-to-date Digital Marketing is constantly changing. What is leading edge today will quickly become old- school and dated tomorrow. By forecasting forwards, marketers are less likely to miss out on “the next Big Thing” and be left behind.
  • 10.
    STEPS TO MARKETINGBUDGETING AND FORECASTING SUCCESS A new report by Digital Doughnut sister company London Research, produced in partnership with business growth acceleration experts weareCrank, looks at the extent to which companies are benchmarking their spending and reviewing their budgets on an on-going basis. The report, which explores what successful marketers are doing differently from their peers, contains the following recommendations:
  • 11.
    STEPS TO MARKETINGBUDGETING AND FORECASTING SUCCESS 1. Forecast rather than accept the marketing budget you’re given. Marketers need to be in control of their budget, making sure they own it by forecasting it. Getting into the numbers improves understanding, helps you manage agencies, and will ensure you assign budget to the right channels at the right time. You'll be more agile, responding to inevitably changing market conditions and channel switching, therefore improving returns and growth.
  • 12.
    STEPS TO MARKETINGBUDGETING AND FORECASTING SUCCESS 2. Invest more in the digital channels that are exceeding benchmarks. Invest more of your marketing spend in channels where you can see there is more headroom or upside potential; you will hit a cap but you’ll only know what that is by testing it. If you don’t have, or can’t get, more budget then re-allocate from poorly performing channels online and offline in order to maximize return on investment.
  • 13.
    STEPS TO MARKETINGBUDGETING AND FORECASTING SUCCESS 3. Continually adjust spend at least every three months. Continual adjustment and changing of forecasts and budgets improves results. Many customers use multiple devices, so marketers need to understand not only what channels to use, but also what assets, messages and even products and services work best on what devices in terms of ROI.
  • 14.
    STEPS TO MARKETINGBUDGETING AND FORECASTING SUCCESS 4. Know your benchmarks and don't fret so much about attribution. Benchmarking works best when businesses create their own benchmarks, refer to other third-party benchmark data and monitor any upward or downward swings over time. This should be done for both channel and spend, looking at specific KPIs within each. Attribution is important but not crucial so don’t chase the holy grail - get really good at the basics.
  • 15.
    STEPS TO MARKETINGBUDGETING AND FORECASTING SUCCESS 5. Get really good at tracking and tagging. Although we didn’t ask questions in our survey about tracking, it is the ultimate foundation from which you’ll make decisions about performance and spend. If you’re not tracking correctly, some media will end up in the wrong bucket and you’ll potentially throw money in the wrong direction. If you’re not already doing so, ask questions about your direct traffic.
  • 16.
    DATA VISUALIZATON Data: Datais a key tool in the field of marketing. By using charts, graphs, tables, and other visual communication tools, you can better understand where to focus your attention and how to effectively engage consumers. Data Visualization: Data visualization is the process of translating data into a chart, graph, or other visual component. This makes it easier to read and analyze the data. Patterns and outliers are more obvious when you can see them clearly, rather than having to search for them in a spreadsheet or database.
  • 17.
    STEPS TO VISUALIZINGDATA Step 1: Determine the Best Method for Visualizing Your Data There are a wide variety of data visualization techniques, there are so many different types of charts, graphs, diagrams and other methods of visualizing data that determining which one isn’t always the most straightforward decision. Some things to consider is determine how many data points you plan to include. e.g, if you have a large number of points spread across a certain range, a dot graph or scatter plot may be more effective than a pie chart or table.
  • 18.
    STEPS TO VISUALIZINGDATA Step 2: Create Your Chart, Graph, or Other Visual Feature There are a wide variety of tools you can use to get the job done. Which is best for you depends on how you intend to use data visualization. Simple Charts and Graphs, Graphic Design for Data Visualization, Data Visualization Platforms. There are some common simple charts & graphs tools like Microsoft Excel and Google sheets, both offer several visualization options including bars, charts and plots while Google sheets includes maps and timelines. Example of the most common Graphic Design for Data Visualization tools is Canva. For sharing and analyzing data with your team, you might consider a data visualization platform such as Tableau.
  • 19.
    STEPS TO VISUALIZINGDATA Step 3: Assess Patterns and Trends and Plan Campaigns Once your data is visualized, you can start assessing it to shape a more effective marketing strategy. You’ll particularly want to keep an eye out for patterns and trends, as these likely indicate areas where you can market your brand’s products or services successfully:
  • 20.
    SWOT ANALYSIS: SWOT ANALYSIS :ASWOT analysis helps you understand internal and external factors that can make or break your success toward your marketing goal. SWOT is an acronym that stands for strengths, weaknesses, opportunities, and threats.
  • 21.
    SWOT ANALYSIS The fourareas it encompasses are meant to help you explore internal and external factors: • Internal(Your resources) o Strengths o Weaknesses • External(Market, competition, etc. o Opportunities o Threats
  • 22.
    BENCHMARKING Benchmarking is theprocess of measuring a business’s performance against competitors and industry standards. • Companies benchmark to analyze their success and get a better understanding of how they are performing relative to their competition. What is BENCHMARKING?
  • 23.
    BENCHMARKING • Benchmarks providevaluable insights to decision makers in a company. • It helps marketers know how their marketing campaigns stack up against their competitors’, can use this competitive analysis to differentiate their offers. • With established benchmarks, employees of a company can more thoroughly evaluate the success of their company and see where improvements can be made and what improvements should be made. • Benchmarking gives businesses the opportunity to optimize their strengths and exploit their competitors’ weaknesses. Why BENCHMARKING?
  • 24.
    BENCHMARKING • Benchmarking needsto be supported and driven by senior leaders • Prerequisites(such as organizational structure, processes) need to be in place • Conducting benchmarking for the wrong reasons can be problematic e.g. to produce date – ignoring processes and insights gained into practices that produce benchmarks. • Selecting the wrong benchmarks • Selecting the wrong benchmark partner • Not gaining management support from plans resulting from benchmarks Potential pitfalls with BENCHMARKING?
  • 25.
    BENCHMARKING MARKETING BENCHMARKING -CASE STUDY When applying benchmarking techniques to an organization’s marketing activities you are essentially comparing one or a number of your company’s marketing activities to those of another part of the business, a competitor or a business that operates in another industry. Vorhies and Morgan (2005) used the following marketing benchmarks in their research: 1. Pricing 2. Product Development 3. Channel Management 4. Marketing Communications 5. Selling 6. Market Information Systems 7. Marketing Planning 8. Marketing Implementation
  • 26.
    KEY PERFORMANCE INDICATORS (K.P.I.) MarketingKPIs (Key Performance Indicators) are specific, numerical marketing metrics that organizations track in order to measure their progress towards a defined goal within your marketing channels. • By tracking the right marketing KPIs, your company will be able to make adjustments to various strategies and budgets. • (KPIs) help measure the impact of marketing in an organization • They’re used to gauge the impact of marketing initiatives against pre defined targets. What are Marketing KPIs?
  • 27.
    KEY PERFORMANCE INDICATORS (K.P.I.) KPIsto Measure Return on Investment 1. Cost per Visit 2. Cost per Sale 3. Sales per Channel 4. Sales per Visit 5. Purchase History 6. Cost per KPI 7. Time to Conversion 8. Cart Abandonment Rate 9. Average Order Value 10. Product or Service Page Conversion Rate
  • 28.
    WHY YOU SHOULDMARKET EFFECTIVELY
  • 29.
    ENJOY THE RETURNSOF EFFECTIVE MARKETING