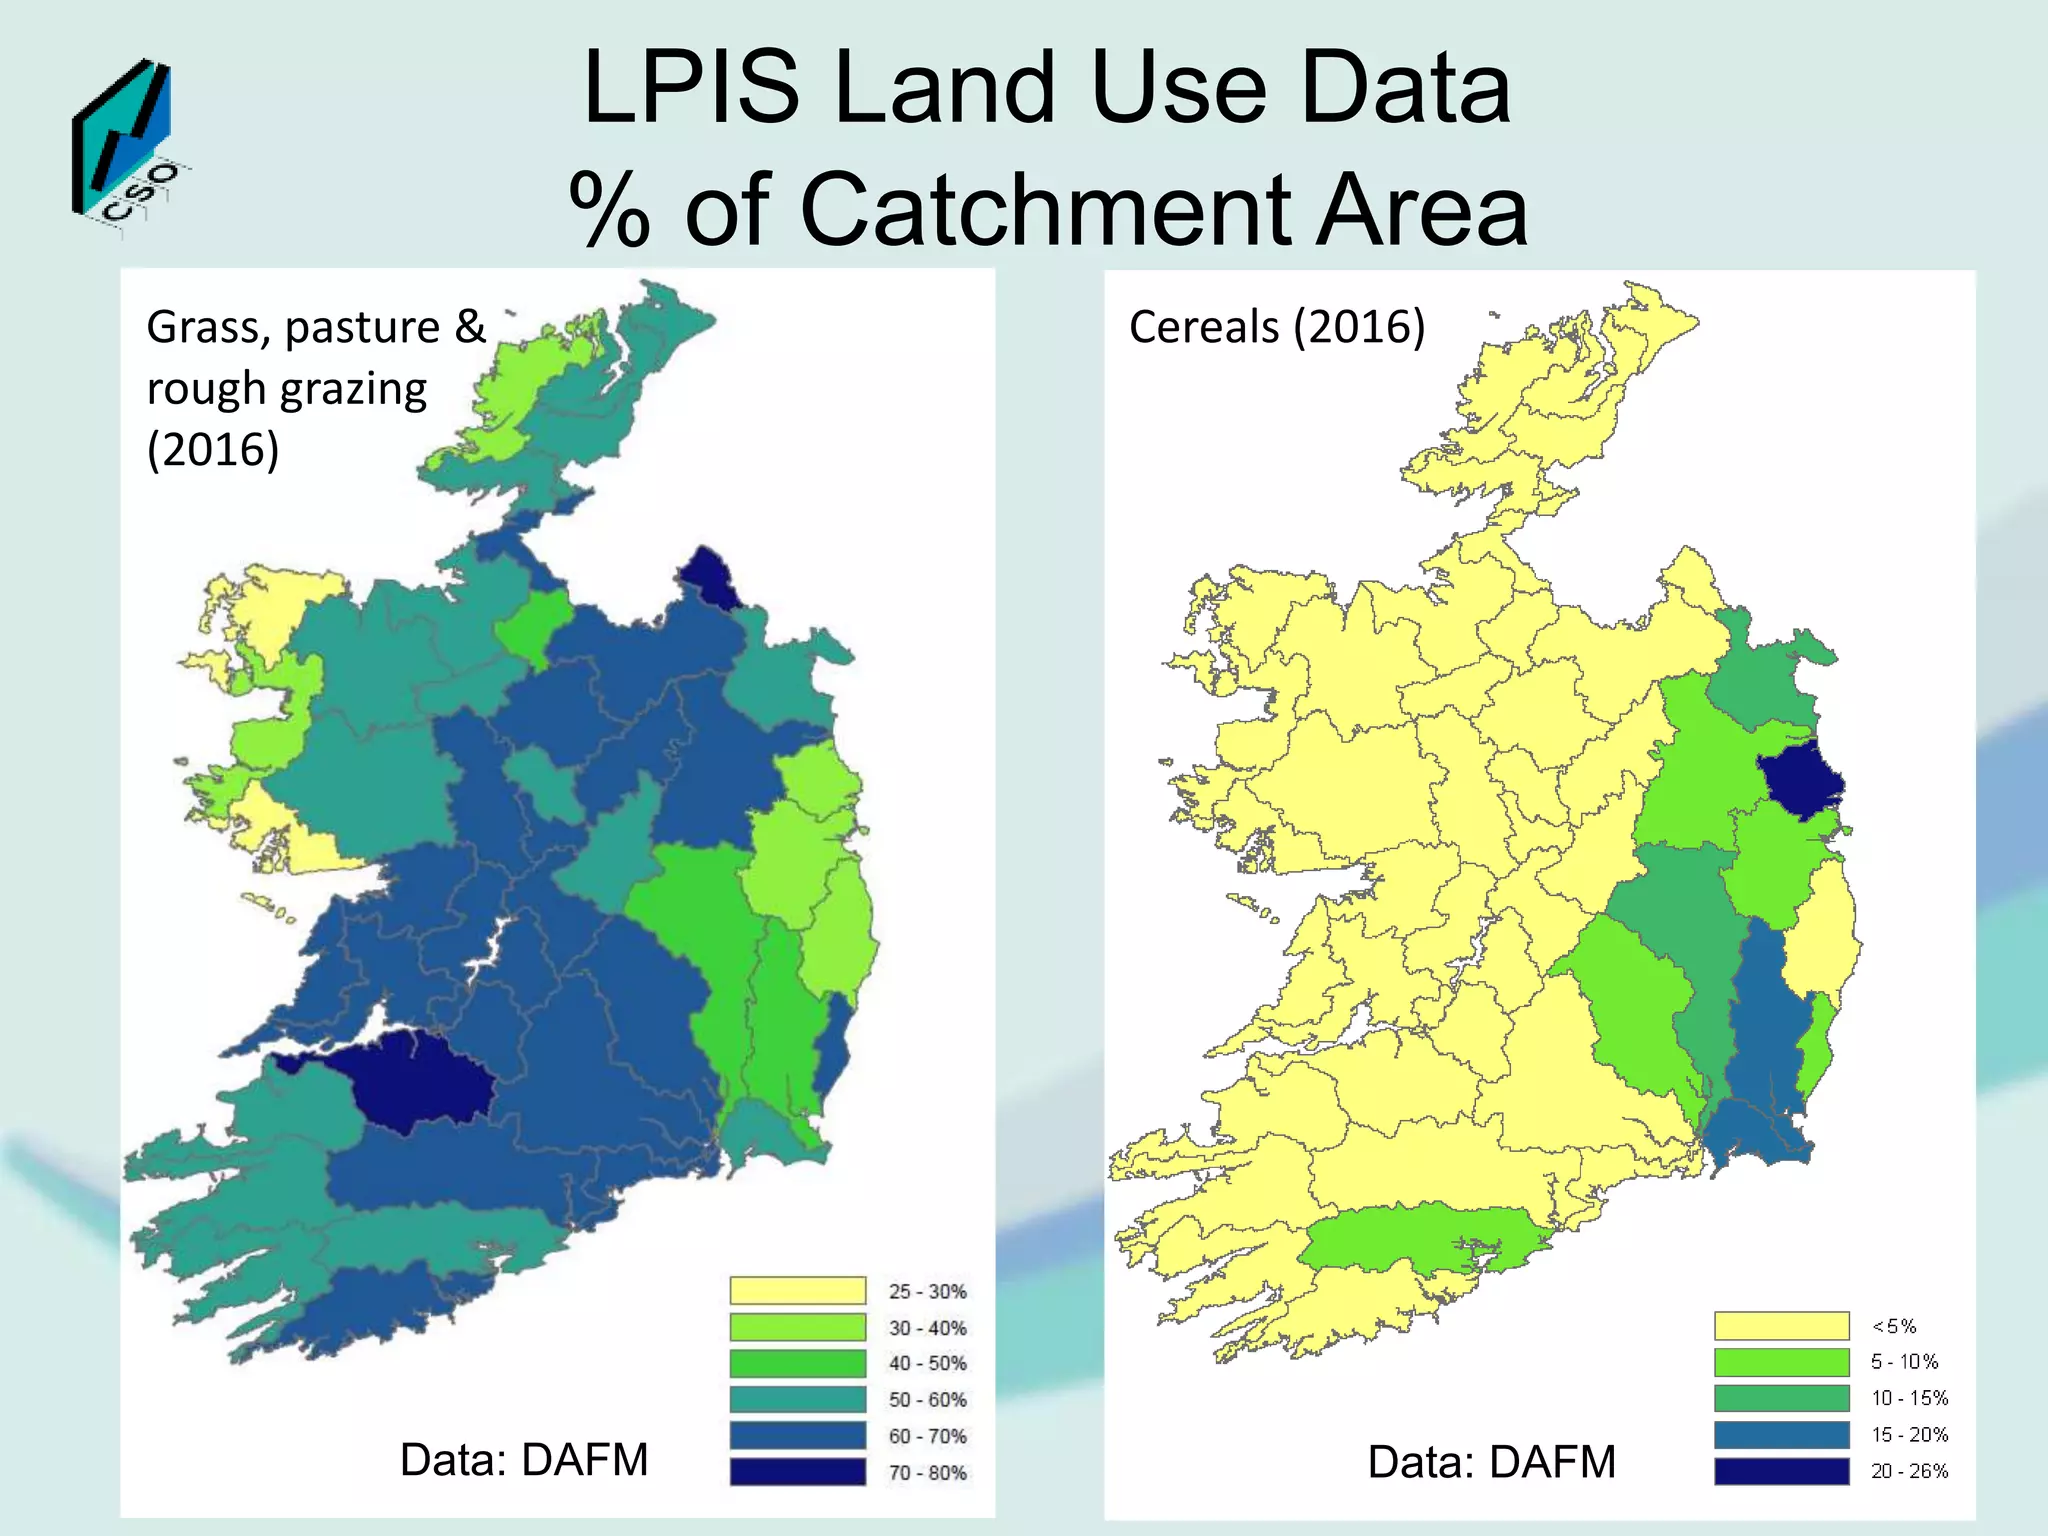
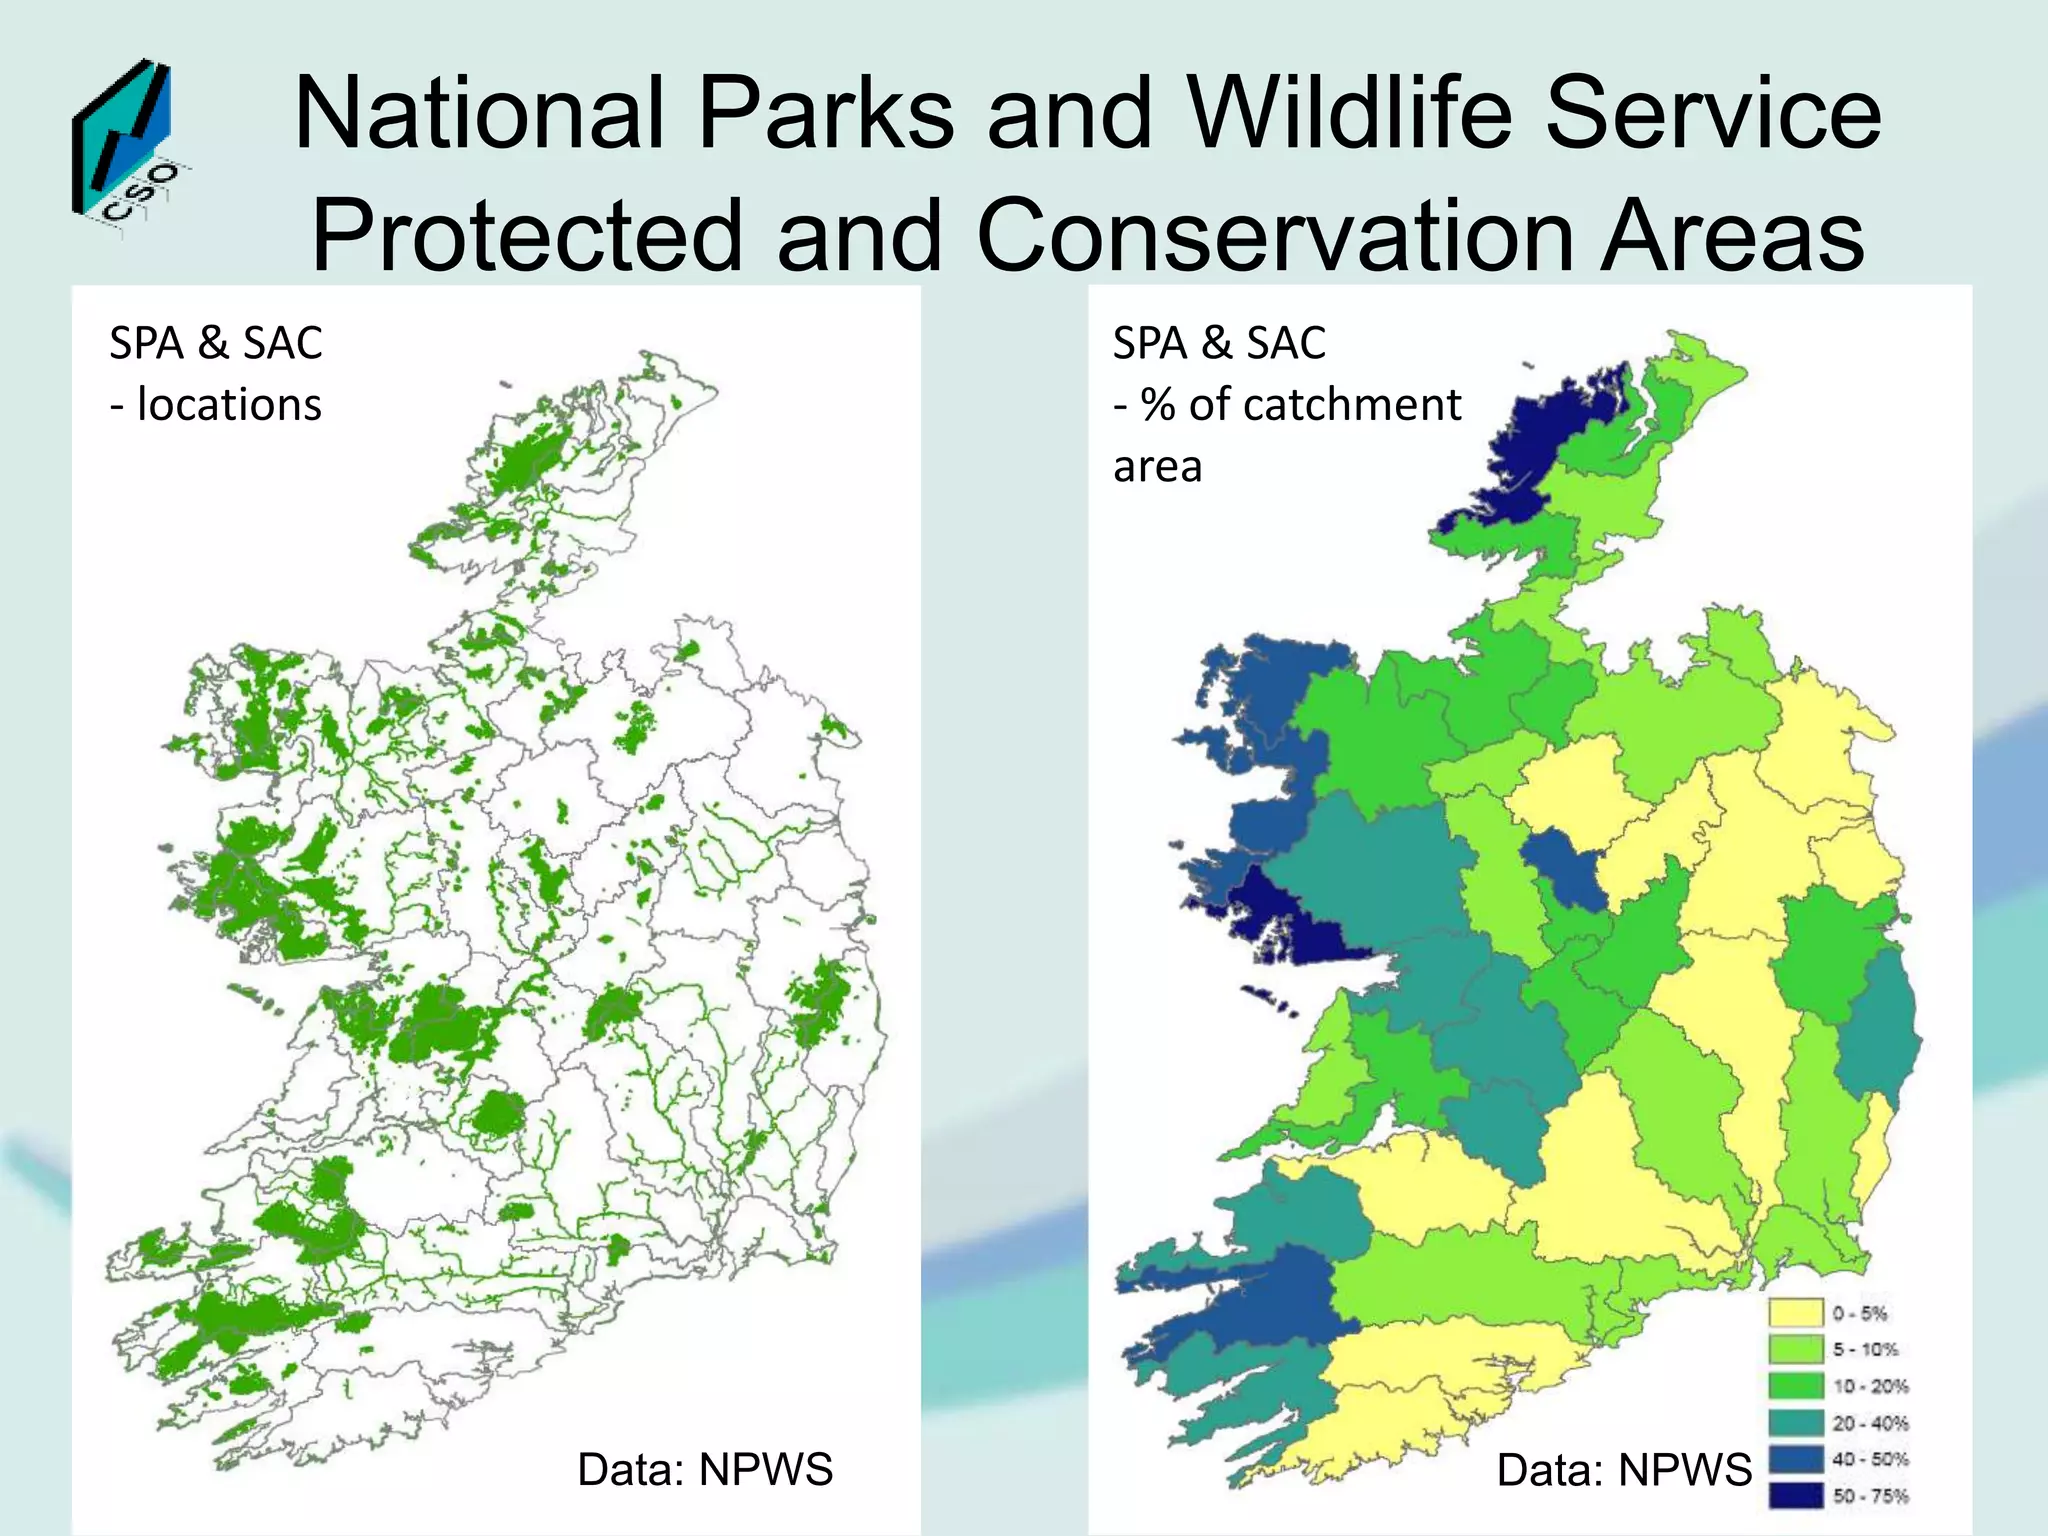
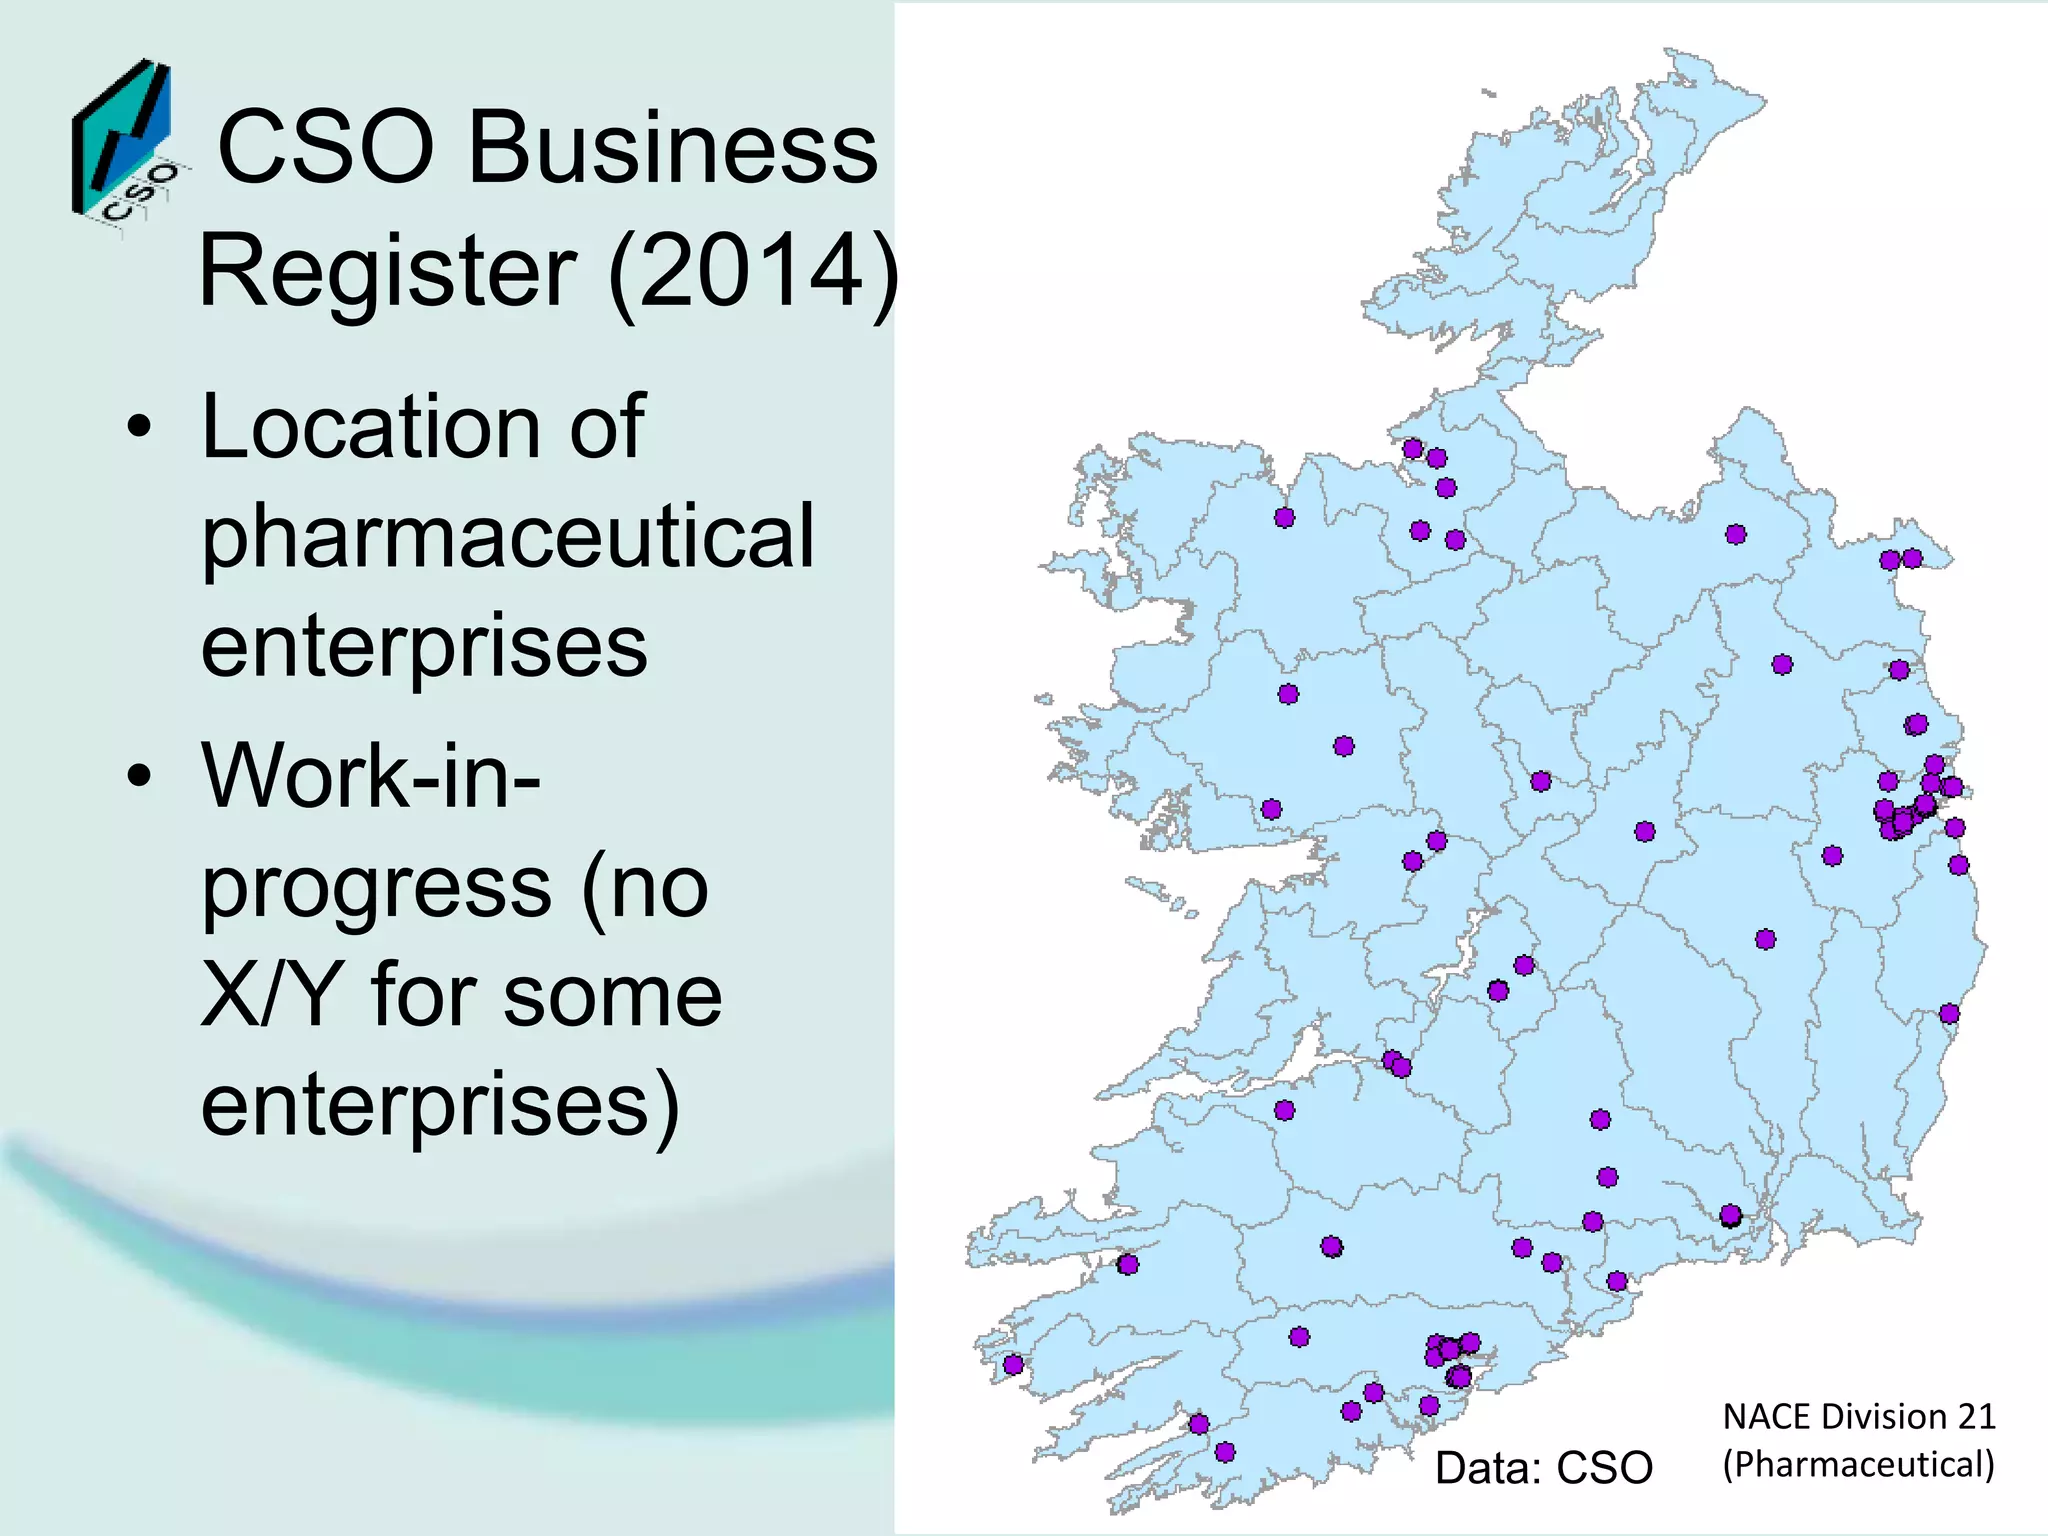
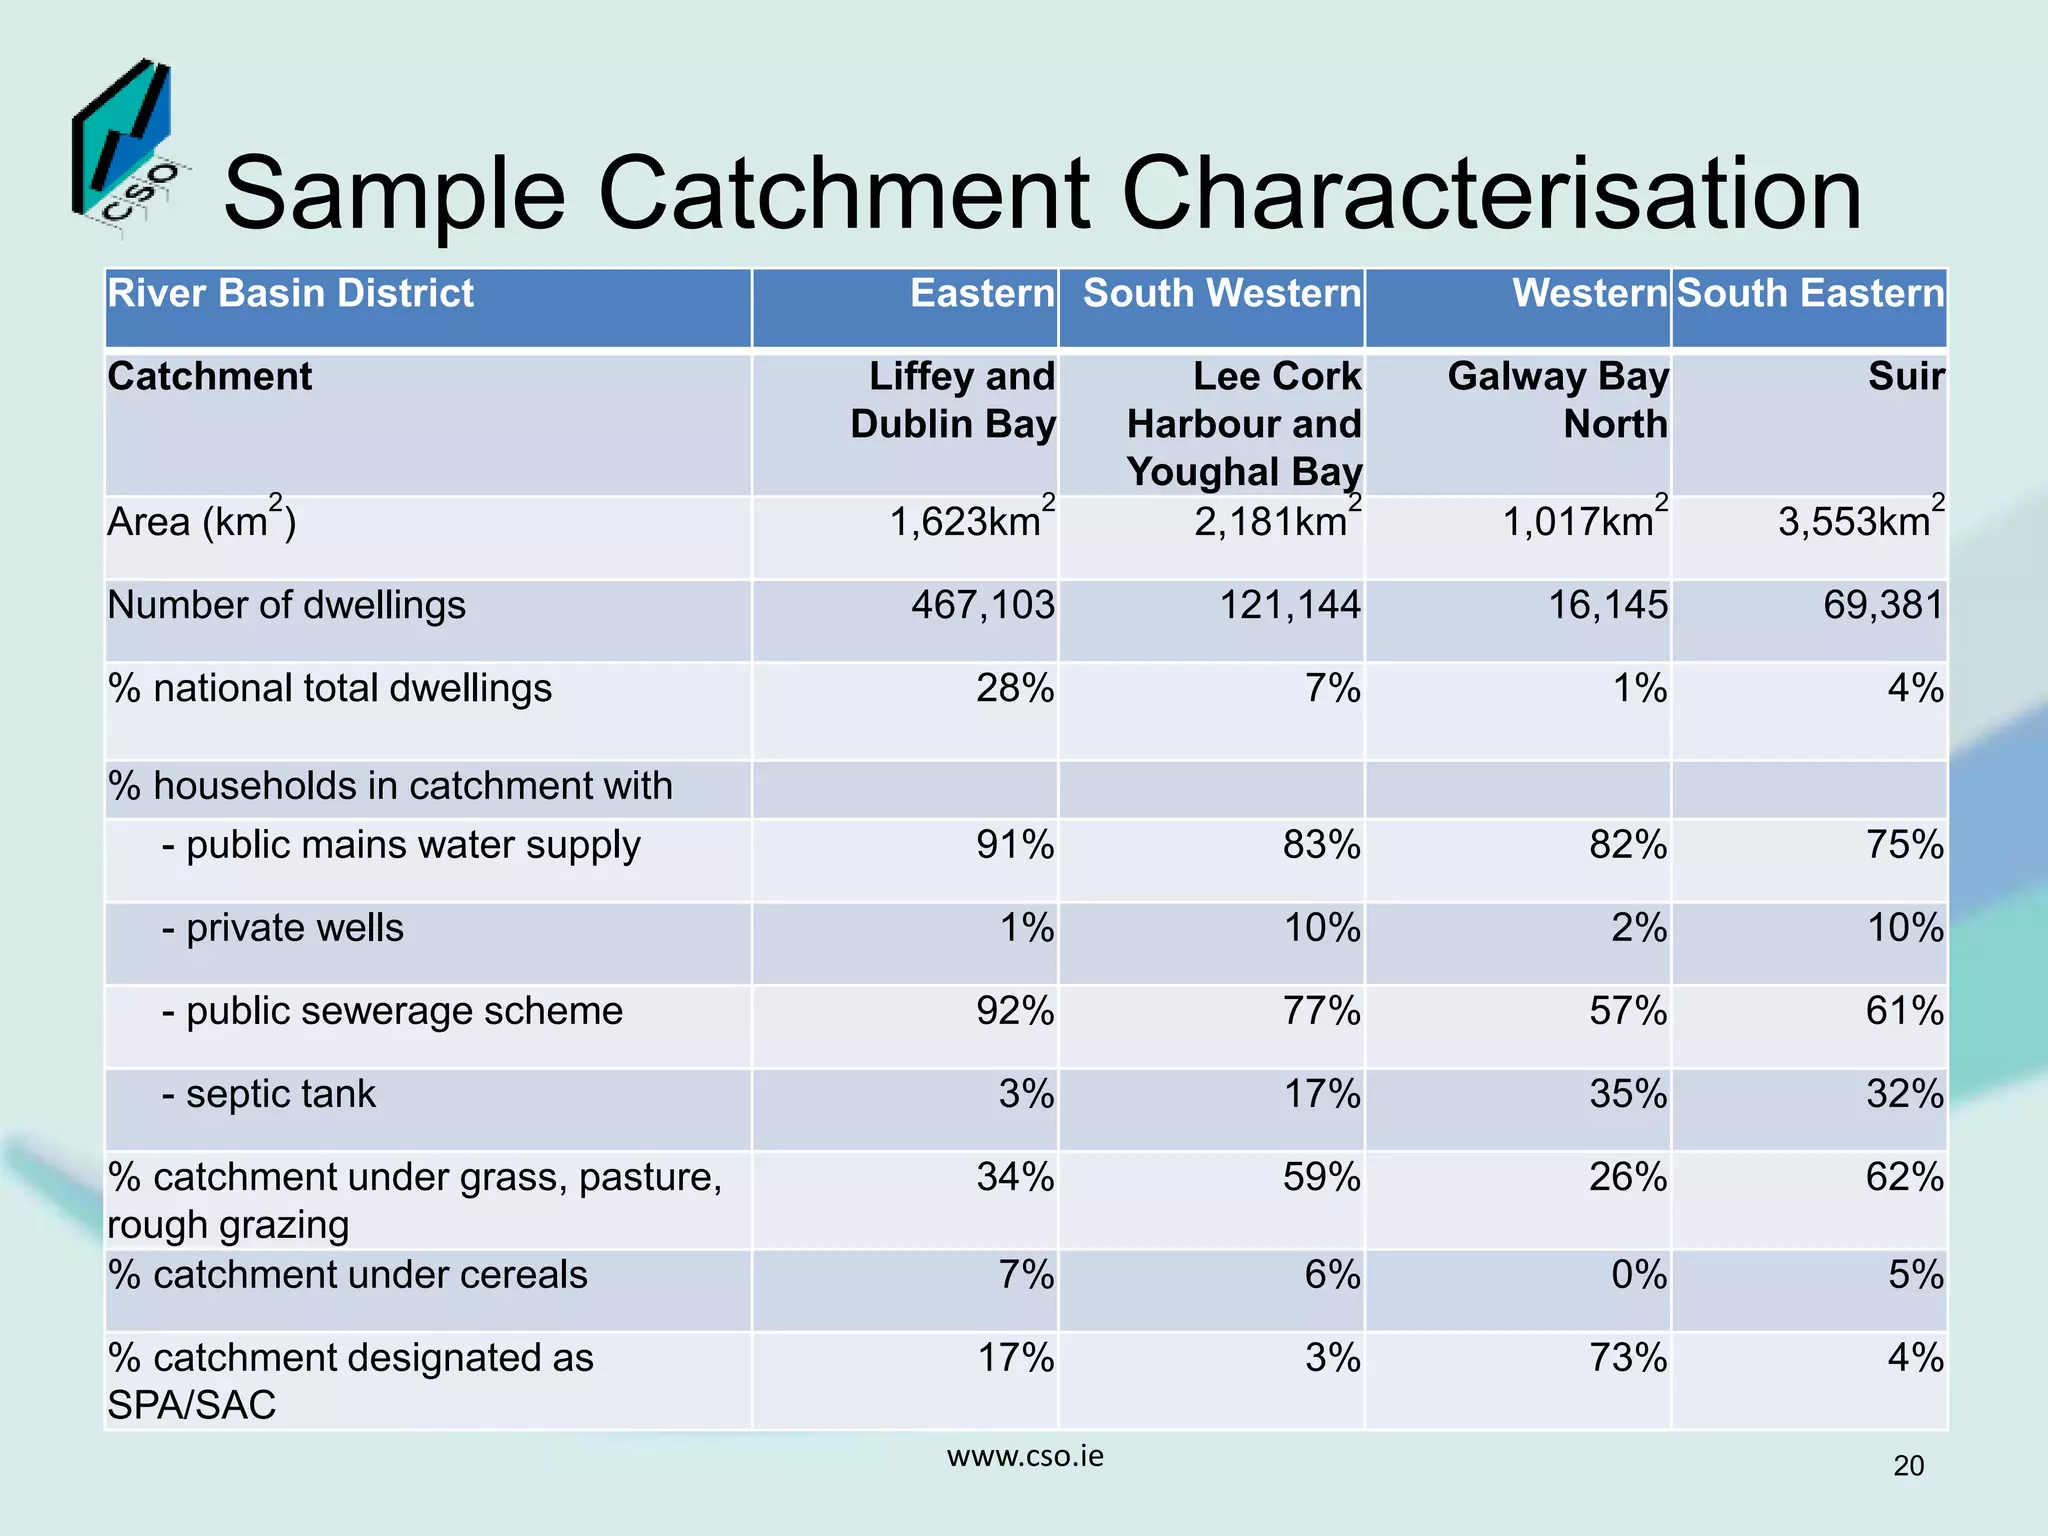
Use of GIS in CSO
Environment Statistics
Irish Organisation for Geographic Information
17th October 2016
Nova Sharkey nova.sharkey@cso.ie
Linh Trieu Nolan linh.nolan@cso.ie
www.cso.ie 1
CSO and GIS
• Historically, GIS was used by the Census
of Population area for fieldwork and results
visualisation
• For Census 2011 and 2016, each
enumerated household (including vacant
dwellings) has been linked to the
GeoDirectory, and so has X/Y coordinates
that can be used to compile environment-
related statistics
www.cso.ie 2
Environment Statistics and
Accounts Division
• Set up as a standalone CSO Division in
early 2015
• Initial focus was on producing statistics for
legal and voluntary environmental
accounts modules for Eurostat
• Use of GIS within the Division began in
2016
www.cso.ie 3
Land Cover and Land Use
Project
• First GIS-related project was a Eurostat
land cover and land use questionnaire at
NUTS 2 level – this was the first time CSO
has completed this questionnaire
• This work was completed using:
– 2012 CORINE land cover data from EPA
– OSi Prime2 data
– DAFM forest inventory data
www.cso.ie 4
Land Cover
(Corine 2012)
www.cso.ie 5Data: EPA
Land Cover (Corine 2012)
www.cso.ie 6
CODE TITLE
NUTS
IE0
NUTS
IE01
NUTS
IE02
C1 Artificial land 2% 1% 3%
C2 Cropland 6% 2% 9%
C3 Woodland 5% 5% 6%
C4 Shrubland 5% 6% 5%
C5 Grassland 62% 58% 66%
C6
Bare land, lichens, glaciers and permanent
snow 1% 1% 2%
C7 Water 4% 5% 2%
H Wetland 15% 21% 9%
Data: EPA
Example Land Use Categories
www.cso.ie 7
CODE 1 TITLE NUTS IE0
NUTS
IE01
NUTS
IE02
U1 Primary Production 14.4% 10.4% 19.7%
U1_1 Agriculture 5.0% 2.0% 8.8%
U1_2 Forestry 9.1% 8.3% 10.8%
U1_3 Mining and Quarrying 0.1% 0.1% 0.2%
U1_4_1 Aquaculture 0.2%
U3 Tertiary Production 0.3% 0.2% 0.5%
U3_4
Cultural Entertainment and Recreational Services 0.2% 0.1% 0.3%
U4_1_1 Road Transport 1.8% 1.5% 2.3%
U5 Residential Use (includes other compatible use) 3.8% 3.0% 5.1%
U6_3 Natural areas not in other economic use 0.8% 0.8% 0.9%
Data: OSI
Land Use Overview
• Land Use change over time
– Potential to analyse Land Parcel Information
System data to examine changes at field
level, crop location level, farm level, habitat
level etc.
– EPA and other institutions have already
carried out work in this area
– CSO could add to this through combining
Census and other data, e.g. location of new
dwellings
www.cso.ie 8
Continuing our GIS Work
• Land cover and land use is a good starting
point for compiling ecosystem accounts
• Need for CSO to identify and obtain
access to a time series of geocoded
microdata
• National Parks and Wildlife Service
(NPWS) have the lead role for Ireland on
ecosystem accounts
www.cso.ie 9
Geocoded Microdata
• Useful datasets for CSO archive include:
– Crop areas at parcel level and livestock numbers at farm
level
– Census of Population data at household level
– Forestry data at land parcel level
– Utilities data at meter level
– Administrative data from government departments and
agencies
– CSO Business Register data at local unit and enterprise
level
– Public expenditure on water supply and waste water
management at county level
– EPA water quality data
– EPA air quality data
www.cso.ie 10
Microdata Validation and
Geocoding
• Validation and completion of geocoding of
datasets
• Eircodes
– Common identifier to match datasets
– Most important public sector registers were
pre-coded
– Government departments and agencies need
to complete coding by collecting Eircodes of
non-unique addresses (around 35% of total)
www.cso.ie 11
Using the Microdata
• The datasets can be associated with digitised
areas such as water catchments, habitats,
special areas of conservation, etc.
• By relating the geocoded microdata to specific
areas, work on assessing the pressures on them
can begin
• Work with other data holders and users to
efficiently meet data needs
www.cso.ie 12
Water Catchments
• Water Framework Directive requirement
• DECLG and EPA have lead roles
• Inter-departmental Water Statistics Working Group
• EPA provided CSO with digitised water catchment
areas
• CSO Environment is analysing microdata to assist
with catchment characterisation:
– Crop areas
– Livestock numbers
– Numbers of households
– Enterprise locations by NACE sector and associated
employment data etc.
www.cso.ie 13
2011 Census of
Population – Dwellings
by Water Catchment
• 46 water catchments
• % of national total
number of dwellings
in each catchment
• 28% in Liffey and
Dublin Bay
Catchment
Data: CSO
Mains Water & Waste Water
% of Households in Catchment
Public mains
water supply
(2011)
Public
sewerage
scheme
(2011)
Data: CSOData: CSO
Private Wells & Septic Tanks
% of Households in Catchment
Septic tanks
(2011)
Private wells
(2011)
Data: CSO Data: CSO
LPIS Land Use Data
% of Catchment Area
Grass, pasture &
rough grazing
(2016)
Cereals (2016)
Data: DAFMData: DAFM
National Parks and Wildlife Service
Protected and Conservation Areas
18
SPA & SAC
- locations
SPA & SAC
- % of catchment
area
Data: NPWSData: NPWS
CSO Business
Register (2014)
• Location of
pharmaceutical
enterprises
• Work-in-
progress (no
X/Y for some
enterprises)
NACE Division 21
(Pharmaceutical)Data: CSO
Sample Catchment Characterisation
River Basin District Eastern South Western Western South Eastern
Catchment Liffey and
Dublin Bay
Lee Cork
Harbour and
Youghal Bay
Galway Bay
North
Suir
Area (km
2
) 1,623km
2
2,181km
2
1,017km
2
3,553km
2
Number of dwellings 467,103 121,144 16,145 69,381
% national total dwellings 28% 7% 1% 4%
% households in catchment with
- public mains water supply 91% 83% 82% 75%
- private wells 1% 10% 2% 10%
- public sewerage scheme 92% 77% 57% 61%
- septic tank 3% 17% 35% 32%
% catchment under grass, pasture,
rough grazing
34% 59% 26% 62%
% catchment under cereals 7% 6% 0% 5%
% catchment designated as
SPA/SAC
17% 3% 73% 4%
www.cso.ie 20
Definition of Natural Capital
… biodiversity, including ecosystems that
provide essential goods and services, from
fertile soil and multi-functional forests to
productive land and seas, from good quality
fresh water and clean air to pollination and
climate regulation and protection against
natural disasters
www.cso.ie 21
EU MAES Project
• EU Mapping and Assessment of
Ecosystem Services project (MAES)
• National Parks and Wildlife Service
(NPWS) has lead role - CSO asked to
assist
• NPWS has established group to map
Ireland’s terrestrial and marine systems
(National Land Cover and Habitat Mapping
project)
www.cso.ie 22
Ecosystem Accounts
• Measures depletion and degradation of
our natural assets from economic activity
• Concepts and methodologies are still
being developed
• MAES project is a step towards compiling
ecosystem accounts
www.cso.ie 23
Ecosystem Accounts
• Assets
– extent account (changes in areas)
– condition account by ecosystem type
(biodiversity, carbon, soils, vegetation, water)
– monetary account (net present value)
• Services - physical and monetary supply and
use tables
• Compiling ecosystem accounts requires use
of very high resolution imagery e.g. 2.5
metres
www.cso.ie 24
Compiling Ecosystem Accounts
• MAES work will develop with bottom-up
approach using local area studies
• National level work may require more top-
down approach using imagery, aerial
photos, and geocoded data
• Need for both approaches during
development of methodology
www.cso.ie 25
Conclusions
• CSO needs staff with GIS skills
• Many potential uses for geocoded data in
environment-related statistics
• Needs inter-departmental, inter-agency, and
subject-matter experts collaboration
• Needs broad range of geocoded microdata
• Need to archive geocoded microdata for long
time-series analyses of land cover and land
use changes, and pressures from economic
and social activity
www.cso.ie 26
Thanks
• Thanks to all data providers
• Thank you for listening
www.cso.ie 27

Use of Geographic Information Systems (GIS) in Central Statistics Office (CSO) Environment Statistics

  • 1.
    Use of GISin CSO Environment Statistics Irish Organisation for Geographic Information 17th October 2016 Nova Sharkey nova.sharkey@cso.ie Linh Trieu Nolan linh.nolan@cso.ie www.cso.ie 1
  • 2.
    CSO and GIS •Historically, GIS was used by the Census of Population area for fieldwork and results visualisation • For Census 2011 and 2016, each enumerated household (including vacant dwellings) has been linked to the GeoDirectory, and so has X/Y coordinates that can be used to compile environment- related statistics www.cso.ie 2
  • 3.
    Environment Statistics and AccountsDivision • Set up as a standalone CSO Division in early 2015 • Initial focus was on producing statistics for legal and voluntary environmental accounts modules for Eurostat • Use of GIS within the Division began in 2016 www.cso.ie 3
  • 4.
    Land Cover andLand Use Project • First GIS-related project was a Eurostat land cover and land use questionnaire at NUTS 2 level – this was the first time CSO has completed this questionnaire • This work was completed using: – 2012 CORINE land cover data from EPA – OSi Prime2 data – DAFM forest inventory data www.cso.ie 4
  • 5.
  • 6.
    Land Cover (Corine2012) www.cso.ie 6 CODE TITLE NUTS IE0 NUTS IE01 NUTS IE02 C1 Artificial land 2% 1% 3% C2 Cropland 6% 2% 9% C3 Woodland 5% 5% 6% C4 Shrubland 5% 6% 5% C5 Grassland 62% 58% 66% C6 Bare land, lichens, glaciers and permanent snow 1% 1% 2% C7 Water 4% 5% 2% H Wetland 15% 21% 9% Data: EPA
  • 7.
    Example Land UseCategories www.cso.ie 7 CODE 1 TITLE NUTS IE0 NUTS IE01 NUTS IE02 U1 Primary Production 14.4% 10.4% 19.7% U1_1 Agriculture 5.0% 2.0% 8.8% U1_2 Forestry 9.1% 8.3% 10.8% U1_3 Mining and Quarrying 0.1% 0.1% 0.2% U1_4_1 Aquaculture 0.2% U3 Tertiary Production 0.3% 0.2% 0.5% U3_4 Cultural Entertainment and Recreational Services 0.2% 0.1% 0.3% U4_1_1 Road Transport 1.8% 1.5% 2.3% U5 Residential Use (includes other compatible use) 3.8% 3.0% 5.1% U6_3 Natural areas not in other economic use 0.8% 0.8% 0.9% Data: OSI
  • 8.
    Land Use Overview •Land Use change over time – Potential to analyse Land Parcel Information System data to examine changes at field level, crop location level, farm level, habitat level etc. – EPA and other institutions have already carried out work in this area – CSO could add to this through combining Census and other data, e.g. location of new dwellings www.cso.ie 8
  • 9.
    Continuing our GISWork • Land cover and land use is a good starting point for compiling ecosystem accounts • Need for CSO to identify and obtain access to a time series of geocoded microdata • National Parks and Wildlife Service (NPWS) have the lead role for Ireland on ecosystem accounts www.cso.ie 9
  • 10.
    Geocoded Microdata • Usefuldatasets for CSO archive include: – Crop areas at parcel level and livestock numbers at farm level – Census of Population data at household level – Forestry data at land parcel level – Utilities data at meter level – Administrative data from government departments and agencies – CSO Business Register data at local unit and enterprise level – Public expenditure on water supply and waste water management at county level – EPA water quality data – EPA air quality data www.cso.ie 10
  • 11.
    Microdata Validation and Geocoding •Validation and completion of geocoding of datasets • Eircodes – Common identifier to match datasets – Most important public sector registers were pre-coded – Government departments and agencies need to complete coding by collecting Eircodes of non-unique addresses (around 35% of total) www.cso.ie 11
  • 12.
    Using the Microdata •The datasets can be associated with digitised areas such as water catchments, habitats, special areas of conservation, etc. • By relating the geocoded microdata to specific areas, work on assessing the pressures on them can begin • Work with other data holders and users to efficiently meet data needs www.cso.ie 12
  • 13.
    Water Catchments • WaterFramework Directive requirement • DECLG and EPA have lead roles • Inter-departmental Water Statistics Working Group • EPA provided CSO with digitised water catchment areas • CSO Environment is analysing microdata to assist with catchment characterisation: – Crop areas – Livestock numbers – Numbers of households – Enterprise locations by NACE sector and associated employment data etc. www.cso.ie 13
  • 14.
    2011 Census of Population– Dwellings by Water Catchment • 46 water catchments • % of national total number of dwellings in each catchment • 28% in Liffey and Dublin Bay Catchment Data: CSO
  • 15.
    Mains Water &Waste Water % of Households in Catchment Public mains water supply (2011) Public sewerage scheme (2011) Data: CSOData: CSO
  • 16.
    Private Wells &Septic Tanks % of Households in Catchment Septic tanks (2011) Private wells (2011) Data: CSO Data: CSO
  • 17.
    LPIS Land UseData % of Catchment Area Grass, pasture & rough grazing (2016) Cereals (2016) Data: DAFMData: DAFM
  • 18.
    National Parks andWildlife Service Protected and Conservation Areas 18 SPA & SAC - locations SPA & SAC - % of catchment area Data: NPWSData: NPWS
  • 19.
    CSO Business Register (2014) •Location of pharmaceutical enterprises • Work-in- progress (no X/Y for some enterprises) NACE Division 21 (Pharmaceutical)Data: CSO
  • 20.
    Sample Catchment Characterisation RiverBasin District Eastern South Western Western South Eastern Catchment Liffey and Dublin Bay Lee Cork Harbour and Youghal Bay Galway Bay North Suir Area (km 2 ) 1,623km 2 2,181km 2 1,017km 2 3,553km 2 Number of dwellings 467,103 121,144 16,145 69,381 % national total dwellings 28% 7% 1% 4% % households in catchment with - public mains water supply 91% 83% 82% 75% - private wells 1% 10% 2% 10% - public sewerage scheme 92% 77% 57% 61% - septic tank 3% 17% 35% 32% % catchment under grass, pasture, rough grazing 34% 59% 26% 62% % catchment under cereals 7% 6% 0% 5% % catchment designated as SPA/SAC 17% 3% 73% 4% www.cso.ie 20
  • 21.
    Definition of NaturalCapital … biodiversity, including ecosystems that provide essential goods and services, from fertile soil and multi-functional forests to productive land and seas, from good quality fresh water and clean air to pollination and climate regulation and protection against natural disasters www.cso.ie 21
  • 22.
    EU MAES Project •EU Mapping and Assessment of Ecosystem Services project (MAES) • National Parks and Wildlife Service (NPWS) has lead role - CSO asked to assist • NPWS has established group to map Ireland’s terrestrial and marine systems (National Land Cover and Habitat Mapping project) www.cso.ie 22
  • 23.
    Ecosystem Accounts • Measuresdepletion and degradation of our natural assets from economic activity • Concepts and methodologies are still being developed • MAES project is a step towards compiling ecosystem accounts www.cso.ie 23
  • 24.
    Ecosystem Accounts • Assets –extent account (changes in areas) – condition account by ecosystem type (biodiversity, carbon, soils, vegetation, water) – monetary account (net present value) • Services - physical and monetary supply and use tables • Compiling ecosystem accounts requires use of very high resolution imagery e.g. 2.5 metres www.cso.ie 24
  • 25.
    Compiling Ecosystem Accounts •MAES work will develop with bottom-up approach using local area studies • National level work may require more top- down approach using imagery, aerial photos, and geocoded data • Need for both approaches during development of methodology www.cso.ie 25
  • 26.
    Conclusions • CSO needsstaff with GIS skills • Many potential uses for geocoded data in environment-related statistics • Needs inter-departmental, inter-agency, and subject-matter experts collaboration • Needs broad range of geocoded microdata • Need to archive geocoded microdata for long time-series analyses of land cover and land use changes, and pressures from economic and social activity www.cso.ie 26
  • 27.
    Thanks • Thanks toall data providers • Thank you for listening www.cso.ie 27