Downloaded 29 times


![7
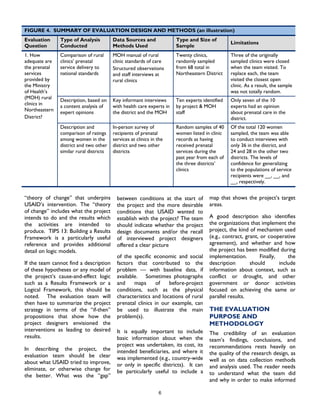
Formats and page limits;
Requirements for datasets, if
primary data has been
collected;
A requirement to submit all
evaluations to the Development
Experience Clearing house for
archiving - this is the
responsibility of the evaluation
contractor; and
Other needs for
communicating, marketing and
disseminating results that are
the responsibility of the
evaluation team.
The SOW should specify when
working drafts are to be
submitted for review, the time
frame allowed for USAID review
and comment, and the time
frame to revise and submit the
final report.
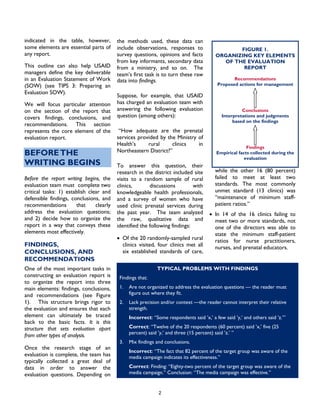
11. INCLUDE A BUDGET
With the budget section, the
SOW comes full circle. As stated,
budget considerations have to be
part of the decision making
process from the beginning.
The budget is a product of the
questions asked, human
resources needed, logistical and
administrative support required,
and the time needed to produce
a high quality, rigorous and
useful evaluation report in the
most efficient and timely manner.
It is essential for contractors to
understand the quality, validity
and rigor required so they can
develop a responsive budget that
will meet the standards set forth
in the SOW.
For more information:
TIPS publications are available online at [insert website].
Acknowledgements:
Our thanks to those whose experience and insights helped shape this publication including USAID‟s
Office of Management Policy, Budget and Performance (MPBP). This publication was written by Richard
Blue, Ph.D. of Management Systems International.
Comments regarding this publication can be directed to:
Gerald Britan, Ph.D.
Tel: (202) 712-1158
gbritan@usaid.gov
Contracted under RAN-M-00-04-00049-A-FY0S-84
Integrated Managing for Results II](https://image.slidesharecdn.com/usaid-tipsseries-150106045150-conversion-gate02/85/Usaid-tips-series-18-320.jpg)

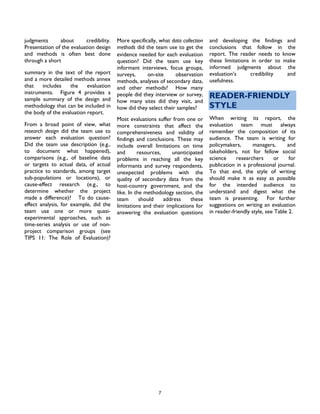
![References Cited
M. Bamberger, J. Rugh, and L. Mabry, Real World Evaluation. Working Under Budget, Time, Data, and Political
Constraints. Sage Publications, Thousand Oaks, CA, 2006.
T. Greenbaum, Moderating Focus Groups: A Practical Guide for Group Facilitation. Sage Publications, Thousand Oaks,
CA, 2000.
K. Kumar, “Conducting Mini Surveys in Developing Countries,” USAID Program Design and Evaluation Methodology
Report No. 15, 1990 (revised 2006).
K. Kumar, “Conducting Group Interviews in Developing Countries,” USAID Program Design and Evaluation
Methodology Report No. 8, 1987.
K. Kumar, “Conducting Key Informant Interviews in Developing Countries,” USAID Program Design and Evaluation
Methodology Report No. 13, 1989.
For more information:
TIPS publications are available online at [insert website].
Acknowledgements:
Our thanks to those whose experience and insights helped shape this publication including USAID’s Office of
Management Policy, Budget and Performance (MPBP). This publication was authored by Patricia Vondal, PhD., of
Management Systems International.
Comments regarding this publication can be directed to:
Gerald Britan, Ph.D.
Tel: (202) 712-1158
gbritan@usaid.gov
Contracted under RAN-M-00-04-00049-A-FY0S-84
Integrated Managing for Results II
6](https://image.slidesharecdn.com/usaid-tipsseries-150106045150-conversion-gate02/85/Usaid-tips-series-28-320.jpg)
![12
For more information:
TIPS publications are available online at [insert website].
Acknowledgements:
Our thanks to those whose experience and insights helped shape this publication, including Gerry Britan
and Subhi Mehdi of USAID’s Office of Management Policy, Budget and Performance (MPBP). This
publication was updated by Michelle Adams-Matson of Management Systems International.
Comments can be directed to:
Gerald Britan, Ph.D.
Tel: (202) 712-1158
gbritan@usaid.gov
Contracted under RAN-M-00-04-00049-A-FY0S-84
Integrated Managing for Results II](https://image.slidesharecdn.com/usaid-tipsseries-150106045150-conversion-gate02/85/Usaid-tips-series-40-320.jpg)

![For more information:
TIPS publications are available online at [insert website].
Acknowledgements:
Our thanks to those whose experience and insights helped shape this publication, including Gerry Britan and
Subhi Mehdi of USAID’s Office of Management Policy, Budget and Performance (MPBP). This publication was
updated by Jill Tirnauer of Management Systems International.
Comments can be directed to:
Gerald Britan, Ph.D.
Tel: (202) 712-1158
gbritan@usaid.gov
Contracted under RAN-M-00-04-00049-A-FY0S-84
Integrated Managing for Results II
7](https://image.slidesharecdn.com/usaid-tipsseries-150106045150-conversion-gate02/85/Usaid-tips-series-51-320.jpg)


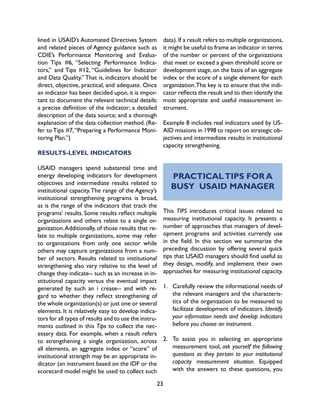
![8
resources were to be
expended. Sometimes
preliminary estimates may be
obtainable, but they should be
clearly flagged as such and
replaced as soon as possible
as the final data become
available from the source.
The following example
demonstrates issues related to
timeliness:
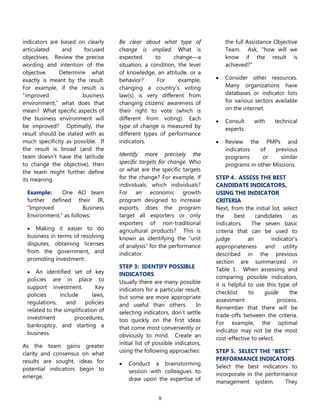
Result: Primary school
attrition in a targeted
region reduced.
Indicator: Rate of
student attrition at
targeted schools.
In August 2009, the Ministry
of Education published full
enrollment analysis for the
2007 school year.
In this case, currency is a
problem because there is a 2
year time lag for these data.
While it is optimal to collect
and report data based on the
U.S. Government fiscal year,
there are often a number of
practical challenges in doing
so. We recognize that data
may come from preceding
calendar or fiscal years.
Moreover, data often measure
results for the specific point in
time that the data were
collected, not from September
to September, or December to
December.
Often the realities of the
recipient country context will
dictate the appropriate timing
of the data collection effort,
rather than the U.S. fiscal year.
For example, if agricultural
yields are at their peak in July,
then data collection efforts to
measure yields should be
conducted in July of each
year. Moreover, to the extent
that USAID relies on
secondary data sources and
partners for data collection,
we may not be able to dictate
exact timing
ASSESSING DATA
QUALITY
Approaches and steps for how
to assess data quality are
discussed in more detail in
TIPS 18: Conducting Data
Quality Assessments. USAID
policy requires managers to
understand the strengths and
weaknesses of the data they
use on an on-going basis. In
addition, a Data Quality
Assessment (DQA) must be
conducted at least once every
3 years for those data
reported to Washington (ADS
203.3.5.2).
For more information:
TIPS publications are available online at [insert website]
Acknowledgements:
Our thanks to those whose experience and insights helped shape this publication including Gerry Britan
and Subhi Mehdi of USAID’s Office of Management Policy, Budget and Performance (MPBP). This
publication was updated by Michelle Adams-Matson of Management Systems International (MSI).
Comments regarding this publication can be directed to:
Gerald Britan, Ph.D.
Tel: (202) 712-1158
gbritan@usaid.gov
Contracted under RAN-M-00-04-00049-A-FY0S-84
Integrated Managing for Results II](https://image.slidesharecdn.com/usaid-tipsseries-150106045150-conversion-gate02/85/Usaid-tips-series-71-320.jpg)
![12
For more information:
TIPS publications are available online at [insert website].
Acknowledgements:
Our thanks to those whose experience and insights helped shape this publication including Gerry Britan
and Subhi Mehdi of USAID’s Office of Management Policy, Budget and Performance (MPBP). This
publication was updated by Michelle Adams-Matson, of Management Systems International.
Comments can be directed to:
Gerald Britan, Ph.D.
Tel: (202) 712-1158
gbritan@usaid.gov
Contracted under RAN-M-00-04-00049-A-FY0S-84
Integrated Managing for Results II](https://image.slidesharecdn.com/usaid-tipsseries-150106045150-conversion-gate02/85/Usaid-tips-series-83-320.jpg)

![2
Mabry [2006] for further
explanation and descriptions of
triangulation strategies used in
evaluations.)
When reliance on one method
alone may not be sufficient to
answer all aspects of each
evaluation question.
When the data collected from
one method can help interpret
findings from the analysis of
data collected from another
method. For example,
qualitative data from in-depth
interviews or focus groups can
help interpret statistical
patterns from quantitative data
collected through a random-
sample survey. This yields a
richer analysis and can also
provide a better understanding
of the context in which a
program operates.
There are a number of additional
benefits derived from using a mix
of methods in any given
evaluation.
Using mixed-methods can
more readily yield examples of
unanticipated changes or
responses.
Mixed-method evaluations
have the potential of surfacing
other key issues and providing
a deeper understanding of
program context that should
be considered when analyzing
data and developing findings
and conclusions.
Mixed-method evaluations
often yield a wider range of
points of view that might
otherwise be missed.
DETERMINING
WHICH METHODS TO
USE
In a mixed-method evaluation,
the evaluator may use a
combination of methods, such as
a survey using comparison
groups in a quasi-experimental or
experimental design, a review of
key documents, a reanalysis of
government statistics, in-depth
interviews with key informants,
focus groups, and structured
observations. The selection of
methods, or mix, depends on the
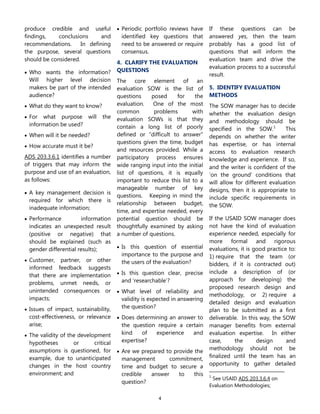
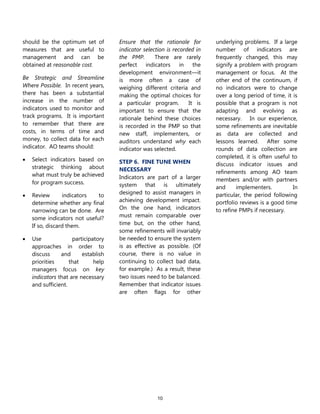
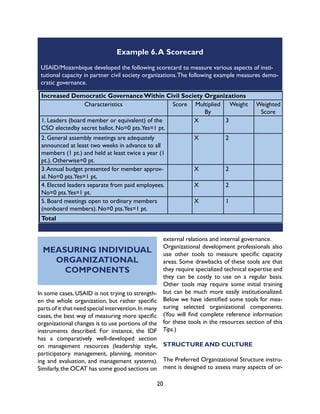
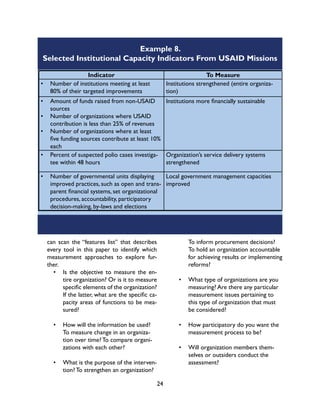
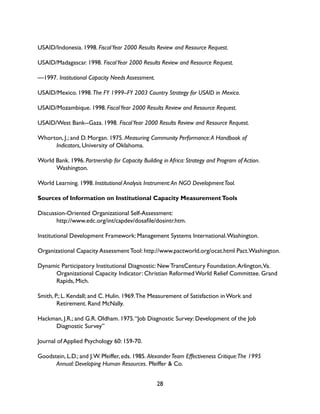
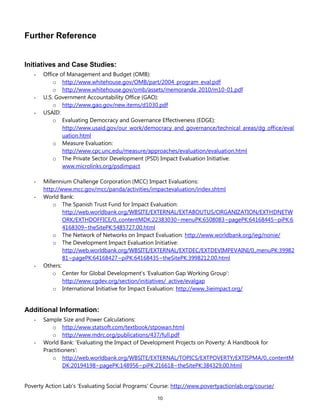
Key Steps in Developing a Mixed-Method Evaluation Design and Analysis
Strategy
1. In order to determine the methods that will be employed, carefully review the purpose of the evaluation and the
primary evaluation questions. Then select the methods that will be the most useful and cost-effective to answer
each question in the time period allotted for the evaluation. Sometimes it is apparent that there is one method
that can be used to answer most, but not all, aspects of the evaluation question.
2. Select complementary methods to cover different aspects of the evaluation question (for example, the how and
why issues) that the first method selected cannot alone answer, and/or to enrich and strengthen data analysis
and interpretation of findings.
3. In situations when the strength of findings and conclusions for a key question is absolutely essential, employ a
triangulation strategy. What additional data sources and methods can be used to obtain information to answer
the same question in order to increase the validity of findings from the first method selected?
4. Re-examine the purpose of the evaluation and the methods initially selected to ensure that all aspects of the
primary evaluation questions are covered thoroughly. This is the basis of the evaluation design. Develop data
collection instruments accordingly.
5. Design a data analysis strategy to analyze the data that will be generated from the selection of methods chosen
for the evaluation.
6. Ensure that the evaluation team composition includes members that are well-versed and experienced in applying
each type of data collection method and subsequent analysis.
7. Ensure that there is sufficient time in the evaluation statement of work for evaluators to fully analyze data
generated from each method employed and to realize the benefits of conducting a mixed method evaluation.](https://image.slidesharecdn.com/usaid-tipsseries-150106045150-conversion-gate02/85/Usaid-tips-series-114-320.jpg)
![9
For more information:
TIPS publications are available online at [insert website].
Acknowledgements:
Our thanks to those whose experience and insights helped shape this publication including USAID’s
Office of Management Policy, Budget and Performance (MPBP). This publication was written by Dr.
Patricia Vondal of Management Systems International.
Comments regarding this publication can be directed to:
Gerald Britan, Ph.D.
Tel: (202) 712-1158
gbritan@usaid.gov
Contracted under RAN-M-00-04-00049-A-FY0S-84
Integrated Managing for Results II](https://image.slidesharecdn.com/usaid-tipsseries-150106045150-conversion-gate02/85/Usaid-tips-series-121-320.jpg)
![11
For more information:
TIPS publications are available online at [insert website].
Acknowledgements:
Our thanks to those whose experience and insights helped shape this publication including Gerry Britan and
Subhi Mehdi of USAID’s Office of Management Policy, Budget and Performance (MPBP). This publication was
written by Larry Beyna of Management Systems International (MSI).
Comments regarding this publication can be directed to:
Gerald Britan, Ph.D.
Tel: (202) 712-1158
gbritan@usaid.gov
Contracted under RAN-M-00-04-00049-A-FY0S-84
Integrated Managing for Results II](https://image.slidesharecdn.com/usaid-tipsseries-150106045150-conversion-gate02/85/Usaid-tips-series-132-320.jpg)
![9
For more information:
TIPS publications are available online at [insert website].
Acknowledgements:
Our thanks to those whose experience and insights helped shape this publication including Gerry Britan and
Subhi Mehdi of USAID’s Office of Management Policy, Budget and Performance (MPBP). This publication was
written by Michelle Adams-Matson, of Management Systems International.
Comments can be directed to:
Gerald Britan, Ph.D.
Tel: (202) 712-1158
gbritan@usaid.gov
Contracted under RAN-M-00-04-00049-A-FY0S-84
Integrated Managing for Results II](https://image.slidesharecdn.com/usaid-tipsseries-150106045150-conversion-gate02/85/Usaid-tips-series-141-320.jpg)

![11
For more information:
TIPS publications are available online at [insert website]
Acknowledgements:
Our thanks to those whose experience and insights helped shape this publication including USAID’s
Office of Management Policy, Budget and Performance (MPBP). This publication was written by Michael
Duthie of Management Systems International.
Comments regarding this publication can be directed to:
Gerald Britan, Ph.D.
Tel: (202) 712-1158
gbritan@usaid.gov
Contracted under RAN-M-00-04-00049-A-FY0S-84
Integrated Managing for Results II](https://image.slidesharecdn.com/usaid-tipsseries-150106045150-conversion-gate02/85/Usaid-tips-series-152-320.jpg)

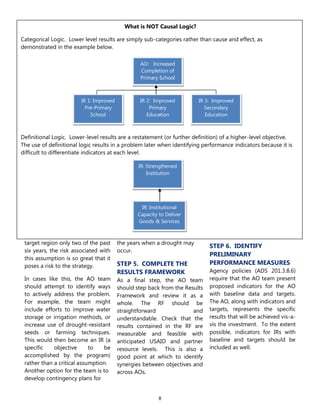
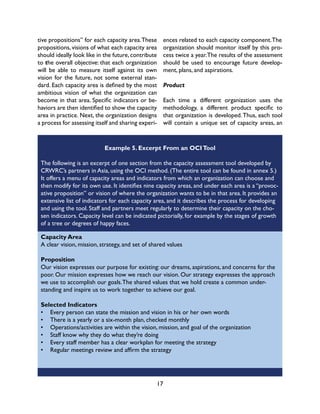
This document provides practical tips for USAID managers on conducting participatory evaluations, emphasizing the active involvement of stakeholders throughout the evaluation process. Key characteristics include participant focus, ownership, flexible design, and reliance on empirical data. While participatory evaluations can improve program performance and commitment, they may also face challenges such as perceived bias and resource demands.


