Download as PDF, PPTX

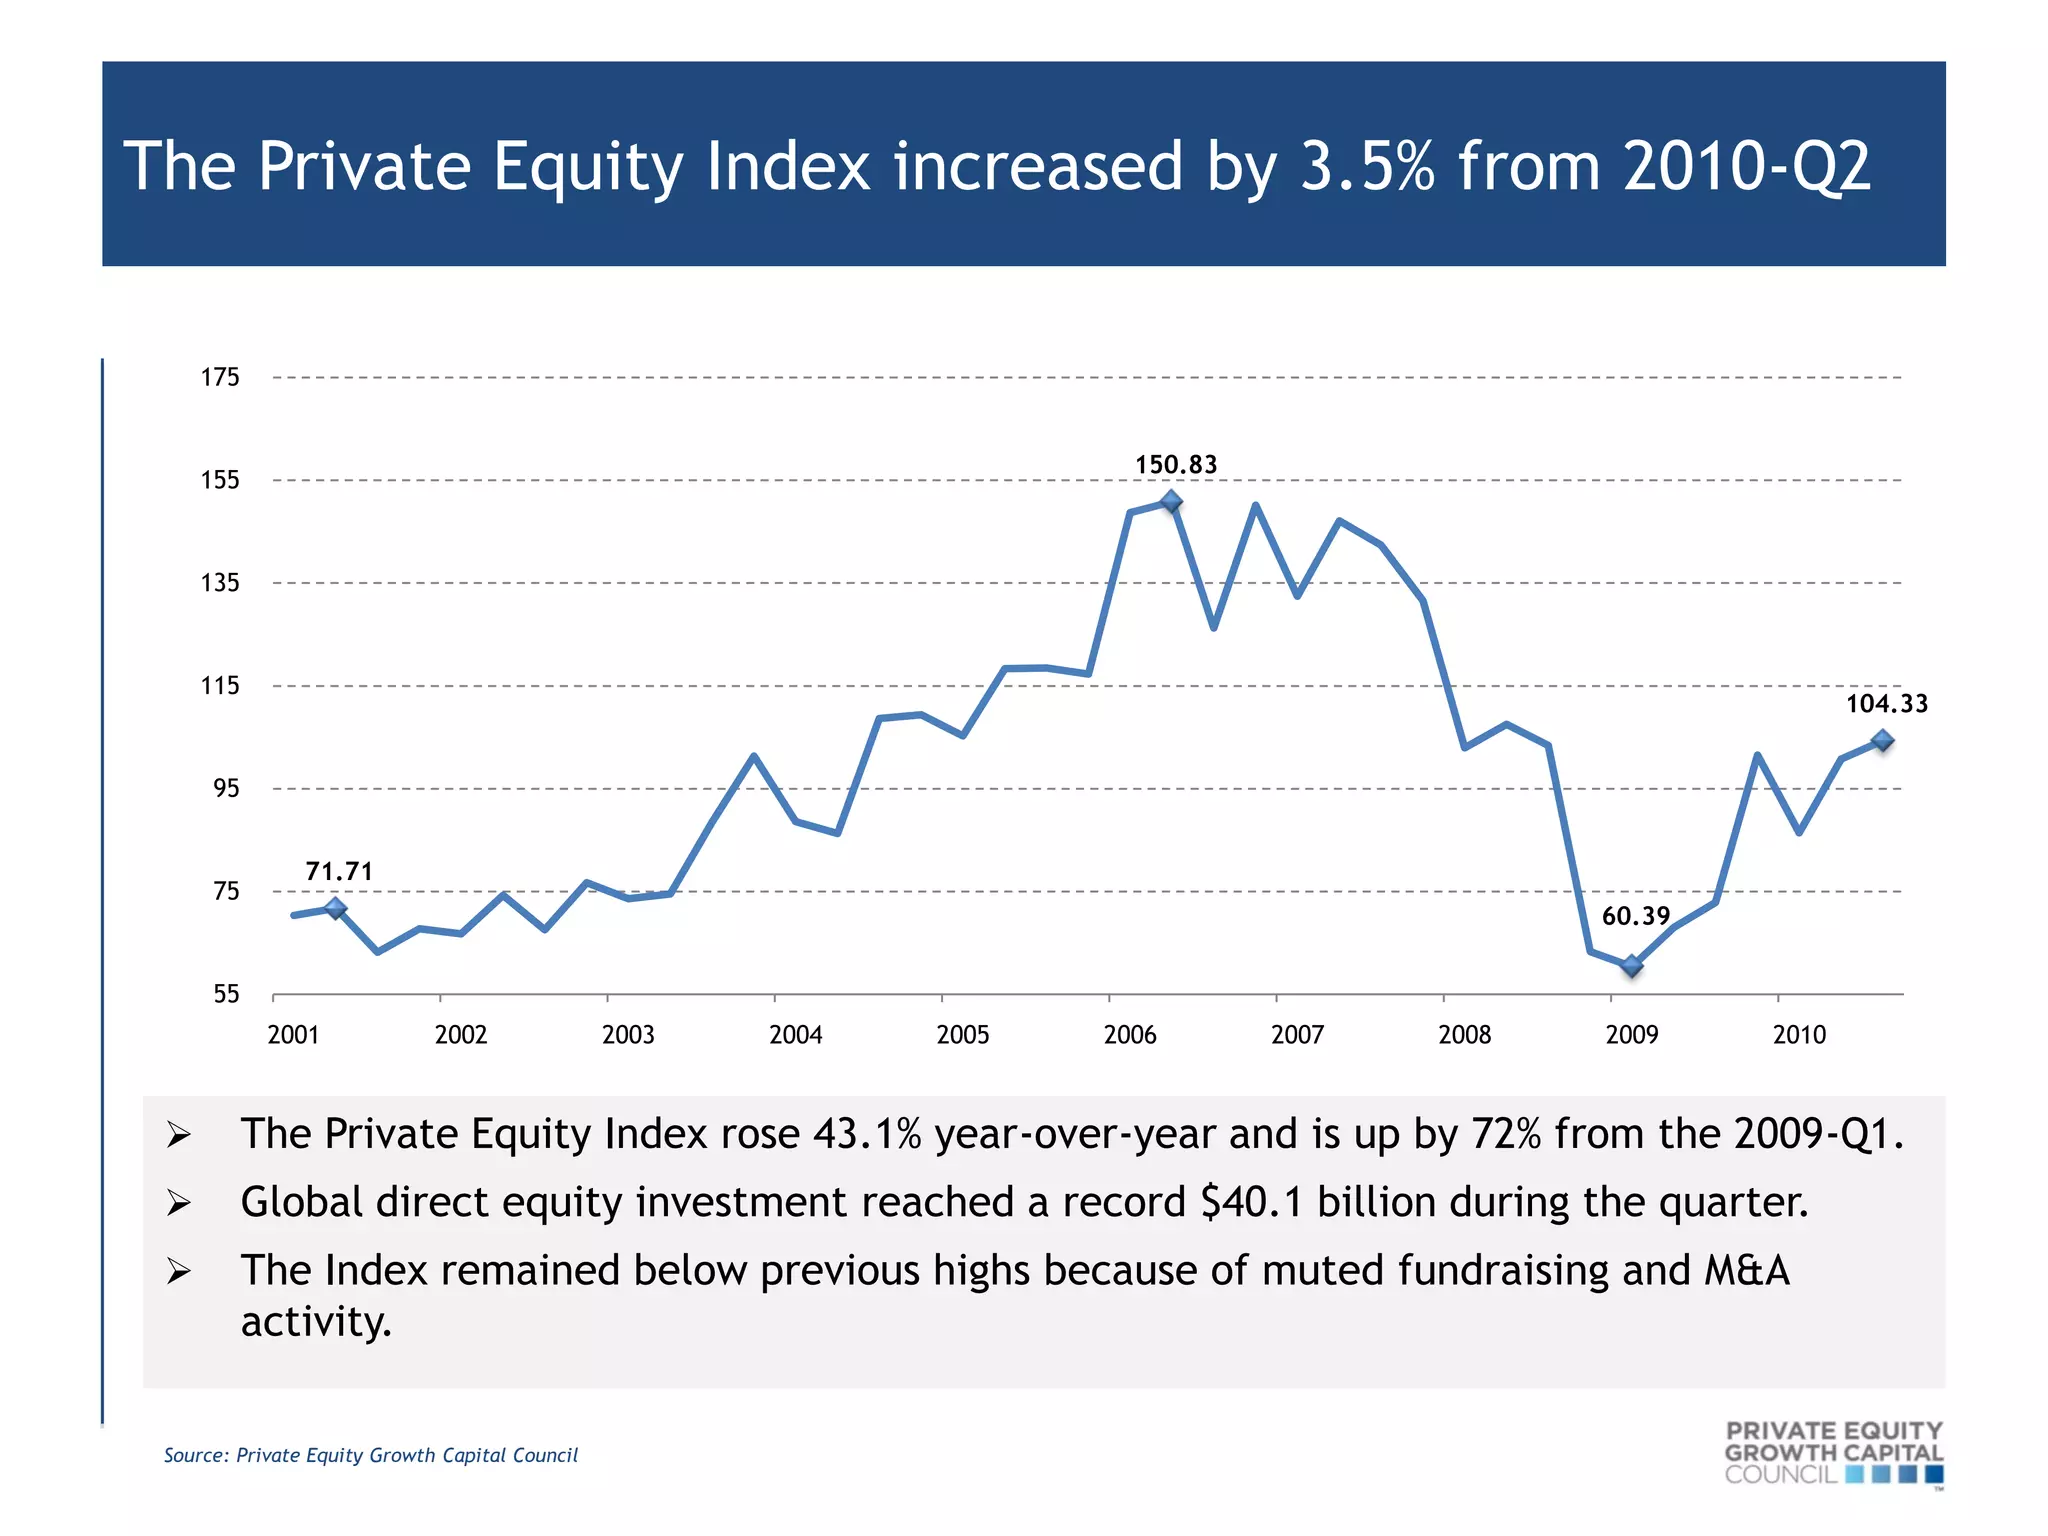
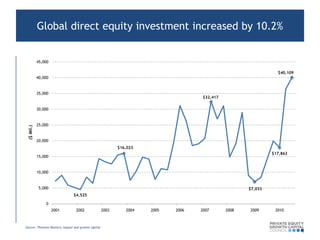
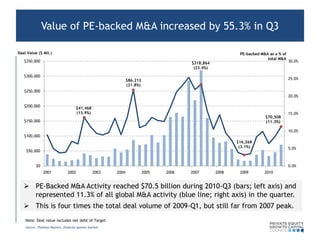

The private equity index increased by 3.5% in 2010-Q2, with a year-over-year rise of 43.1% and a 72% increase from 2009-Q1. Global direct equity investment reached a record $40.1 billion in the same quarter, but the index remains below previous highs due to slow fundraising and M&A activities. Private equity-backed M&A activity hit $70.5 billion in 2010-Q3, accounting for 11.3% of global M&A, which is significantly more than 2009-Q1 but still short of 2007 levels.


