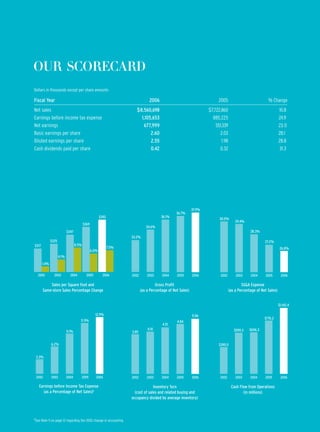
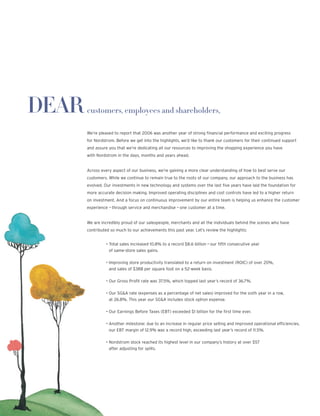
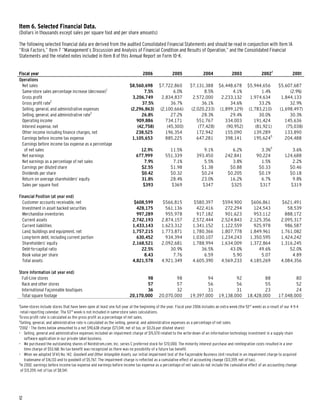
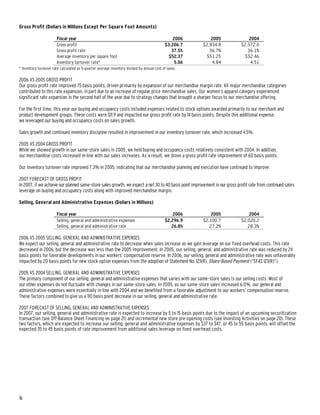
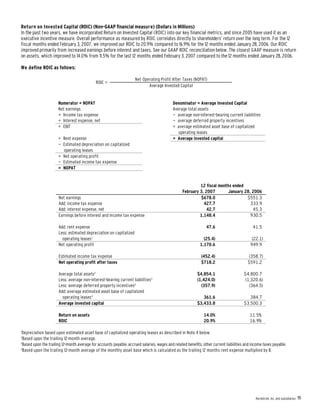
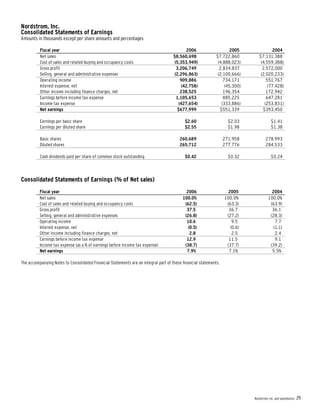
SlideShare a Scribd company logo
1 of 86
Download to read offline
the business of
                  FASHION
                  NORDSTROM, INC. ANNUAL REPORT 2006
Dollars in thousands except per share amounts

Fiscal Year                                                                       2006                                      2005                             % Change
Net sales                                                                $8,560,698                                   $7,722,860                                      10.8
Earnings before income tax expense                                         1,105,653                                    885,225                                       24.9
Net earnings                                                                677,999                                       551,339                                     23.0
Basic earnings per share                                                        2.60                                         2.03                                     28.1
Diluted earnings per share                                                      2.55                                          1.98                                    28.8
Cash dividends paid per share                                                   0.42                                        0.32                                      31.3


                                                                                                              37.5%
                                                                                                   36.7%
                                                                                         36.1%
                                                        $393                                                                30.0%
                                                                                                                                         29.4%
                                          $369
                                                                                34.6%
                                                                                                                                                  28.3%
                            $347
                                                                      33.2%
              $325                                                                                                                                         27.2%
                                   8.5%
$317                                                           7.5%                                                                                                   26.8%
                                                 6.0%
                     4.1%
       1.4%


  2002          2003          2004          2005          2006        2002       2003     2004     2005       2006           2002        2003     2004     2005        2006

           Sales per Square Foot and                                                  Gross Profit                                           SG&A Expense
       Same-store Sales Percentage Change                                    (as a Percentage of Net Sales)                          (as a Percentage of Net Sales)


                                                                                                                                                                      $1,142.4

                                                   12.9%                                                      5.06
                                                                                                                                                           $776.2
                                      11.5%                                                        4.84
                                                                                          4.51
                                                                                 4.10                                                            $606.3
                                                                                                                                        $599.3
                            9.1%                                      3.85


              6.2%                                                                                                          $390.5


 3.3%


 2002         2003          2004      2005          2006                                                                     2002        2003     2004     2005        2006
                                                                      2002       2003     2004     2005       2006

   Earnings before Income Tax Expense                                               Inventory Turn                                    Cash Flow from Operations
      (as a Percentage of Net Sales)1                                   (cost of sales and related buying and                                (in millions)
                                                                      occupancy divided by average inventory)


1 See Note 5 on page 12 regarding the 2002 change in accounting
For Nordstrom,

FASHION IS PERSONAL
           We don’t dictate.
           We suggest, collaborate, teach, inspire and engage.
           We’re the matchmaker, guiding our customer to discover ‘the one.’
           We don’t just sell clothes on a hanger.
           We’re in the business of making people feel great.
DEAR   customers, employees and shareholders,

       We’re pleased to report that 2006 was another year of strong financial performance and exciting progress
       for Nordstrom. Before we get into the highlights, we’d like to thank our customers for their continued support
       and assure you that we’re dedicating all our resources to improving the shopping experience you have
       with Nordstrom in the days, months and years ahead.


       Across every aspect of our business, we’re gaining a more clear understanding of how to best serve our
       customers. While we continue to remain true to the roots of our company, our approach to the business has
       evolved. Our investments in new technology and systems over the last five years have laid the foundation for
       more accurate decision making. Improved operating disciplines and cost controls have led to a higher return
       on investment. And a focus on continuous improvement by our entire team is helping us enhance the customer
       experience — through service and merchandise — one customer at a time.


       We are incredibly proud of our salespeople, merchants and all the individuals behind the scenes who have
       contributed so much to our achievements this past year. Let’s review the highlights:


                 • Total sales increased 10.8% to a record $8.6 billion — our fifth consecutive year
                  of same-store sales gains.

                 • Improving store productivity translated to a return on investment (ROIC) of over 20%,
                   and sales of $388 per square foot on a 52-week basis.

                 • Our Gross Profit rate was 37.5%, which topped last year’s record of 36.7%.

                 • Our SG&A rate (expenses as a percentage of net sales) improved for the sixth year in a row,
                   at 26.8%. This year our SG&A includes stock option expense.

                 • Our Earnings Before Taxes (EBT) exceeded $1 billion for the first time ever.

                 • Another milestone: due to an increase in regular price selling and improved operational efficiencies,
                   our EBT margin of 12.9% was a record high, exceeding last year’s record of 11.5%.

                 • Nordstrom stock reached its highest level in our company’s history at over $57
                   after adjusting for splits.
As 2007 progresses, we grow more excited about what lies ahead for the future of our company. The milestone year of 2006 by
no means signifies a ceiling in terms of growth. We believe we are uniquely positioned to grow the value of our business through
some highly focused initiatives, which are: advancing current merchandise strategies within our existing product categories,
improving the shopping experience across all channels and continuing to increase our presence where our customers shop.


Every merchandise strategy begins with our customers and what they want. In the last few years, we’ve taken great strides in
better understanding our customer. We’ve found that there’s a great deal of opportunity to grow our sales in existing stores
simply by earning a greater share of our customers’ business across multiple product categories. Our new systems and
merchandising disciplines have helped us begin to tap into that business by enhancing our ability to keep inventories fresh and
turn them more rapidly. Customers are responding to this “newness” across all merchandise categories, leading to impressive
results in areas such as men’s, accessories, shoes and cosmetics, and improved performance in women’s apparel. A consistently
strong performer in 2006 was our designer business and we’ll continue to expand the selection of designer merchandise
at Nordstrom. Our overall goal is to give the customer a compelling reason to buy something new.


Second, we need to be where our customers are shopping — whether that’s online or in stores. We’ve found that customers who
start shopping online typically gravitate to our stores and those customers who shop both online and in our full-line stores
purchase more merchandise. By giving customers the power to choose, and by offering a similar shopping experience in store
and online, we’re providing a level of service increasingly relevant to today’s shoppers.


One example of continuing to improve the experience across channels is the upcoming expansion of our Fulfillment
and Contact Center in Cedar Rapids, Iowa. This facility will give our team more capability to serve customers who want
to purchase items over the phone, online, or in any of our stores. Another investment that will help us serve our
customer better is technology that will enable our salespeople to have a single view of total company inventory.
This system enhancement, scheduled for completion in early 2008, will further expedite the search
and fulfillment process for customer requests.


Finally, given the industry consolidation impacting many of our competitors, we see tremendous potential to gain
market share and grow our business. Fortunately, we are in an advantageous position to reach new customers
through building stores and enhancing our current ones. We’ve recently launched a $2.8 billion capital plan,
with 80% of the dollars allocated to ”customer-facing“ issues like new stores, remodels and
relocations. The good news is that we have the resources to fund this plan, and it’s the highest value
use of our capital.
We will continue with a disciplined approach to real estate acquisitions, adding new stores when and where they pass our criteria.
Our current strategy calls for a 4–5% increase in square footage growth, with 26 new and relocated stores announced through
2011. We particularly want to take this opportunity to share with you how excited we are about the opening of our first store in
the Boston area this fall at Natick Collection. We have wanted to open a store in Boston for many years. Outside of Manhattan,
it is the last major market in the U.S. where we have not had a presence; now we’ll have four stores there in the next four years.
Also opening this fall will be new stores at Twelve Oaks Mall in Novi, Michigan; Cherry Creek Shopping Center in Denver, Colorado;
and a new Nordstrom Rack at Southcenter Square in Tukwila, Washington.


Growth opportunities are a direct outcome of a strong performing store base — therefore, our number-one priority is to make
Nordstrom the best it can be, both in terms of overall shopping experience and achieving sales potential. We believe the
significant progress we’ve made is just the beginning of a tremendous opportunity to build even more relationships with our
customers. By focusing on the initiatives we’ve laid out, we know there is more market share to be gained.


Our company is unique in many ways. We are especially fortunate to have the diversity of talented individuals who bring their
energy and ideas every day. There’s Eulia Saurwein at our Southcenter store in Tukwila, Washington, who’s been a top-selling
”Pacesetter“ a remarkable 31 years in a row. There’s Kimberly Lucas, a 2006 graduate of our Future Nordstrom Leaders program,
now the “via C” manager at our Houston, Texas store. And there’s Kristie Brousseau who, at 100 years of age, continues to bring
smiles to the customers at our Nordstrom Cafe in downtown Seattle.


We’d also like to thank Ray Ahana of Hawaii, our longest tenured manager, and Hazel Martin, a shoe salesperson from
Oregon, who both retired this past year after successful careers of 39 and 51 years respectively. Our summer internship
program continues to grow, with about 400 energetic and diverse college students joining us this past year. Ana Jimenez,
a former intern and University of Washington graduate, was recently promoted to be our Northwest Diversity Affairs
Assistant. Kimiko Saito, another intern and U.C. San Diego graduate, is now our Women’s Active Manager
at University Towne Center in San Diego. As our company grows, we continue to take pride in the many
people excited to build on the traditions of service and product that define Nordstrom.


As you can see, there is a great deal of optimism on our end for the future of our company.
If we focus on being the best Nordstrom we can be — as we continue to evolve — there’s
tremendous upside ahead.


On behalf of our executive team, we’d like to thank you for your continued support.


Sincerely,


Blake W. Nordstrom
President, Nordstrom, Inc.
A NOTE          from our Chairman


    Ten years ago I joined the Nordstrom Board. Since that time, I have come to develop an ever greater appreciation
    of the special qualities and characteristics that set Nordstrom apart from many other businesses — its honesty,
    competitive spirit, high ethical standards and unyielding commitment to the customer.


    Last year, I had the honor of succeeding Bruce Nordstrom as Chairman of the Board. Bruce retired after 40 years
    of outstanding service to the board and even more years serving as a company leader alongside his cousins
    from the Nordstrom family’s third generation. In 2000, the board created the lead independent director position,
    a move somewhat uncommon in American business. After serving as lead director for six years, I succeeded
    Bruce as non-executive chairman. This arrangement reflects the ongoing effort by Nordstrom to utilize sound and
    transparent governance practices appropriate for this unique company. Many of these practices, including the
    longstanding Nordstrom tradition that each director stand for election each year, are now viewed as
    best practices in the current, post Sarbanes-Oxley era.


    Our board is composed of nine directors, six of whom are independent and three of whom are members of
    the Nordstrom family. Our goal is to provide a balance of experience, talents and perspectives that complements
    the expertise of our leadership team. I could not be more proud to serve with the individuals on this board,
    or be more grateful for their wisdom and leadership, as we address the many business opportunities
    that lie ahead for Nordstrom.


    The past year demonstrates the power of literally tens of thousands of individuals working together to move
    our organization forward. The pieces that are in place fill me with gratitude for where we are as a company,
    as well as great enthusiasm for the bright promise of Nordstrom’s future. The women and men of this company
    have driven superior results by executing a highly focused and narrow set of initiatives, always through the
    lens of serving the customer while remaining true to the company’s values. There is no doubt that this customer
    focus will remain the foundation for Nordstrom in the years ahead, and that every effort will be made to
    ensure that the company’s distinctive character shines through at each and every Nordstrom location.


    The hard work and drive of the Nordstrom team has not gone unnoticed. In 2007, Nordstrom was named for the
    tenth time by Fortune magazine as one of the “100 Best Places to Work” and for the second year in a row
    as the number-one “Most Admired Company” in its industry category. Last year, Nordstrom also was named
    one of the “100 Best Corporate Citizens” by Business Ethics; named one of the “Top Employers for Minorities”
    by Fortune magazine; and honored as “Retailer of the Year” by the American Apparel and Footwear Association.


    In conclusion, I thank you for your interest in this great company. While the people of Nordstrom have
    accomplished many wonderful things over the last 106 years, I firmly believe that with its amazing team
    of people and strong leadership, the best years for Nordstrom are yet to come.


    Enrique Hernandez, Jr.
    Non-Executive Chairman
FINANCIALS
    2006
[This page intentionally left blank.]


2
UNITED STATES
                                                           SECURITIES AND EXCHANGE COMMISSION
                                                                  Washington, D.C. 20549

                                                                          FORM 10-K
(Mark One)
                       ANNUAL REPORT PURSUANT TO SECTION 13 OR 15(d) OF THE SECURITIES EXCHANGE ACT OF 1934
                                             For the fiscal year ended February 3, 2007

                                                                             OR

                    TRANSITION REPORT PURSUANT TO SECTION 13 OR 15(d) OF THE SECURITIES EXCHANGE ACT OF 1934
                                     For the transition period from______________ to ______________

                                                             Commission file number 001-15059


                                                      NORDSTROM, INC.
                                                     (Exact name of Registrant as specified in its charter)

                                 Washington                                                                      91-0515058
                         (State or other jurisdiction of                                                        (IRS employer
                        incorporation or organization)                                                        Identification No.)

                1617 Sixth Avenue, Seattle, Washington                                                              98101
                  (Address of principal executive offices)                                                        (Zip code)

                                             Registrant’s telephone number, including area code: 206-628-2111

                                             Securities registered pursuant to Section 12(b) of the Act:
                         Title of each class                                               Name of each exchange on which registered
                   Common stock, without par value                                                  New York Stock Exchange

                                               Securities registered pursuant to Section 12(g) of the Act: None

Indicate by check mark if the registrant is a well-known seasoned issuer, as defined in Rule 405 of the Securities Act. YES  NO 

Indicate by check mark if the registrant is not required to file reports pursuant to Section 13 or Section 15(d) of the Act. YES  NO 

Indicate by check mark whether the registrant (1) has filed all reports required to be filed by Section 13 or 15(d) of the Securities Exchange Act
of 1934 during the preceding 12 months (or for such shorter period that the Registrant was required to file such reports), and (2) has been subject
to such filing requirements for the past 90 days. YES  NO 

Indicate by check mark if disclosure of delinquent filers pursuant to Item 405 of Regulation S-K is not contained herein, and will not be contained,
to the best of registrant’s knowledge, in definitive proxy or information statements incorporated by reference in Part III of this Form 10-K or any
amendment to this Form 10-K. 

Indicate by check mark whether the registrant is a large accelerated filer, an accelerated filer, or a non-accelerated filer. See definition of
“accelerated filer and large accelerated filer” in Rule 12b-2 of the Exchange Act (Check one):
Large accelerated filer                                           Accelerated filer                                           Non-accelerated filer 

Indicate by check mark whether the registrant is a shell company (as defined in Rule 12b-2 of the Act). YES  NO 

As of July 28, 2006 the aggregate market value of the Registrant’s voting and non-voting stock held by non-affiliates of the Registrant was
approximately $6.8 billion using the closing sales price on that day of $33.84. On March 2, 2007, 257,535 shares of common stock were
outstanding (in thousands).
                                                       DOCUMENTS INCORPORATED BY REFERENCE
Portions of the Proxy Statement for the 2007 Annual Meeting of Shareholders scheduled to be held on May 22, 2007 are incorporated into Part III


                                                                                                                                                                         1
                                                                                                                                      Nordstrom, Inc. and subsidiaries
[This page intentionally left blank.]


2
TABLE OF CONTENTS
                                                                                                                                               Page

PART I
  Item 1.    Business.                                                                                                                          4
  Item 1A.   Risk Factors.                                                                                                                      5
  Item 1B.   Unresolved Staff Comments.                                                                                                         7
  Item 2.    Properties.                                                                                                                        7
  Item 3.    Legal Proceedings.                                                                                                                10
  Item 4.    Submission of Matters to a Vote of Security Holders.                                                                              10

PART II
  Item 5.    Market for Registrant’s Common Equity, Related Shareholder Matters and Issuer Purchases of Equity Securities.                     10
  Item 6.    Selected Financial Data.                                                                                                          12
  Item 7.    Management’s Discussion and Analysis of Financial Condition and Results of Operations.                                            14
  Item 7A.   Quantitative and Qualitative Disclosures About Market Risk.                                                                       25
  Item 8.    Financial Statements and Supplementary Data.                                                                                      26
  Item 9.    Changes in and Disagreements With Accountants on Accounting and Financial Disclosure.                                             52
  Item 9A.   Controls and Procedures.                                                                                                          52
  Item 9B.   Other Information.                                                                                                                52

PART III
  Item 10.   Directors, Executive Officers and Corporate Governance of the Registrant.                                                         52
  Item 11.   Executive Compensation.                                                                                                           52
  Item 12.   Security Ownership of Certain Beneficial Owners and Management and Related Shareholder Matters.                                   53
  Item 13.   Certain Relationships and Related Transactions.                                                                                   53
  Item 14.   Principal Accountant Fees and Services.                                                                                           53

PART IV
  Item 15. Exhibits, Financial Statement Schedules.                                                                                            53

Signatures                                                                                                                                     54
Consent of Independent Registered Public Accounting Firm                                                                                       55
Schedule II – Valuation and Qualifying Accounts                                                                                                56
Exhibit Index                                                                                                                                  58


                                                                                                                                                                3
                                                                                                                             Nordstrom, Inc. and subsidiaries
PART I
Item 1. Business.
DESCRIPTION OF BUSINESS
Nordstrom incorporated in the state of Washington in 1946 as the successor to a retail shoe business that started in 1901. We are one of the nation’s
leading fashion specialty retailers, with 155 U.S. stores located in 27 states. The west coast and east coast are the areas in which we have the largest
presence. Nordstrom is comprised of four segments: Retail Stores, Credit, Direct, and Other.

Retail Stores derives its revenues from sales of high-quality apparel, shoes, cosmetics and accessories. It includes our 98 Full-Line ‘Nordstrom’
stores, 50 discount ‘Nordstrom Rack’ stores, two clearance stores that operate under the name ‘Last Chance,’ and one free-standing shoe store. The
Nordstrom Rack stores serve as outlets for clearance merchandise from our Full-Line stores and purchase merchandise directly from manufacturers.

In 2006, we opened one Full-Line store (Palm Beach Gardens, Florida), relocated one Full-Line Store (Canoga Park, California) and opened one Rack
store (San Marcos, California). In 2007, we are scheduled to open three Full-Line stores (Natick, Massachusetts; Novi, Michigan; Denver, Colorado) and
one Rack store (Tukwila, Washington). In 2008, we are scheduled to open eight Full-Line stores and relocate one Full-Line store.

Through our wholly owned federal savings bank, Nordstrom fsb, we offer a private label card, two co-branded Nordstrom VISA credit cards and a
debit card for Nordstrom purchases. The credit and debit cards feature a shopping-based loyalty program designed to increase customer visits and
spending in our Retail Stores and Direct segments. Our Credit segment generates earnings through finance charges and securitization-related gains
on these cards.

Direct generates revenues from sales of high-quality apparel, shoes, cosmetics and accessories by serving our customers on the Web at
www.nordstrom.com and through our catalogs. Most of the Direct segment’s sales are shipped via third-party carriers from our fulfillment center
in Cedar Rapids, Iowa.

Our Other segment includes our four U.S. based ‘Façonnable’ boutiques and the 36 Façonnable boutiques located in France, Portugal and Belgium.
Façonnable is a wholesaler and retailer of high quality men’s, women’s and boys’ apparel and accessories with distribution to over 45 countries.
Façonnable has licensee and franchisee agreements with others who operate wholesale distribution and/or boutique locations in Spain, Turkey,
Greece, the Middle East, Taiwan, Canada and Latin America. The Other segment also includes our product development team, called Nordstrom
Product Group, which designs and coordinates the production of private label merchandise sold in our retail stores. In addition, this segment
includes our corporate center operations.

For more information about our business and our reportable segments, see Item 7, “Management’s Discussion and Analysis of Financial Condition
and Results of Operation” on page 14 and Note 15 of the Notes to Consolidated Financial Statements in Item 8 on page 48.

FISCAL YEAR END
Our fiscal year ends on the Saturday closest to January 31st. References to 2006 relate to the 53-week fiscal year ended February 3, 2007.
References to 2005 and 2004 relate to the 52-week fiscal years ended January 28, 2006 and January 29, 2005. References to 2007 relate to
the 52 weeks ending February 2, 2008.

TRADEMARKS
We have approximately 169 registered trademarks or trademark applications. Our most notable trademarks include Nordstrom, Nordstrom Rack,
Façonnable, Caslon, John W. Nordstrom, and Classiques Entier. Each of our trademarks is renewable indefinitely provided that it is still used in
commerce at the time of the renewal.

RETURN POLICY
We offer our customers a fair and liberal return policy at our Full-Line stores and Nordstrom Direct (online and catalog). Our Nordstrom Rack stores
accept returns up to 30 days from the date of purchase. In general, our return policy is somewhat more generous than industry standards.
We utilize historical return patterns to estimate our expected returns.

SEASONALITY
Due to our anniversary sale in July and the holidays in December, sales are higher for our Retail Stores in the second and fourth quarters of the fiscal
year than in the first and third quarters.

INVENTORY
We plan our merchandise purchases and receipts to coincide with the selling patterns that we expect. For instance, we purchase and receive a larger
amount of merchandise in the fall as we prepare for the holiday shopping season (from late November through early January). Also, our merchandise
purchases and receipts increase prior to our Anniversary Sale, which extends over the last two weeks of July. We pay for our merchandise purchases
under the terms established with our vendors, which is usually within 30 days of the date that the merchandise was shipped to us.

In order to offer merchandise that our customers want, we purchase merchandise from a wide variety of high-quality suppliers. In 2006,
our ten largest suppliers accounted for approximately 21% of our merchandise purchases. We also have arrangements with agents and contract
manufacturers to produce our private label merchandise. We do not have long-term purchase commitments or arrangements with any of our
4
merchandise suppliers. Our suppliers include domestic and foreign businesses. We expect our suppliers to meet our “Nordstrom Partnership:
Standards and Business Practice Guidelines,” which address our standards for matters such as law, labor, health and safety, and environment.

COMPETITIVE CONDITIONS
All segments of our business are highly competitive. Each of our stores competes with other national, regional and local retail establishments that
may carry similar lines of merchandise, including department stores, specialty stores, boutiques, mail order and Internet businesses. Our specific
competitors vary from market to market. We believe the principal methods of competing in our industry include customer service, fashion, quality
of product, depth of selection, store environment and location.

EMPLOYEES
During 2006, we regularly employed on a full or part-time basis an average of 52,900 employees. Due to the seasonal nature of our business,
employment increased to approximately 56,500 employees in July 2006 and 57,400 in December 2006.

CAUTIONARY STATEMENT
Certain statements in this Annual Report on Form 10-K contain “forward-looking” statements (as defined in the Private Securities Litigation Reform
Act of 1995) that involve risks and uncertainties, including anticipated results, store openings and trends in our operations. Actual future results
and trends may differ materially from historical results or current expectations depending upon various factors including those discussed below
and elsewhere in this Annual Report on Form 10-K, particularly in Item 1A under the heading “Risk Factors”, the impact of economic and competitive
market forces, terrorist activity or war may impact our customers and the retail industry, our ability to predict fashion trends, consumer apparel
buying patterns, trends in personal bankruptcies and bad debt write-offs, changes in interest rates, employee relations, our ability to continue and
control our expansion, remodel and investment plans, changes in government or regulatory requirements, our ability to control costs, weather
conditions and hazards of nature.

These and other factors could affect our financial results and cause actual results to differ materially from those contained in any forward-looking
statements we may make. As a result, while we believe there is a reasonable basis for the forward-looking statements, you should not place undue
reliance on those statements. We undertake no obligation to update or revise any forward-looking statements to reflect subsequent events, new
information or future circumstances.

SEC FILINGS
We file annual, quarterly and current reports, proxy statements and other documents with the Securities and Exchange Commission (“SEC”).
All material we file with the SEC is publicly available at the SEC’s Public Reference Room at 450 Fifth Street, NW, Washington, DC 20549. You may obtain
information on the operation of the Public Reference Room by calling the SEC at 1-800-SEC-0330. In addition, the SEC maintains an Internet Web site at
www.sec.gov that contains reports, proxy and information statements, and other information regarding issuers that file electronically with the SEC.

WEB SITE ACCESS
Our Internet Web site address is www.nordstrom.com. We make available free of charge on or through our Internet Web site our annual reports on
Form 10-K, quarterly reports on Form 10-Q, current reports on Form 8-K, statements of changes in beneficial ownership of securities on Form 4 and
amendments to those reports filed or furnished pursuant to Section 13(a) or 15(d) of the Exchange Act as soon as reasonably practicable after we
electronically file the report with or furnish it to the SEC. Interested parties may also access a Webcast of quarterly earnings conference calls and
other financial events over our Internet Web site.

CORPORATE GOVERNANCE
We have a long-standing commitment to upholding a high level of ethical standards. In addition, as required by the listing standards of the New
York Stock Exchange (“NYSE”) and the rules of the SEC, we have adopted Codes of Business Conduct and Ethics for our employees, officers and
directors (“Codes of Ethics”) and Corporate Governance Guidelines. We have posted on our Web site our Codes of Ethics, our Corporate Governance
Guidelines, and our Committee Charters for the Audit, Compensation, Corporate Governance and Nominating, Executive, and Finance committees.
These items are also available in print to any person without charge upon request to:

  Nordstrom, Inc. Investor Relations
  P.O. Box 2737
  Seattle, Washington 98111
  (206) 303-3200
  invrelations@nordstrom.com


Item 1A. Risk Factors.
Our business faces many risks. We believe the risks described below outline the items of most concern to us. However, these risks may not be
the only ones we face. Additional risks and uncertainties, not presently known to us or that we currently deem immaterial, may also impair our
business operations.


                                                                                                                                                                         5
                                                                                                                                      Nordstrom, Inc. and subsidiaries
ABILITY TO RESPOND TO THE BUSINESS ENVIRONMENT AND FASHION TRENDS
Our sales and operating results depend in part on our ability to predict or respond to changes in fashion trends and consumer preferences in a timely
manner. Any sustained failure to identify and respond to emerging trends in lifestyle and consumer preferences could have a material adverse affect
on our business. Consumer spending at our stores may be affected by many factors outside of our control, including consumer confidence, weather
and other hazards of nature that affect consumer traffic, and general economic conditions.

INVENTORY MANAGEMENT
We strive to ensure the merchandise we offer remains fresh and compelling to our customers. If we are not successful at predicting our sales trends
and adjusting our purchases, we may have excess inventory, which would result in additional markdowns and reduce our operating performance.

IMPACT OF COMPETITIVE MARKET FORCES
The retail industry environment continues to change for many of our vendors and customers. In the future, our competition may partner more
effectively with vendors to serve the market’s needs. If we do not effectively respond to changes in our environment, we may see
a loss of market share to competitors, declining same-store sales, and declining profitability due to higher markdowns.

STORE GROWTH STRATEGY
As of February 2007, our plans for the next five years include opening 26 new or relocated stores and remodeling 69 existing stores. Our future net
sales at new, relocated or remodeled stores may not meet our projections, which could reduce our operating performance. Performance in our new
stores could also be impacted based on our ability to hire employees who are able to deliver the level of service customers have come to expect when
shopping at our stores. In the past, our expected opening dates have sometimes been delayed because of developer plan delays. Our future growth
could be negatively impacted by delays to our store opening, relocating or remodeling plans.

INFORMATION SECURITY AND PRIVACY
The protection of our customer, employee, and company data is critical to us. The regulatory environment surrounding information security and
privacy is increasingly demanding, with the frequent imposition of new and constantly changing requirements across our business units. In addition,
our customers have a high expectation that we will adequately protect their personal information. A significant breach of customer, employee, or
company data could damage our reputation and result in lost sales, fines, and lawsuits.

LEADERSHIP DEVELOPMENT AND SUCCESSION PLANNING
The training and development of our future leaders is critical to our long-term growth. If we do not effectively implement our strategic and business
planning processes to train and develop future leaders, our long-term growth may suffer. In addition, if unexpected leadership turnover occurs without
established succession plans, our business may suffer.

MULTI-CHANNEL STRATEGY EXECUTION
In 2005, we started to make changes in our Direct business that better align our online shopping environment and catalog with the customer
experience in our Full-Line stores. These changes include: aligning our Direct merchandise offering with our Full-Line stores to create a seamless
experience for our customers between our stores, catalogs and Web site, linking the Full-Line stores and Direct merchandise organization; reducing
the number and frequency of our Direct catalog mailings; and transitioning our Direct inventory system onto our Full-Line store platform, all while
dealing with changes in the Internet market in general. Based on our online sales trends and customer feedback in 2006, we believe that our strategy
shift will improve our future operating performance. We also found that the technology changes will be more challenging than we initially anticipated.
Executing this strategy may cost more and take longer than expected, which could impact our future operating performance.

BRAND AND REPUTATION
We have a well-recognized brand that is synonymous with the highest level of customer service and quality merchandise. Any significant damage to
our brand or reputation may negatively impact same-store sales, lower employee morale and productivity, and diminish customer trust, resulting in
a reduction in shareholder value.

CAPITAL EFFICIENCY AND PROPER ALLOCATION
Our goal is to invest capital to maximize our overall long-term returns. This includes spending on inventory, capital projects and expenses, managing
debt levels, managing accounts receivable through our credit business, and returning value to our shareholders through dividends and share
repurchases. To a large degree, capital efficiency reflects how well we manage the other key risks to our Company. The actions taken to address
other specific risks may affect how well we manage the more general risk of capital efficiency. Our recent operating results have raised expectations
about our performance. If we do not properly allocate our capital to maximize returns, we may fail to continue to produce similar financial results and
we may experience a reduction in shareholder value.

HUMAN RESOURCE REGULATIONS
Our policies and procedures are designed to comply with human resource laws such as wage and hour, meal and rest period, and commissions.
Federal and state wage and hour laws are complex, and the related enforcement is increasingly aggressive, particularly in the state of California.
Failure to comply with these laws could result in damage to our reputation, class action lawsuits, and dissatisfied employees.


6
EMPLOYMENT AND DISCRIMINATION LAWS
State and federal employment and discrimination laws and the related case law continue to evolve, making ongoing compliance in this area a
challenge. Failure to comply with these laws may result in damage to our reputation, legal and settlement costs, disruption of our business, and loss
of customers and employees, which would result in a loss of net sales and increased employment costs, low employee morale and attendant harm to
our business and results of operations.

TECHNOLOGY STRATEGY
We make investments in information technology to sustain our competitive position. We expect to spend approximately $170 million each year
on information technology operations and system development, which is key to our growth strategy. We must monitor and choose the right
investments and implement them at the right pace. Targeting the wrong opportunities, failing to make the best investment, or making an investment
commitment significantly above or below the requirements of the business opportunity may result in the loss of our competitive position. In addition,
an inadequate investment in maintaining our current systems may result in a loss of system functionality and increased future costs to bring our
systems up to date.

We may implement too much technology, or change too fast, which could result in failure to adopt the new technology if the business is not ready or
capable of accepting it. Excessive technological change affects the effectiveness of adoption, and could adversely affect the realization of benefits
from the technology. However, not implementing enough technology could compromise our competitive position.

REGULATORY COMPLIANCE
Our policies and procedures are designed to comply with all applicable laws and regulations, including those imposed by the SEC, NYSE, the banking
industry, and foreign countries. Additional legal and regulatory requirements such as the Sarbanes-Oxley Act have increased the complexity
of the regulatory environment. In addition, foreign laws may conflict with domestic laws. Failure to comply with the various regulations may
result in damage to our reputation, civil and criminal liability, fines and penalties, increased cost of regulatory compliance, and restatements
of financial statements.

ANTI-TAKEOVER PROVISIONS
We are incorporated in the state of Washington and subject to Washington state law. Some provisions of Washington state law could interfere with
or restrict takeover bids or other change in control events affecting us. For example, one statutory provision prohibits us, except under specified
circumstances, from engaging in any significant business transaction with any shareholder who owns 10% or more of our common stock (which
shareholder, under the statute, would be considered an “acquiring person”) for a period of five years following the time that such shareholder
became an acquiring person.


Item 1B. Unresolved Staff Comments.
None.


Item 2. Properties.
The following table summarizes the number of retail stores owned or leased by us, and the percentage of total store square footage represented
by each listed category at February 3, 2007:
                                                                                                                    % of total store
                                                                                       Number of Stores              square footage
                   Owned stores                                                                     32                       25.3%
                   Owned on leased land                                                             45                       43.1%
                   Leased stores                                                                   111                       30.1%
                   Partly owned and partly leased                                                     3                        1.5%
                   Total                                                                           191                      100.0%

We also own six merchandise distribution centers located in Portland, Oregon; Dubuque, Iowa; Ontario, California; Newark, California; Upper Marlboro,
Maryland; and Gainesville, Florida, which are utilized by the Retail Stores segment. The Direct segment utilizes one fulfillment center in Cedar Rapids,
Iowa, which is owned on leased land. Our administrative offices in Seattle, Washington are a combination of leased and owned space. For one of our
corporate office buildings in Seattle, we own a 49% interest in a limited partnership which constructed the office building in which we are the primary
tenant. During 2002, the limited partnership refinanced its construction loan obligation with a mortgage secured by the property. This mortgage is
included in our long-term debt and is amortized as we make rental payments to the limited partnership over the life of the mortgage. We also lease
an office building in the Denver, Colorado metropolitan area that serves as an office of Nordstrom fsb and Nordstrom Credit, Inc.


                                                                                                                                                                   7
                                                                                                                                Nordstrom, Inc. and subsidiaries
The following table lists our retail store facilities as of February 3, 2007:

                                                                      Year                                                                   Year
                                                           Square    Store                                                        Square    Store
Location             Store Name                           Footage   Opened      Location          Store Name                     Footage   Opened
Full-Line Stores

ALASKA                                                                          ILLINOIS
Anchorage            Anchorage                             97,000     1975      Chicago           Michigan Avenue                274,000    2000
                                                                                Oak Brook         Oakbrook Center                249,000    1991
ARIZONA                                                                         Schaumburg        Woodfield Shopping Center      215,000    1995
Chandler             Chandler Fashion Center              149,000     2001      Skokie            Old Orchard Center             209,000    1994
Scottsdale           Scottsdale Fashion Square            235,000     1998
                                                                                INDIANA
CALIFORNIA                                                                      Indianapolis      Circle Centre                  216,000    1995
Arcadia              Santa Anita                          151,000     1994
Brea                 Brea Mall                            195,000     1979      KANSAS
Canoga Park          Topanga                              213,000     1984      Overland Park     Oak Park Mall                  219,000    1998
Cerritos             Los Cerritos Center                  122,000     1981
Corte Madera         The Village at Corte Madera          116,000     1985      MARYLAND
Costa Mesa           South Coast Plaza                    235,000     1978      Annapolis         Annapolis Mall                 162,000    1994
Escondido            North County                         156,000     1986      Bethesda          Montgomery Mall                225,000    1991
Glendale             Glendale Galleria                    147,000     1983      Columbia          The Mall in Columbia           173,000    1999
Irvine               Irvine Spectrum Center               130,000     2005      Towson            Towson Town Center             205,000    1992
Los Angeles          The Grove                            120,000     2002
Los Angeles          Westside Pavilion                    150,000     1985      MICHIGAN
Mission Viejo        The Shops at Mission Viejo           172,000     1999      Troy              Somerset Collection            258,000    1996
Montclair            Montclair Plaza                      134,000     1986
Palo Alto            Stanford Shopping Center             187,000     1984      MINNESOTA
Pleasanton           Stoneridge Mall                      173,000     1990      Bloomington       Mall of America                240,000    1992
Redondo Beach        South Bay Galleria                   161,000     1985
Riverside            The Galleria at Tyler in Riverside   164,000     1991      MISSOURI
Roseville            Galleria at Roseville                149,000     2000      Des Peres         West County                    193,000    2002
Sacramento           Arden Fair                           190,000     1989
San Diego            Fashion Valley                       220,000     1981      NEVADA
San Diego            Horton Plaza                         151,000     1985      Las Vegas         Fashion Show                   207,000    2002
San Diego            University Towne Center              130,000     1984
San Francisco        San Francisco Centre                 350,000     1988      NEW JERSEY
San Francisco        Stonestown Galleria                  174,000     1988      Edison            Menlo Park                     204,000    1991
San Jose             Valley Fair                          232,000     1987      Freehold          Freehold Raceway Mall          174,000    1992
San Mateo            Hillsdale Shopping Center            149,000     1982      Paramus           Garden State Plaza             282,000    1990
Santa Ana            MainPlace/Santa Ana                  169,000     1987      Short Hills       The Mall at Short Hills        188,000    1995
Santa Barbara        Paseo Nuevo in Santa Barbara         186,000     1990
Walnut Creek         Broadway Plaza                       193,000     1984      NEW YORK
                                                                                Garden City       Roosevelt Field                241,000    1997
COLORADO                                                                        White Plains      The Westchester                219,000    1995
Broomfield           FlatIron Crossing                    172,000     2000
Littleton            Park Meadows                         245,000     1996      NORTH CAROLINA
                                                                                Charlotte         SouthPark                      151,000    2004
CONNECTICUT                                                                     Durham            The Streets at Southpoint      149,000    2002
Farmington           Westfarms                            189,000     1997
                                                                                OHIO
FLORIDA                                                                         Beachwood         Beachwood Place                231,000    1997
Boca Raton           Town Center at Boca Raton            193,000     2000      Columbus          Easton Town Center             174,000    2001
Coral Gables         Village of Merrick Park              212,000     2002
Miami                Dadeland Mall                        150,000     2004      OREGON
Orlando              The Florida Mall                     174,000     2002      Portland          Clackamas Town Center          121,000    1981
Palm Beach Gardens   The Gardens                          150,000     2006      Portland          Downtown Portland              174,000    1966
Tampa                International Plaza                  172,000     2001      Portland          Lloyd Center                   150,000    1963
Wellington           The Mall at Wellington Green         127,000     2003      Salem             Salem Center                    71,000    1980
                                                                                Tigard            Washington Square              189,000    1974
GEORGIA
Atlanta              Perimeter Mall                       243,000     1998      PENNSYLVANIA
Atlanta              Phipps Plaza                         140,000     2005      King of Prussia   The Plaza at King of Prussia   238,000    1996
Buford               Mall of Georgia                      172,000     2000


8
Year                                                                                        Year
                                                       Square      Store                                                                       Square          Store
Location                 Store Name                   Footage     Opened         Location             Store Name                              Footage         Opened
Full-Line Stores (Cont.)                                                         Nordstrom Rack Group

RHODE ISLAND                                                                     Chandler, AZ           Chandler Festival Rack                 37,000           2000
Providence             Providence Place               206,000      1999          Phoenix, AZ            Last Chance                            48,000           1992
                                                                                 Scottsdale, AZ         Scottsdale Promenade Rack              38,000           2000
TEXAS                                                                            Brea, CA               Brea Union Plaza Rack                  45,000           1999
Austin                 Barton Creek Square            150,000      2003          Chino, CA              Chino Spectrum Towne Center Rack       38,000           1987
Dallas                 Galleria Dallas                249,000      1996          Colma, CA              Colma Rack                             31,000           1987
Dallas                 NorthPark Center               212,000      2005          Costa Mesa, CA         Metro Pointe at South Coast Rack       50,000           1983
Frisco                 Stonebriar Centre              149,000      2000          Fresno, CA             Villaggio Retail Center Rack           32,000           2002
Houston                Houston Galleria               226,000      2003          Glendale, CA           Glendale Fashion Center Rack           36,000           2000
Hurst                  NorthEast Mall                 149,000      2001          Long Beach, CA         Long Beach CityPlace Rack              33,000           2002
San Antonio            The Shops at La Cantera        149,000      2005          Los Angeles, CA        The Promenade at Howard Hughes         41,000           2001
                                                                                                        Center Rack
UTAH                                                                             Ontario, CA            Ontario Mills Mall Rack                40,000           2002
Murray                 Fashion Place                  110,000      1981          Oxnard, CA             Esplanade Shopping Center Rack         38,000           2001
Orem                   University Mall                122,000      2002          Roseville, CA          Creekside Town Center Rack             36,000           2001
                                                                                 Sacramento, CA         Howe `Bout Arden Center Rack           54,000           1999
VIRGINIA                                                                         San Diego, CA          Mission Valley Rack                    57,000           1985
Arlington              The Fashion Centre at          241,000      1989          San Francisco, CA      555 Ninth Street Retail Center         43,000           2001
                       Pentagon City                                                                    Rack
Dulles                 Dulles Town Center             148,000      2002          San Jose, CA           Westgate Mall Rack                     48,000           1998
McLean                 Tysons Corner Center           211,000      1988          San Leandro, CA        San Leandro Rack                       44,000           1990
Norfolk                MacArthur Center               166,000      1999          San Marcos, CA         Grand Plaza Rack                       35,000           2006
Richmond               Short Pump Town Center         128,000      2003          Woodland Hills, CA     Topanga Rack                           64,000           1984
                                                                                 Broomfield, CO         Flatiron Marketplace Rack              36,000           2001
WASHINGTON                                                                       Littleton, CO          Meadows Marketplace Rack               34,000           1998
Bellevue               Bellevue Square                285,000      1967          Miami, FL              Last Chance                            26,000           2005
Lynnwood               Alderwood                      151,000      1979          Sunrise, FL            The Oasis at Sawgrass Mills Rack       27,000           2003
Seattle                Downtown Seattle               383,000      1963          Buford, GA             Mall of Georgia Crossing Rack          44,000           2000
Seattle                Northgate                      122,000      1965          Honolulu, HI           Ward Centers Rack                      34,000           2000
Spokane                Spokane                        137,000      1974          Chicago, IL            The Shops at State and                 41,000           2003
Tacoma                 Tacoma Mall                    134,000      1966                                 Washington Rack
Tukwila                Southcenter                    170,000      1968          Northbrook, IL         Northbrook Rack                        40,000           1996
Vancouver              Vancouver                       71,000      1977          Oak Brook, IL          The Shops at Oak Brook Place Rack      42,000           2000
                                                                                 Schaumburg, IL         Woodfield Rack                         45,000           1994
Other                                                                            Gaithersburg, MD       Gaithersburg Rack                      49,000           1999
                                                                                 Towson, MD             Towson Rack                            31,000           1992
Honolulu, HI           Ward Centers Shoes              16,000      1997          Grand Rapids, MI       Centerpointe Mall Rack                 40,000           2001
Façonnable             U.S. (4 boutiques)              53,000                    Troy, MI               Troy Marketplace Rack                  40,000           2000
Façonnable             International (36 boutiques)    96,000                    Bloomington, MN        Mall of America Rack                   41,000           1998
                                                                                 Las Vegas, NV          Silverado Ranch Plaza Rack             33,000           2001
                                                                                 Westbury, NY           The Mall at the Source Rack            48,000           1997
                                                                                 Beaverton, OR          Tanasbourne Town Center Rack           53,000           1998
                                                                                 Clackamas, OR          Clackamas Promenade Rack               28,000           1983
                                                                                 Portland, OR           Downtown Portland Rack                 32,000           1986
                                                                                 King of Prussia, PA    The Overlook at King of                45,000           2002
                                                                                                        Prussia Rack
                                                                                 Hurst, TX              The Shops at North East Mall Rack      40,000           2000
                                                                                 Plano, TX              Preston Shepard Place Rack             39,000           2000
                                                                                 Salt Lake City, UT     Sugarhouse Rack                        31,000           1991
                                                                                 Sterling, VA           Dulles Town Crossing Rack              41,000           2001
                                                                                 Woodbridge, VA         Potomac Mills Rack                     46,000           1990
                                                                                 Auburn, WA             SuperMall of the Great                 48,000           1995
                                                                                                        Northwest Rack
                                                                                 Bellevue, WA           Factoria Mall Rack                     46,000           1997
                                                                                 Lynnwood, WA           Golde Creek Plaza Rack                 38,000           1985
                                                                                 Seattle, WA            Downtown Seattle Rack                  42,000           1987
                                                                                 Spokane, WA            NorthTown Mall Rack                    28,000           2000


We plan to open three Full-Line stores and one Rack store in 2007 and eight Full-Line stores in 2008.


                                                                                                                                                                          9
                                                                                                                                       Nordstrom, Inc. and subsidiaries
Item 3. Legal Proceedings.
COSMETICS
We were originally named as a defendant along with other department store and specialty retailers in nine separate but virtually identical class
action lawsuits filed in various Superior Courts of the State of California in May, June and July 1998 that were consolidated in Marin County Superior
Court. In May 2000, plaintiffs filed an amended complaint naming a number of manufacturers of cosmetics and fragrances and two other retailers as
additional defendants. Plaintiffs’ amended complaint alleged that the retail price of the “prestige” or “Department Store” cosmetics and fragrances
sold in department and specialty stores was collusively controlled by the retailer and manufacturer defendants in violation of the Cartwright Act and
the California Unfair Competition Act.

Plaintiffs sought treble damages and restitution in an unspecified amount, attorneys’ fees and prejudgment interest, on behalf of a class of all
California residents who purchased cosmetics and fragrances for personal use from any of the defendants during the four years prior to the filing
of the original complaints.

While we believe that the plaintiffs’ claims are without merit, we entered into a settlement agreement with the plaintiffs and the other defendants on
July 13, 2003 in order to avoid the cost and distraction of protracted litigation. In furtherance of the settlement agreement, the case was re-filed in
the United States District Court for the Northern District of California on behalf of a class of all persons who currently reside in the United States and
who purchased “Department Store” cosmetics and fragrances from the defendants during the period May 29, 1994 through July 16, 2003. The Court
gave preliminary approval to the settlement, and a summary notice of class certification and the terms of the settlement was disseminated to class
members. On March 30, 2005, the Court entered a final judgment approving the settlement and dismissing the plaintiffs’ claims and the claims of all
class members with prejudice, in their entirety. On April 29, 2005, two class members who had objected to the settlement filed notices of appeal
from the Court’s final judgment to the United States Court of Appeals for the Ninth Circuit. One of the objectors has since dropped her appeal, but the
other filed her appeal brief on March 20, 2006. Plaintiffs’ and defendants’ briefs were filed on May 25, 2006. The remaining objector filed her reply
brief on June 14, 2006. The Ninth Circuit heard oral arguments on the appeal on March 14, 2007. It is uncertain how long the Ninth Circuit will take to
issue its decision or when the appeal will be resolved. If the District Court’s final judgment approving the settlement is affirmed on appeal, or the
appeal is dismissed, the defendants will provide class members with certain free products with an estimated retail value of $175 million and pay the
plaintiffs’ attorneys’ fees, awarded by the Court, of $24 million. We do not believe the outcome of this matter will have a material adverse effect on
our financial condition, results of operations or cash flows.

OTHER
We are involved in routine claims, proceedings, and litigation arising from the normal course of our business. We do not believe any such claim,
proceeding or litigation, either alone or in aggregate, will have a material impact on our financial condition, results of operations, or cash flows.


Item 4. Submission of Matters to a Vote of Security Holders.
None.


                                                                         PART II
Item 5. Market for Registrant’s Common Equity, Related Shareholder Matters and Issuer Purchases of
Equity Securities.
MARKET, SHAREHOLDER, AND DIVIDEND INFORMATION
Our common stock, without par value, is traded on the New York Stock Exchange under the symbol “JWN.” The approximate number of holders
of common stock as of March 14, 2007 was 151,926, based upon the number of registered and beneficial shareholders, as well as the number of
employee shareholders in the Nordstrom 401(k) Plan and Profit Sharing.

The high and low sales prices of our common stock and dividends declared for each quarter of 2006 and 2005 are presented in the table below:

                                                    Common Stock Price
                                        2006                                   2005                                     Dividends per Share
                               High                Low                High               Low                         2006                  2005
1st Quarter                   $42.90             $37.51              $28.14             $23.91                      $0.105                $0.065
2nd Quarter                   $39.50             $31.77              $37.46             $25.22                      $0.105                $0.085
3rd Quarter                   $49.52             $32.97              $37.96             $30.41                      $0.105                $0.085
4th Quarter                   $57.10             $45.37              $42.74             $33.58                      $0.105                $0.085
Full Year                     $57.10             $31.77              $42.74             $23.91                      $0.42                 $0.32


10
REPURCHASES
(Dollars in millions except per share amounts)

A summary of our fourth quarter share repurchases are as follows:

                                                                              Average          Total Number of Shares
                                                    Total Number of         Price Paid         (or Units) Purchased as          Maximum Number (or Approximate Dollar
                                                   Shares (or Units)        Per Share       Part of Publicly Announced        Value) of Shares (or Units) that May Yet Be
                                                                                                                                Purchased Under the Plans or Programs2
Period                                                    Purchased          (or Unit)               Plans or Programs
Nov. 2006 (10/29/06 to 11/25/06)                                  —                  —                              —                                            $617.4
                                                          530,4001
Dec. 2006 (11/26/06 to 12/30/06)                                              $49.09                         529,800                                             $591.4
Jan. 2007 (12/31/06 to 2/3/07)                                    —                  —                              —                                            $591.4
Total                                                     530,400             $49.09                         529,800
1
    Included in this balance are 600 shares that were not redeemed as part of a publicly announced repurchase plan or program. These shares were tendered by an employee to
    Nordstrom for tax withholding purposes.
2
In May 2006, our Board of Directors authorized a $1,000.0 share repurchase program. The prior $500.0 repurchase program, which was started in February 2005, was completed
during the first quarter of 2006. During 2006, we purchased 5,422,362 shares of our common stock for an aggregate purchase price of $212.9 (an average price per share of
$39.27) under the prior repurchase program. We purchased 11,122,977 shares of our common stock for an aggregate purchase price of $408.6 (an average price per share of
$36.74) under the current repurchase program. As of February 3, 2007 the unused authorization was $591.4. The actual amount and timing of future share repurchases will be
subject to market conditions and applicable SEC rules.

STOCK PRICE PERFORMANCE
The following graph compares, for each of the last five fiscal years, ending February 3, 2007, the cumulative total return of Nordstrom, Inc. common
stock, Standard & Poor’s 500 Index and Standard & Poor’s Retail Index. The Retail Index is comprised of 38 retail companies, including the Company,
representing a sector of the Standard & Poor’s 500 Index. The cumulative total return of Nordstrom, Inc. common stock assumes $100 invested on
January 31, 2002 in Nordstrom, Inc. common stock and assumes reinvestment of dividends.


                        End of fiscal year:                             2001           2002           2003           2004            2005           2006
                        Standard & Poor’s 500 Index                      100             76            100            104             114            128
                        Standard & Poor’s Retail Index                   100             71            105            119             129            147
                        Nordstrom, Inc. common stock                     100             73            161            197             354            479


                                                                                                                                                                                        11
                                                                                                                                                     Nordstrom, Inc. and subsidiaries
Item 6. Selected Financial Data.
(Dollars in thousands except sales per square foot and per share amounts)

The following selected financial data are derived from the audited Consolidated Financial Statements and should be read in conjunction with Item 1A
“Risk Factors,” Item 7 “Management’s Discussion and Analysis of Financial Condition and Results of Operation,” and the Consolidated Financial
Statements and the related notes included in Item 8 of this Annual Report on Form 10-K.


                                                                                                                                                              20024
Fiscal year                                                                     2006               2005                 2004              2003                                    2001
Operations
  Net sales                                                             $8,560,698         $7,722,860          $7,131,388 $6,448,678 $5,944,656                          $5,607,687
  Same-store sales percentage increase (decrease)1                             7.5%                6.0%                8.5%        4.1%        1.4%                             (2.9%)
  Gross profit                                                           3,206,749           2,834,837           2,572,000   2,233,132   1,974,634                         1,844,133
  Gross profit rate2                                                          37.5%               36.7%               36.1%       34.6%       33.2%                             32.9%
  Selling, general, and administrative expenses                         (2,296,863)         (2,100,666)         (2,020,233) (1,899,129) (1,783,210)                       (1,698,497)
  Selling, general, and administrative rate3                                  26.8%               27.2%               28.3%       29.4%       30.0%                             30.3%
  Operating income                                                         909,886             734,171             551,767     334,003     191,424                           145,636
  Interest expense, net                                                     (42,758)            (45,300)            (77,428)    (90,952)    (81,921)                          (75,038)
  Other income including finance charges, net                              238,525             196,354             172,942     155,090     139,289                           133,890
                                                                                                                                           195,6245
  Earnings before income tax expense                                     1,105,653             885,225             647,281     398,141                                       204,488
  Earnings before income tax expense as a percentage
                                                                                                                                                            3.3%5
   of net sales                                                               12.9%              11.5%                9.1%               6.2%                                   3.6%
  Net earnings                                                              677,999            551,339             393,450            242,841             90,224             124,688
  Net earnings as a percentage of net sales                                    7.9%               7.1%                5.5%               3.8%               1.5%                2.2%
  Earnings per diluted share                                                  $2.55              $1.98               $1.38              $0.88              $0.33               $0.46
  Dividends per share                                                         $0.42              $0.32               $0.24             $0.205              $0.19               $0.18
  Return on average shareholders’ equity                                      31.8%              28.4%               23.0%              16.2%               6.7%                9.8%
  Sales per square foot                                                        $393              $369                $347               $325               $317                $319

Financial Position (at year end)
  Customer accounts receivable, net                                        $608,599         $566,815             $580,397          $594,900           $606,861            $621,491
  Investment in asset backed securities                                     428,175           561,136              422,416           272,294            124,543              58,539
  Merchandise inventories                                                   997,289           955,978              917,182           901,623            953,112             888,172
  Current assets                                                          2,742,193         2,874,157            2,572,444         2,524,843          2,125,356           2,095,317
  Current liabilities                                                     1,433,143         1,623,312            1,341,152         1,122,559            925,978             986,587
  Land, buildings and equipment, net                                      1,757,215         1,773,871            1,780,366         1,807,778          1,849,961           1,761,082
  Long-term debt, including current portion                                 630,452           934,394            1,030,107         1,234,243          1,350,595           1,424,242
  Shareholders’ equity                                                    2,168,521         2,092,681            1,788,994         1,634,009          1,372,864           1,316,245
  Debt-to-capital ratio                                                       22.5%             30.9%                36.5%             43.0%              49.6%               52.0%
  Book value per share                                                         8.43              7.76                 6.59              5.90               5.07                4.89
  Total assets                                                            4,821,578         4,921,349            4,605,390         4,569,233          4,185,269           4,084,356

Store Information (at year end)
 Full-Line stores                                                               98                 98                  94                 92                88                   80
 Rack and other stores                                                          57                 57                  56                 56                55                   52
 International Façonnable boutiques                                             36                 32                  31                 31                23                   24
 Total square footage                                                   20,170,000         20,070,000          19,397,000         19,138,000        18,428,000           17,048,000
1
 Same-stores include stores that have been open at least one full year at the beginning of the year. Fiscal year 2006 includes an extra week (the 53 rd week) as a result of our 4-5-4
  retail reporting calendar. The 53 rd week is not included in same-store sales calculations.
2
 Gross profit rate is calculated as the gross profit as a percentage of net sales.
3
  Selling, general, and administrative rate is calculated as the selling, general, and administrative expenses as a percentage of net sales.
4
  2002 - The items below amounted to a net $90,638 charge ($71,041, net of tax, or $0.26 per diluted share):
• Selling, general and administrative expenses included an impairment charge of $15,570 related to the write-down of an information technology investment in a supply chain
     software application in our private label business.
• We purchased the outstanding shares of Nordstrom.com, Inc. series C preferred stock for $70,000. The minority interest purchase and reintegration costs resulted in a one-
     time charge of $53,168. No tax benefit was recognized as there was no possibility of a future tax benefit.
• When we adopted SFAS No. 142, Goodwill and Other Intangible Assets, our initial impairment test of the Façonnable Business Unit resulted in an impairment charge to acquired
     tradename of $16,133 and to goodwill of $5,767. The impairment charge is reflected as a cumulative effect of accounting change ($13,359, net of tax).
5
  In 2002, earnings before income tax expense and earnings before income tax expense as a percentage of net sales do not include the cumulative effect of an accounting change
  of $13,359, net of tax of $8,541.


12
(Dollars in thousands except sales per square foot and per share amounts)

                                                                                             20004                19995
Fiscal year                                                                                                                          1998                1997                  1996
Operations
  Net sales                                                                         $5,511,908           $5,144,754         $5,049,182         $4,864,604           $4,457,931
  Same-store sales percentage increase (decrease)1                                          0.3%                (1.1%)            (2.7%)               4.0%                 0.6%
  Gross profit                                                                        1,854,220            1,781,929         1,704,237          1,568,791             1,378,472
  Gross profit rate2                                                                       33.6%                34.6%             33.8%              32.2%                 30.9%
  Selling, general, and administrative expenses                                      (1,722,247)          (1,516,259)       (1,429,837)        (1,338,235)           (1,232,860)
  Selling, general, and administrative rate3                                               31.2%                29.5%             28.3%              27.5%                 27.7%
  Operating income                                                                      131,973              265,670           274,400            230,556               145,612
  Interest expense, net                                                                  (62,698)             (50,396)          (47,091)           (34,250)              (39,400)
  Other income including finance charges, net                                           130,600              116,783           110,414            110,907               135,331
  Earnings before income tax expense                                                    167,018              332,057           337,723            307,213               241,543
  Earnings before income tax expense as a percentage of
   net sales                                                                               3.0%                 6.5%               6.7%                 6.3%                5.4%
  Net earnings                                                                          101,918              202,557            206,723             186,213              146,316
  Net earnings as a percentage of net sales                                                1.8%                 3.9%               4.1%                 3.8%                3.3%
  Earnings per diluted share                                                              $0.39                $0.73              $0.70               $0.60                $0.45
  Dividends per share                                                                    $0.175                $0.16              $0.15             $0.1325               $0.125
  Return on average shareholders’ equity                                                   8.4%                16.3%              15.0%               12.8%                10.2%
  Sales per square foot                                                                   $341                 $349               $362                 $384                $377

Financial Position (at year end)
  Customer accounts receivable, net                                                   $649,504            $557,190            $560,564           $621,704             $661,332
  Investment in asset backed securities                                                  50,183              38,830               7,097             20,158               31,791
  Merchandise inventories                                                               945,687             797,845             750,269            826,045              719,919
  Current assets                                                                      1,812,982           1,564,648           1,668,689          1,613,492            1,549,819
  Current liabilities                                                                   950,568             866,509             794,490            979,031              795,321
  Land, buildings and equipment, net                                                  1,599,938           1,429,492           1,378,006          1,252,513            1,152,454
  Long-term debt, including current portion                                           1,112,296             804,982             868,234            420,865              380,632
  Shareholders’ equity                                                                1,233,445           1,185,614           1,300,545          1,458,950            1,457,084
  Debt-to-capital ratio                                                                   49.2%               42.5%               42.1%              31.9%                27.2%
  Book value per share                                                                     4.61                4.48                4.58                4.78                4.57
  Total assets                                                                        3,608,503           3,062,081           3,103,689          2,890,664            2,726,495

Store Information (at year end)
 Full-Line stores                                                                           77                   71                 67                 65                   62
 Rack and other stores                                                                      43                   33                 30                 27                   21
 International Façonnable boutiques                                                         20                    0                  0                  0                    0
 Total square footage                                                               16,056,000           14,487,000         13,593,000         12,614,000           11,754,000

1
 Same-stores include stores that have been open at least one full year at the beginning of the year.
2
 Gross profit rate is calculated as the gross profit as a percentage of net sales.
3
  Selling, general, and administrative rate is calculated as the selling, general, and administrative expenses as a percentage of net sales.
4
  2000 - The items below amounted to a net $56,084 charge ($34,211, net of tax, or $0.13 per diluted share):
• Selling, general and administrative expenses included a charge of $13,000 for certain severance and other costs related to a change in management.
• We recorded an impairment charge of $10,227, consisting of $9,627 recorded in selling, general and administrative expenses and $600 in interest expense, related to several
    software projects under development that were either impaired or obsolete.
• We held common shares in Streamline, Inc., an Internet grocery and consumer goods delivery company. Streamline ceased its operations effective November 2000, and we
    wrote off our entire investment of $32,857 in Streamline.
5
  1999 - The item below amounted to a net $10,000 charge ($6,111, net of tax, or $0.02 per diluted share):
• Selling, general and administrative expenses included a charge of $10,000 primarily associated with the restructuring of our information technology services area. The charge
     consisted of $4,053 in the disposition of several software projects under development, $2,685 in employee severance and $1,206 in other miscellaneous costs. Additionally,
     we recorded $2,056 related to settlement costs for two lawsuits.


                                                                                                                                                                                        13
                                                                                                                                                     Nordstrom, Inc. and subsidiaries
Item 7. Management’s Discussion and Analysis of Financial Condition and Results of Operations.
Nordstrom is a fashion specialty retailer offering high-quality apparel, shoes, cosmetics and accessories for women, men and children. We offer
a wide selection of brand name and private label merchandise. We offer our products through multiple retail channels including our Full-Line
‘Nordstrom’ stores, our discount ‘Nordstrom Rack’ stores, our ‘Façonnable’ boutiques, our catalogs and on the Internet at www.nordstrom.com.
Our stores are located throughout the United States and we have 36 Façonnable boutiques located in France, Portugal, and Belgium. In addition,
we offer our customers a variety of payment products and services including our loyalty program.

STRATEGIC INITIATIVES
We believe we are well positioned to grow the value of our business by executing our strategy through the following key initiatives: enhancing our
merchandise offering within our existing product categories, improving the shopping experience for our customers across all channels, and continuing
to increase our presence where our customers shop.

Merchandise Strategies
We’ve found that there’s a great deal of opportunity to grow our sales in existing stores simply by earning a greater share of our customers’ business
across multiple product categories. Our new systems and merchandising disciplines have helped us begin to take advantage of opportunities for
increased sales by enhancing our ability to keep inventories fresh and turn them more rapidly. Customers are responding favorably to “newness”
across all merchandise categories, leading to meaningful gains in areas such as men’s apparel, accessories, women’s and kids’ shoes and cosmetics
throughout 2006. A consistently strong performer in 2006 was our designer category, including apparel, shoes and accessories merchandise. We are
continuing to expand our offering of designer merchandise.

Multi-Channel Shopping Experience
Our future success continues to depend upon our ability to provide our customers with a superior and fully integrated shopping experience. As a multi-
channel retailer, we are uniquely positioned to respond to evolving customer needs and expectations. The necessary resources have been committed
and critical projects are underway in this effort. We are installing a new inventory system, and we are expanding both our fulfillment and call centers
in Cedar Rapids, Iowa.

Our online store is essential to creating relationships with many of our most active and loyal customers. Many customers who start shopping with
us online migrate to our stores. By giving customers a more similar shopping experience in-store and online, we’re making progress to become more
relevant to today’s shoppers.

Increase Our Presence
Given the industry consolidation impacting many of our competitors, we see potential to gain market share and grow our business by increasing our
presence where our customers live. Fortunately, we are in an advantageous position to reach new customers through building stores and enhancing
our current ones. We’ve recently launched a $2.8 billion capital plan, with 80% of the dollars allocated to customer-facing investments, primarily new
stores, remodels and relocations.

We will continue with a disciplined approach to real estate acquisitions, adding new stores when and where they pass our criteria. Our current strategy
calls for a 4% to 5% increase in square footage growth through 2011 with 26 new or relocated stores announced through 2011.

OVERVIEW
For the first time in our history, our earnings before income tax expense exceeded $1 billion in 2006. This result was driven primarily by
the combination of continued sales growth, gross profit rate expansion and leverage of selling, general and administrative expenses.
Key highlights include:

          We achieved positive same-store sales growth for the fifth year in a row. Same-store sales increased 7.5% on top of our 6.0% increase in
     •
          2005 and our 8.5% increase in 2004.

          Our gross profit rate increased 75 basis points primarily due to merchandise margin expansion.
     •

          With the sales growth mentioned above, we leveraged our overhead costs, resulting in a 37 basis point improvement in our selling, general
     •
          and administrative expense rate.

          Full year earnings per diluted share increased 28.8% over last year to $2.55.
     •

Like many other retailers, Nordstrom follows the retail 4-5-4 reporting calendar, which included an extra week in fiscal 2006 (the 53rd week).
The 53rd week is not included in same-store sales calculations.


14
nordstrom AnnualReport2006

More Related Content

What's hot

starbucks Annual_Report_2004_part2
starbucks  Annual_Report_2004_part2starbucks  Annual_Report_2004_part2
starbucks Annual_Report_2004_part2finance41
 
omnicom group Q3 2004 Investor Presentation (pdf)
omnicom group  Q3 2004 Investor Presentation (pdf)omnicom group  Q3 2004 Investor Presentation (pdf)
omnicom group Q3 2004 Investor Presentation (pdf)finance22
 
Arvinmeritor2001 Annua lReport
Arvinmeritor2001 Annua lReportArvinmeritor2001 Annua lReport
Arvinmeritor2001 Annua lReportfinance27
 
Apresentação 4 q11 e 2011 eng final
Apresentação 4 q11 e 2011 eng finalApresentação 4 q11 e 2011 eng final
Apresentação 4 q11 e 2011 eng finalLocaliza
 
4Q10 Presentation eng
4Q10 Presentation eng4Q10 Presentation eng
4Q10 Presentation engLocaliza
 
2 Q07 Results Presentation
2 Q07 Results Presentation2 Q07 Results Presentation
2 Q07 Results PresentationLocaliza
 
southwest airline ar03
southwest airline ar03southwest airline ar03
southwest airline ar03finance40
 
2 Q08 Results Presentation
2 Q08 Results Presentation2 Q08 Results Presentation
2 Q08 Results PresentationLocaliza
 

What's hot (10)

starbucks Annual_Report_2004_part2
starbucks  Annual_Report_2004_part2starbucks  Annual_Report_2004_part2
starbucks Annual_Report_2004_part2
 
omnicom group Q3 2004 Investor Presentation (pdf)
omnicom group  Q3 2004 Investor Presentation (pdf)omnicom group  Q3 2004 Investor Presentation (pdf)
omnicom group Q3 2004 Investor Presentation (pdf)
 
Arvinmeritor2001 Annua lReport
Arvinmeritor2001 Annua lReportArvinmeritor2001 Annua lReport
Arvinmeritor2001 Annua lReport
 
WESCO2006AR
WESCO2006ARWESCO2006AR
WESCO2006AR
 
Q2 2009 Earning Report of Knoll Inc.
Q2 2009 Earning Report of Knoll Inc.Q2 2009 Earning Report of Knoll Inc.
Q2 2009 Earning Report of Knoll Inc.
 
Apresentação 4 q11 e 2011 eng final
Apresentação 4 q11 e 2011 eng finalApresentação 4 q11 e 2011 eng final
Apresentação 4 q11 e 2011 eng final
 
4Q10 Presentation eng
4Q10 Presentation eng4Q10 Presentation eng
4Q10 Presentation eng
 
2 Q07 Results Presentation
2 Q07 Results Presentation2 Q07 Results Presentation
2 Q07 Results Presentation
 
southwest airline ar03
southwest airline ar03southwest airline ar03
southwest airline ar03
 
2 Q08 Results Presentation
2 Q08 Results Presentation2 Q08 Results Presentation
2 Q08 Results Presentation
 

Viewers also liked

hps 2011 봄. 별의 디자인수업
hps 2011 봄. 별의 디자인수업hps 2011 봄. 별의 디자인수업
hps 2011 봄. 별의 디자인수업hiiocks kim
 
3bse061776 En Arkema Marseille Migrates To System 800xa Dcs Family
3bse061776 En Arkema Marseille Migrates To System 800xa Dcs Family3bse061776 En Arkema Marseille Migrates To System 800xa Dcs Family
3bse061776 En Arkema Marseille Migrates To System 800xa Dcs FamilyThomas Björklund
 
Power In Your Power Point.Email Version
Power In Your Power Point.Email VersionPower In Your Power Point.Email Version
Power In Your Power Point.Email VersionSaraJoy
 
Gorgeous Tulips Double
Gorgeous Tulips   DoubleGorgeous Tulips   Double
Gorgeous Tulips DoubleDINISHA
 
ameriprise TalkingPoints_2Q06
ameriprise TalkingPoints_2Q06ameriprise TalkingPoints_2Q06
ameriprise TalkingPoints_2Q06finance43
 
Workplace Economy Slides October 2010 To Ad Ova
Workplace Economy Slides October 2010 To Ad OvaWorkplace Economy Slides October 2010 To Ad Ova
Workplace Economy Slides October 2010 To Ad OvaKarolHoutman
 
Wonderful Animals Shots
Wonderful Animals ShotsWonderful Animals Shots
Wonderful Animals ShotsDINISHA
 
AMP_10K_2007
AMP_10K_2007AMP_10K_2007
AMP_10K_2007finance43
 
Managing In A Down Economy
Managing In A Down EconomyManaging In A Down Economy
Managing In A Down Economyrfarnum
 
王蒙《黃昏哲學》.
王蒙《黃昏哲學》.王蒙《黃昏哲學》.
王蒙《黃昏哲學》.Winson Ng
 
ameriprise 4Q06_Release
ameriprise 4Q06_Releaseameriprise 4Q06_Release
ameriprise 4Q06_Releasefinance43
 
Obama’S Mortgage Reduction Plan
Obama’S Mortgage Reduction PlanObama’S Mortgage Reduction Plan
Obama’S Mortgage Reduction PlanRE_Acquisitions
 
The Twelve Commandments Hw
The Twelve Commandments HwThe Twelve Commandments Hw
The Twelve Commandments HwWinson Ng
 
sonic automotive SAHPressReleaseQ208July29
sonic automotive SAHPressReleaseQ208July29sonic automotive SAHPressReleaseQ208July29
sonic automotive SAHPressReleaseQ208July29finance43
 
四川貢嘎山風景區
四川貢嘎山風景區四川貢嘎山風景區
四川貢嘎山風景區Winson Ng
 
"How to Manage my Moodle course" Workshop
"How to Manage my Moodle course" Workshop"How to Manage my Moodle course" Workshop
"How to Manage my Moodle course" WorkshopRobin Popow
 
PRACTICE RANDOM ACTS OF KINDNESS
PRACTICE RANDOM ACTS OF KINDNESSPRACTICE RANDOM ACTS OF KINDNESS
PRACTICE RANDOM ACTS OF KINDNESSDr. Poornima DSouza
 
ameriprise 4Q07_TalkingPoints_FINAL
ameriprise 4Q07_TalkingPoints_FINALameriprise 4Q07_TalkingPoints_FINAL
ameriprise 4Q07_TalkingPoints_FINALfinance43
 
hps 2011 봄 : 미난의 디자인수업
hps 2011 봄 : 미난의 디자인수업hps 2011 봄 : 미난의 디자인수업
hps 2011 봄 : 미난의 디자인수업hiiocks kim
 

Viewers also liked (20)

hps 2011 봄. 별의 디자인수업
hps 2011 봄. 별의 디자인수업hps 2011 봄. 별의 디자인수업
hps 2011 봄. 별의 디자인수업
 
3bse061776 En Arkema Marseille Migrates To System 800xa Dcs Family
3bse061776 En Arkema Marseille Migrates To System 800xa Dcs Family3bse061776 En Arkema Marseille Migrates To System 800xa Dcs Family
3bse061776 En Arkema Marseille Migrates To System 800xa Dcs Family
 
Mother Mary
Mother MaryMother Mary
Mother Mary
 
Power In Your Power Point.Email Version
Power In Your Power Point.Email VersionPower In Your Power Point.Email Version
Power In Your Power Point.Email Version
 
Gorgeous Tulips Double
Gorgeous Tulips   DoubleGorgeous Tulips   Double
Gorgeous Tulips Double
 
ameriprise TalkingPoints_2Q06
ameriprise TalkingPoints_2Q06ameriprise TalkingPoints_2Q06
ameriprise TalkingPoints_2Q06
 
Workplace Economy Slides October 2010 To Ad Ova
Workplace Economy Slides October 2010 To Ad OvaWorkplace Economy Slides October 2010 To Ad Ova
Workplace Economy Slides October 2010 To Ad Ova
 
Wonderful Animals Shots
Wonderful Animals ShotsWonderful Animals Shots
Wonderful Animals Shots
 
AMP_10K_2007
AMP_10K_2007AMP_10K_2007
AMP_10K_2007
 
Managing In A Down Economy
Managing In A Down EconomyManaging In A Down Economy
Managing In A Down Economy
 
王蒙《黃昏哲學》.
王蒙《黃昏哲學》.王蒙《黃昏哲學》.
王蒙《黃昏哲學》.
 
ameriprise 4Q06_Release
ameriprise 4Q06_Releaseameriprise 4Q06_Release
ameriprise 4Q06_Release
 
Obama’S Mortgage Reduction Plan
Obama’S Mortgage Reduction PlanObama’S Mortgage Reduction Plan
Obama’S Mortgage Reduction Plan
 
The Twelve Commandments Hw
The Twelve Commandments HwThe Twelve Commandments Hw
The Twelve Commandments Hw
 
sonic automotive SAHPressReleaseQ208July29
sonic automotive SAHPressReleaseQ208July29sonic automotive SAHPressReleaseQ208July29
sonic automotive SAHPressReleaseQ208July29
 
四川貢嘎山風景區
四川貢嘎山風景區四川貢嘎山風景區
四川貢嘎山風景區
 
"How to Manage my Moodle course" Workshop
"How to Manage my Moodle course" Workshop"How to Manage my Moodle course" Workshop
"How to Manage my Moodle course" Workshop
 
PRACTICE RANDOM ACTS OF KINDNESS
PRACTICE RANDOM ACTS OF KINDNESSPRACTICE RANDOM ACTS OF KINDNESS
PRACTICE RANDOM ACTS OF KINDNESS
 
ameriprise 4Q07_TalkingPoints_FINAL
ameriprise 4Q07_TalkingPoints_FINALameriprise 4Q07_TalkingPoints_FINAL
ameriprise 4Q07_TalkingPoints_FINAL
 
hps 2011 봄 : 미난의 디자인수업
hps 2011 봄 : 미난의 디자인수업hps 2011 봄 : 미난의 디자인수업
hps 2011 봄 : 미난의 디자인수업
 

Similar to nordstrom AnnualReport2006

WESCO AR 2007
WESCO AR 2007WESCO AR 2007
WESCO AR 2007finance34
 
leggett & platt 2006_fin_complete
leggett & platt 2006_fin_completeleggett & platt 2006_fin_complete
leggett & platt 2006_fin_completefinance39
 
WESCO_2005AR
WESCO_2005ARWESCO_2005AR
WESCO_2005ARfinance34
 
WESCO_2005AR
WESCO_2005ARWESCO_2005AR
WESCO_2005ARfinance34
 
nordstrom 2003annualreport
nordstrom 2003annualreportnordstrom 2003annualreport
nordstrom 2003annualreportfinance43
 
nordstrom 2003annualreport
nordstrom 2003annualreportnordstrom 2003annualreport
nordstrom 2003annualreportfinance43
 
leggett & platt 2006_11yr_data
leggett & platt 2006_11yr_dataleggett & platt 2006_11yr_data
leggett & platt 2006_11yr_datafinance39
 
southwest airline ar02
southwest airline ar02southwest airline ar02
southwest airline ar02finance40
 
11 10-2011 - 3 q11 conference call presentation
11 10-2011 - 3 q11 conference call presentation11 10-2011 - 3 q11 conference call presentation
11 10-2011 - 3 q11 conference call presentationArezzori
 
starbucks Annual_Report_2004_part2
starbucks  Annual_Report_2004_part2starbucks  Annual_Report_2004_part2
starbucks Annual_Report_2004_part2finance41
 
4 Q07 Results Presentation
4 Q07 Results Presentation4 Q07 Results Presentation
4 Q07 Results PresentationLocaliza
 
411 3 t12_arezzo_apresentacao_call_eng
411 3 t12_arezzo_apresentacao_call_eng411 3 t12_arezzo_apresentacao_call_eng
411 3 t12_arezzo_apresentacao_call_engArezzori
 
Earnings Release 4Q06 Presentation
Earnings Release 4Q06 PresentationEarnings Release 4Q06 Presentation
Earnings Release 4Q06 PresentationProfarma
 
Earnings Release 4 Q06
Earnings Release 4 Q06Earnings Release 4 Q06
Earnings Release 4 Q06Profarma
 
2 Q07 Results Presentation
2 Q07 Results Presentation2 Q07 Results Presentation
2 Q07 Results PresentationLocaliza
 
357 2 q12_arezzo_presentation
357 2 q12_arezzo_presentation357 2 q12_arezzo_presentation
357 2 q12_arezzo_presentationArezzori
 

Similar to nordstrom AnnualReport2006 (20)

WESCOAR2007
WESCOAR2007WESCOAR2007
WESCOAR2007
 
WESCO AR 2007
WESCO AR 2007WESCO AR 2007
WESCO AR 2007
 
WESCOAR2007
WESCOAR2007WESCOAR2007
WESCOAR2007
 
leggett & platt 2006_fin_complete
leggett & platt 2006_fin_completeleggett & platt 2006_fin_complete
leggett & platt 2006_fin_complete
 
WESCO_2005AR
WESCO_2005ARWESCO_2005AR
WESCO_2005AR
 
WESCO_2005AR
WESCO_2005ARWESCO_2005AR
WESCO_2005AR
 
nordstrom 2003annualreport
nordstrom 2003annualreportnordstrom 2003annualreport
nordstrom 2003annualreport
 
nordstrom 2003annualreport
nordstrom 2003annualreportnordstrom 2003annualreport
nordstrom 2003annualreport
 
leggett & platt 2006_11yr_data
leggett & platt 2006_11yr_dataleggett & platt 2006_11yr_data
leggett & platt 2006_11yr_data
 
southwest airline ar02
southwest airline ar02southwest airline ar02
southwest airline ar02
 
11 10-2011 - 3 q11 conference call presentation
11 10-2011 - 3 q11 conference call presentation11 10-2011 - 3 q11 conference call presentation
11 10-2011 - 3 q11 conference call presentation
 
starbucks Annual_Report_2004_part2
starbucks  Annual_Report_2004_part2starbucks  Annual_Report_2004_part2
starbucks Annual_Report_2004_part2
 
4 Q07 Results Presentation
4 Q07 Results Presentation4 Q07 Results Presentation
4 Q07 Results Presentation
 
WESCO2006AR
WESCO2006ARWESCO2006AR
WESCO2006AR
 
411 3 t12_arezzo_apresentacao_call_eng
411 3 t12_arezzo_apresentacao_call_eng411 3 t12_arezzo_apresentacao_call_eng
411 3 t12_arezzo_apresentacao_call_eng
 
Q2 2012 Financial Highlights
Q2 2012 Financial HighlightsQ2 2012 Financial Highlights
Q2 2012 Financial Highlights
 
Earnings Release 4Q06 Presentation
Earnings Release 4Q06 PresentationEarnings Release 4Q06 Presentation
Earnings Release 4Q06 Presentation
 
Earnings Release 4 Q06
Earnings Release 4 Q06Earnings Release 4 Q06
Earnings Release 4 Q06
 
2 Q07 Results Presentation
2 Q07 Results Presentation2 Q07 Results Presentation
2 Q07 Results Presentation
 
357 2 q12_arezzo_presentation
357 2 q12_arezzo_presentation357 2 q12_arezzo_presentation
357 2 q12_arezzo_presentation
 

More from finance43

nordstrom R2001AR
nordstrom R2001ARnordstrom R2001AR
nordstrom R2001ARfinance43
 
nordstrom R2001AR
nordstrom R2001ARnordstrom R2001AR
nordstrom R2001ARfinance43
 
nordstrom R2002AR
nordstrom R2002ARnordstrom R2002AR
nordstrom R2002ARfinance43
 
nordstrom R2002AR
nordstrom R2002ARnordstrom R2002AR
nordstrom R2002ARfinance43
 
nordstrom 2004_AR
nordstrom 2004_ARnordstrom 2004_AR
nordstrom 2004_ARfinance43
 
nordstrom 2004_AR
nordstrom 2004_ARnordstrom 2004_AR
nordstrom 2004_ARfinance43
 
nordstrom 4AF8C938-BCC4-4A47-BC67-CACBB3E4E66F_JWN200810-K
nordstrom 4AF8C938-BCC4-4A47-BC67-CACBB3E4E66F_JWN200810-Knordstrom 4AF8C938-BCC4-4A47-BC67-CACBB3E4E66F_JWN200810-K
nordstrom 4AF8C938-BCC4-4A47-BC67-CACBB3E4E66F_JWN200810-Kfinance43
 
nordstrom 4AF8C938-BCC4-4A47-BC67-CACBB3E4E66F_JWN200810-K
nordstrom 4AF8C938-BCC4-4A47-BC67-CACBB3E4E66F_JWN200810-Knordstrom 4AF8C938-BCC4-4A47-BC67-CACBB3E4E66F_JWN200810-K
nordstrom 4AF8C938-BCC4-4A47-BC67-CACBB3E4E66F_JWN200810-Kfinance43
 
nordstrom AnnualReport2006
nordstrom AnnualReport2006nordstrom AnnualReport2006
nordstrom AnnualReport2006finance43
 
nordstrom JWN2007Form10K
nordstrom JWN2007Form10Knordstrom JWN2007Form10K
nordstrom JWN2007Form10Kfinance43
 
nordstrom JWN2007Form10K
nordstrom JWN2007Form10Knordstrom JWN2007Form10K
nordstrom JWN2007Form10Kfinance43
 
nordstrom 4AF8C938-BCC4-4A47-BC67-CACBB3E4E66F_JWN200810-K
nordstrom 4AF8C938-BCC4-4A47-BC67-CACBB3E4E66F_JWN200810-Knordstrom 4AF8C938-BCC4-4A47-BC67-CACBB3E4E66F_JWN200810-K
nordstrom 4AF8C938-BCC4-4A47-BC67-CACBB3E4E66F_JWN200810-Kfinance43
 
nordstrom 4AF8C938-BCC4-4A47-BC67-CACBB3E4E66F_JWN200810-K
nordstrom 4AF8C938-BCC4-4A47-BC67-CACBB3E4E66F_JWN200810-Knordstrom 4AF8C938-BCC4-4A47-BC67-CACBB3E4E66F_JWN200810-K
nordstrom 4AF8C938-BCC4-4A47-BC67-CACBB3E4E66F_JWN200810-Kfinance43
 
sonic automotive SAHStephens20June20Conference20Presentation
sonic automotive SAHStephens20June20Conference20Presentationsonic automotive SAHStephens20June20Conference20Presentation
sonic automotive SAHStephens20June20Conference20Presentationfinance43
 
sonic automotive SAHStephens20June20Conference20Presentation
sonic automotive SAHStephens20June20Conference20Presentationsonic automotive SAHStephens20June20Conference20Presentation
sonic automotive SAHStephens20June20Conference20Presentationfinance43
 
sonic automotive SAHPressReleaseQ208July29
sonic automotive SAHPressReleaseQ208July29sonic automotive SAHPressReleaseQ208July29
sonic automotive SAHPressReleaseQ208July29finance43
 

More from finance43 (20)

NOR99AR
NOR99ARNOR99AR
NOR99AR
 
NOR99AR
NOR99ARNOR99AR
NOR99AR
 
NOR2000AR
NOR2000ARNOR2000AR
NOR2000AR
 
NOR2000AR
NOR2000ARNOR2000AR
NOR2000AR
 
nordstrom R2001AR
nordstrom R2001ARnordstrom R2001AR
nordstrom R2001AR
 
nordstrom R2001AR
nordstrom R2001ARnordstrom R2001AR
nordstrom R2001AR
 
nordstrom R2002AR
nordstrom R2002ARnordstrom R2002AR
nordstrom R2002AR
 
nordstrom R2002AR
nordstrom R2002ARnordstrom R2002AR
nordstrom R2002AR
 
nordstrom 2004_AR
nordstrom 2004_ARnordstrom 2004_AR
nordstrom 2004_AR
 
nordstrom 2004_AR
nordstrom 2004_ARnordstrom 2004_AR
nordstrom 2004_AR
 
nordstrom 4AF8C938-BCC4-4A47-BC67-CACBB3E4E66F_JWN200810-K
nordstrom 4AF8C938-BCC4-4A47-BC67-CACBB3E4E66F_JWN200810-Knordstrom 4AF8C938-BCC4-4A47-BC67-CACBB3E4E66F_JWN200810-K
nordstrom 4AF8C938-BCC4-4A47-BC67-CACBB3E4E66F_JWN200810-K
 
nordstrom 4AF8C938-BCC4-4A47-BC67-CACBB3E4E66F_JWN200810-K
nordstrom 4AF8C938-BCC4-4A47-BC67-CACBB3E4E66F_JWN200810-Knordstrom 4AF8C938-BCC4-4A47-BC67-CACBB3E4E66F_JWN200810-K
nordstrom 4AF8C938-BCC4-4A47-BC67-CACBB3E4E66F_JWN200810-K
 
nordstrom AnnualReport2006
nordstrom AnnualReport2006nordstrom AnnualReport2006
nordstrom AnnualReport2006
 
nordstrom JWN2007Form10K
nordstrom JWN2007Form10Knordstrom JWN2007Form10K
nordstrom JWN2007Form10K
 
nordstrom JWN2007Form10K
nordstrom JWN2007Form10Knordstrom JWN2007Form10K
nordstrom JWN2007Form10K
 
nordstrom 4AF8C938-BCC4-4A47-BC67-CACBB3E4E66F_JWN200810-K
nordstrom 4AF8C938-BCC4-4A47-BC67-CACBB3E4E66F_JWN200810-Knordstrom 4AF8C938-BCC4-4A47-BC67-CACBB3E4E66F_JWN200810-K
nordstrom 4AF8C938-BCC4-4A47-BC67-CACBB3E4E66F_JWN200810-K
 
nordstrom 4AF8C938-BCC4-4A47-BC67-CACBB3E4E66F_JWN200810-K
nordstrom 4AF8C938-BCC4-4A47-BC67-CACBB3E4E66F_JWN200810-Knordstrom 4AF8C938-BCC4-4A47-BC67-CACBB3E4E66F_JWN200810-K
nordstrom 4AF8C938-BCC4-4A47-BC67-CACBB3E4E66F_JWN200810-K
 
sonic automotive SAHStephens20June20Conference20Presentation
sonic automotive SAHStephens20June20Conference20Presentationsonic automotive SAHStephens20June20Conference20Presentation
sonic automotive SAHStephens20June20Conference20Presentation
 
sonic automotive SAHStephens20June20Conference20Presentation
sonic automotive SAHStephens20June20Conference20Presentationsonic automotive SAHStephens20June20Conference20Presentation
sonic automotive SAHStephens20June20Conference20Presentation
 
sonic automotive SAHPressReleaseQ208July29
sonic automotive SAHPressReleaseQ208July29sonic automotive SAHPressReleaseQ208July29
sonic automotive SAHPressReleaseQ208July29
 

Recently uploaded

The Economic History of the U.S. Lecture 18.pdf
The Economic History of the U.S. Lecture 18.pdfThe Economic History of the U.S. Lecture 18.pdf
The Economic History of the U.S. Lecture 18.pdfGale Pooley
 
VVIP Pune Call Girls Katraj (7001035870) Pune Escorts Nearby with Complete Sa...
VVIP Pune Call Girls Katraj (7001035870) Pune Escorts Nearby with Complete Sa...VVIP Pune Call Girls Katraj (7001035870) Pune Escorts Nearby with Complete Sa...
VVIP Pune Call Girls Katraj (7001035870) Pune Escorts Nearby with Complete Sa...Call Girls in Nagpur High Profile
 
Malad Call Girl in Services 9892124323 | ₹,4500 With Room Free Delivery
Malad Call Girl in Services  9892124323 | ₹,4500 With Room Free DeliveryMalad Call Girl in Services  9892124323 | ₹,4500 With Room Free Delivery
Malad Call Girl in Services 9892124323 | ₹,4500 With Room Free DeliveryPooja Nehwal
 
High Class Call Girls Nagpur Grishma Call 7001035870 Meet With Nagpur Escorts
High Class Call Girls Nagpur Grishma Call 7001035870 Meet With Nagpur EscortsHigh Class Call Girls Nagpur Grishma Call 7001035870 Meet With Nagpur Escorts
High Class Call Girls Nagpur Grishma Call 7001035870 Meet With Nagpur Escortsranjana rawat
 
Independent Lucknow Call Girls 8923113531WhatsApp Lucknow Call Girls make you...
Independent Lucknow Call Girls 8923113531WhatsApp Lucknow Call Girls make you...Independent Lucknow Call Girls 8923113531WhatsApp Lucknow Call Girls make you...
Independent Lucknow Call Girls 8923113531WhatsApp Lucknow Call Girls make you...makika9823
 
VIP Call Girls LB Nagar ( Hyderabad ) Phone 8250192130 | ₹5k To 25k With Room...
VIP Call Girls LB Nagar ( Hyderabad ) Phone 8250192130 | ₹5k To 25k With Room...VIP Call Girls LB Nagar ( Hyderabad ) Phone 8250192130 | ₹5k To 25k With Room...
VIP Call Girls LB Nagar ( Hyderabad ) Phone 8250192130 | ₹5k To 25k With Room...Suhani Kapoor
 
02_Fabio Colombo_Accenture_MeetupDora&Cybersecurity.pptx
02_Fabio Colombo_Accenture_MeetupDora&Cybersecurity.pptx02_Fabio Colombo_Accenture_MeetupDora&Cybersecurity.pptx
02_Fabio Colombo_Accenture_MeetupDora&Cybersecurity.pptxFinTech Belgium
 
Instant Issue Debit Cards - School Designs
Instant Issue Debit Cards - School DesignsInstant Issue Debit Cards - School Designs
Instant Issue Debit Cards - School Designsegoetzinger
 
Call US 📞 9892124323 ✅ Kurla Call Girls In Kurla ( Mumbai ) secure service
Call US 📞 9892124323 ✅ Kurla Call Girls In Kurla ( Mumbai ) secure serviceCall US 📞 9892124323 ✅ Kurla Call Girls In Kurla ( Mumbai ) secure service
Call US 📞 9892124323 ✅ Kurla Call Girls In Kurla ( Mumbai ) secure servicePooja Nehwal
 
Russian Call Girls In Gtb Nagar (Delhi) 9711199012 💋✔💕😘 Naughty Call Girls Se...
Russian Call Girls In Gtb Nagar (Delhi) 9711199012 💋✔💕😘 Naughty Call Girls Se...Russian Call Girls In Gtb Nagar (Delhi) 9711199012 💋✔💕😘 Naughty Call Girls Se...
Russian Call Girls In Gtb Nagar (Delhi) 9711199012 💋✔💕😘 Naughty Call Girls Se...shivangimorya083
 
00_Main ppt_MeetupDORA&CyberSecurity.pptx
00_Main ppt_MeetupDORA&CyberSecurity.pptx00_Main ppt_MeetupDORA&CyberSecurity.pptx
00_Main ppt_MeetupDORA&CyberSecurity.pptxFinTech Belgium
 
Dharavi Russian callg Girls, { 09892124323 } || Call Girl In Mumbai ...
Dharavi Russian callg Girls, { 09892124323 } || Call Girl In Mumbai ...Dharavi Russian callg Girls, { 09892124323 } || Call Girl In Mumbai ...
Dharavi Russian callg Girls, { 09892124323 } || Call Girl In Mumbai ...Pooja Nehwal
 
Call Girls In Yusuf Sarai Women Seeking Men 9654467111
Call Girls In Yusuf Sarai Women Seeking Men 9654467111Call Girls In Yusuf Sarai Women Seeking Men 9654467111
Call Girls In Yusuf Sarai Women Seeking Men 9654467111Sapana Sha
 
20240429 Calibre April 2024 Investor Presentation.pdf
20240429 Calibre April 2024 Investor Presentation.pdf20240429 Calibre April 2024 Investor Presentation.pdf
20240429 Calibre April 2024 Investor Presentation.pdfAdnet Communications
 
Q3 2024 Earnings Conference Call and Webcast Slides
Q3 2024 Earnings Conference Call and Webcast SlidesQ3 2024 Earnings Conference Call and Webcast Slides
Q3 2024 Earnings Conference Call and Webcast SlidesMarketing847413
 
Vip B Aizawl Call Girls #9907093804 Contact Number Escorts Service Aizawl
Vip B Aizawl Call Girls #9907093804 Contact Number Escorts Service AizawlVip B Aizawl Call Girls #9907093804 Contact Number Escorts Service Aizawl
Vip B Aizawl Call Girls #9907093804 Contact Number Escorts Service Aizawlmakika9823
 
Best VIP Call Girls Noida Sector 18 Call Me: 8448380779
Best VIP Call Girls Noida Sector 18 Call Me: 8448380779Best VIP Call Girls Noida Sector 18 Call Me: 8448380779
Best VIP Call Girls Noida Sector 18 Call Me: 8448380779Delhi Call girls
 
Andheri Call Girls In 9825968104 Mumbai Hot Models
Andheri Call Girls In 9825968104 Mumbai Hot ModelsAndheri Call Girls In 9825968104 Mumbai Hot Models
Andheri Call Girls In 9825968104 Mumbai Hot Modelshematsharma006
 

Recently uploaded (20)

The Economic History of the U.S. Lecture 18.pdf
The Economic History of the U.S. Lecture 18.pdfThe Economic History of the U.S. Lecture 18.pdf
The Economic History of the U.S. Lecture 18.pdf
 
VVIP Pune Call Girls Katraj (7001035870) Pune Escorts Nearby with Complete Sa...
VVIP Pune Call Girls Katraj (7001035870) Pune Escorts Nearby with Complete Sa...VVIP Pune Call Girls Katraj (7001035870) Pune Escorts Nearby with Complete Sa...
VVIP Pune Call Girls Katraj (7001035870) Pune Escorts Nearby with Complete Sa...
 
Malad Call Girl in Services 9892124323 | ₹,4500 With Room Free Delivery
Malad Call Girl in Services  9892124323 | ₹,4500 With Room Free DeliveryMalad Call Girl in Services  9892124323 | ₹,4500 With Room Free Delivery
Malad Call Girl in Services 9892124323 | ₹,4500 With Room Free Delivery
 
High Class Call Girls Nagpur Grishma Call 7001035870 Meet With Nagpur Escorts
High Class Call Girls Nagpur Grishma Call 7001035870 Meet With Nagpur EscortsHigh Class Call Girls Nagpur Grishma Call 7001035870 Meet With Nagpur Escorts
High Class Call Girls Nagpur Grishma Call 7001035870 Meet With Nagpur Escorts
 
Independent Lucknow Call Girls 8923113531WhatsApp Lucknow Call Girls make you...
Independent Lucknow Call Girls 8923113531WhatsApp Lucknow Call Girls make you...Independent Lucknow Call Girls 8923113531WhatsApp Lucknow Call Girls make you...
Independent Lucknow Call Girls 8923113531WhatsApp Lucknow Call Girls make you...
 
VIP Call Girls LB Nagar ( Hyderabad ) Phone 8250192130 | ₹5k To 25k With Room...
VIP Call Girls LB Nagar ( Hyderabad ) Phone 8250192130 | ₹5k To 25k With Room...VIP Call Girls LB Nagar ( Hyderabad ) Phone 8250192130 | ₹5k To 25k With Room...
VIP Call Girls LB Nagar ( Hyderabad ) Phone 8250192130 | ₹5k To 25k With Room...
 
02_Fabio Colombo_Accenture_MeetupDora&Cybersecurity.pptx
02_Fabio Colombo_Accenture_MeetupDora&Cybersecurity.pptx02_Fabio Colombo_Accenture_MeetupDora&Cybersecurity.pptx
02_Fabio Colombo_Accenture_MeetupDora&Cybersecurity.pptx
 
Veritas Interim Report 1 January–31 March 2024
Veritas Interim Report 1 January–31 March 2024Veritas Interim Report 1 January–31 March 2024
Veritas Interim Report 1 January–31 March 2024
 
Instant Issue Debit Cards - School Designs
Instant Issue Debit Cards - School DesignsInstant Issue Debit Cards - School Designs
Instant Issue Debit Cards - School Designs
 
Call US 📞 9892124323 ✅ Kurla Call Girls In Kurla ( Mumbai ) secure service
Call US 📞 9892124323 ✅ Kurla Call Girls In Kurla ( Mumbai ) secure serviceCall US 📞 9892124323 ✅ Kurla Call Girls In Kurla ( Mumbai ) secure service
Call US 📞 9892124323 ✅ Kurla Call Girls In Kurla ( Mumbai ) secure service
 
Russian Call Girls In Gtb Nagar (Delhi) 9711199012 💋✔💕😘 Naughty Call Girls Se...
Russian Call Girls In Gtb Nagar (Delhi) 9711199012 💋✔💕😘 Naughty Call Girls Se...Russian Call Girls In Gtb Nagar (Delhi) 9711199012 💋✔💕😘 Naughty Call Girls Se...
Russian Call Girls In Gtb Nagar (Delhi) 9711199012 💋✔💕😘 Naughty Call Girls Se...
 
00_Main ppt_MeetupDORA&CyberSecurity.pptx
00_Main ppt_MeetupDORA&CyberSecurity.pptx00_Main ppt_MeetupDORA&CyberSecurity.pptx
00_Main ppt_MeetupDORA&CyberSecurity.pptx
 
Dharavi Russian callg Girls, { 09892124323 } || Call Girl In Mumbai ...
Dharavi Russian callg Girls, { 09892124323 } || Call Girl In Mumbai ...Dharavi Russian callg Girls, { 09892124323 } || Call Girl In Mumbai ...
Dharavi Russian callg Girls, { 09892124323 } || Call Girl In Mumbai ...
 
Commercial Bank Economic Capsule - April 2024
Commercial Bank Economic Capsule - April 2024Commercial Bank Economic Capsule - April 2024
Commercial Bank Economic Capsule - April 2024
 
Call Girls In Yusuf Sarai Women Seeking Men 9654467111
Call Girls In Yusuf Sarai Women Seeking Men 9654467111Call Girls In Yusuf Sarai Women Seeking Men 9654467111
Call Girls In Yusuf Sarai Women Seeking Men 9654467111
 
20240429 Calibre April 2024 Investor Presentation.pdf
20240429 Calibre April 2024 Investor Presentation.pdf20240429 Calibre April 2024 Investor Presentation.pdf
20240429 Calibre April 2024 Investor Presentation.pdf
 
Q3 2024 Earnings Conference Call and Webcast Slides
Q3 2024 Earnings Conference Call and Webcast SlidesQ3 2024 Earnings Conference Call and Webcast Slides
Q3 2024 Earnings Conference Call and Webcast Slides
 
Vip B Aizawl Call Girls #9907093804 Contact Number Escorts Service Aizawl
Vip B Aizawl Call Girls #9907093804 Contact Number Escorts Service AizawlVip B Aizawl Call Girls #9907093804 Contact Number Escorts Service Aizawl
Vip B Aizawl Call Girls #9907093804 Contact Number Escorts Service Aizawl
 
Best VIP Call Girls Noida Sector 18 Call Me: 8448380779
Best VIP Call Girls Noida Sector 18 Call Me: 8448380779Best VIP Call Girls Noida Sector 18 Call Me: 8448380779
Best VIP Call Girls Noida Sector 18 Call Me: 8448380779
 
Andheri Call Girls In 9825968104 Mumbai Hot Models
Andheri Call Girls In 9825968104 Mumbai Hot ModelsAndheri Call Girls In 9825968104 Mumbai Hot Models
Andheri Call Girls In 9825968104 Mumbai Hot Models
 

nordstrom AnnualReport2006

  • 1. the business of FASHION NORDSTROM, INC. ANNUAL REPORT 2006
  • 2. Dollars in thousands except per share amounts Fiscal Year 2006 2005 % Change Net sales $8,560,698 $7,722,860 10.8 Earnings before income tax expense 1,105,653 885,225 24.9 Net earnings 677,999 551,339 23.0 Basic earnings per share 2.60 2.03 28.1 Diluted earnings per share 2.55 1.98 28.8 Cash dividends paid per share 0.42 0.32 31.3 37.5% 36.7% 36.1% $393 30.0% 29.4% $369 34.6% 28.3% $347 33.2% $325 27.2% 8.5% $317 7.5% 26.8% 6.0% 4.1% 1.4% 2002 2003 2004 2005 2006 2002 2003 2004 2005 2006 2002 2003 2004 2005 2006 Sales per Square Foot and Gross Profit SG&A Expense Same-store Sales Percentage Change (as a Percentage of Net Sales) (as a Percentage of Net Sales) $1,142.4 12.9% 5.06 $776.2 11.5% 4.84 4.51 4.10 $606.3 $599.3 9.1% 3.85 6.2% $390.5 3.3% 2002 2003 2004 2005 2006 2002 2003 2004 2005 2006 2002 2003 2004 2005 2006 Earnings before Income Tax Expense Inventory Turn Cash Flow from Operations (as a Percentage of Net Sales)1 (cost of sales and related buying and (in millions) occupancy divided by average inventory) 1 See Note 5 on page 12 regarding the 2002 change in accounting
  • 3. For Nordstrom, FASHION IS PERSONAL We don’t dictate. We suggest, collaborate, teach, inspire and engage. We’re the matchmaker, guiding our customer to discover ‘the one.’ We don’t just sell clothes on a hanger. We’re in the business of making people feel great.
  • 4.
  • 5.
  • 6.
  • 7.
  • 8.
  • 9.
  • 10.
  • 11.
  • 12. DEAR customers, employees and shareholders, We’re pleased to report that 2006 was another year of strong financial performance and exciting progress for Nordstrom. Before we get into the highlights, we’d like to thank our customers for their continued support and assure you that we’re dedicating all our resources to improving the shopping experience you have with Nordstrom in the days, months and years ahead. Across every aspect of our business, we’re gaining a more clear understanding of how to best serve our customers. While we continue to remain true to the roots of our company, our approach to the business has evolved. Our investments in new technology and systems over the last five years have laid the foundation for more accurate decision making. Improved operating disciplines and cost controls have led to a higher return on investment. And a focus on continuous improvement by our entire team is helping us enhance the customer experience — through service and merchandise — one customer at a time. We are incredibly proud of our salespeople, merchants and all the individuals behind the scenes who have contributed so much to our achievements this past year. Let’s review the highlights: • Total sales increased 10.8% to a record $8.6 billion — our fifth consecutive year of same-store sales gains. • Improving store productivity translated to a return on investment (ROIC) of over 20%, and sales of $388 per square foot on a 52-week basis. • Our Gross Profit rate was 37.5%, which topped last year’s record of 36.7%. • Our SG&A rate (expenses as a percentage of net sales) improved for the sixth year in a row, at 26.8%. This year our SG&A includes stock option expense. • Our Earnings Before Taxes (EBT) exceeded $1 billion for the first time ever. • Another milestone: due to an increase in regular price selling and improved operational efficiencies, our EBT margin of 12.9% was a record high, exceeding last year’s record of 11.5%. • Nordstrom stock reached its highest level in our company’s history at over $57 after adjusting for splits.
  • 13. As 2007 progresses, we grow more excited about what lies ahead for the future of our company. The milestone year of 2006 by no means signifies a ceiling in terms of growth. We believe we are uniquely positioned to grow the value of our business through some highly focused initiatives, which are: advancing current merchandise strategies within our existing product categories, improving the shopping experience across all channels and continuing to increase our presence where our customers shop. Every merchandise strategy begins with our customers and what they want. In the last few years, we’ve taken great strides in better understanding our customer. We’ve found that there’s a great deal of opportunity to grow our sales in existing stores simply by earning a greater share of our customers’ business across multiple product categories. Our new systems and merchandising disciplines have helped us begin to tap into that business by enhancing our ability to keep inventories fresh and turn them more rapidly. Customers are responding to this “newness” across all merchandise categories, leading to impressive results in areas such as men’s, accessories, shoes and cosmetics, and improved performance in women’s apparel. A consistently strong performer in 2006 was our designer business and we’ll continue to expand the selection of designer merchandise at Nordstrom. Our overall goal is to give the customer a compelling reason to buy something new. Second, we need to be where our customers are shopping — whether that’s online or in stores. We’ve found that customers who start shopping online typically gravitate to our stores and those customers who shop both online and in our full-line stores purchase more merchandise. By giving customers the power to choose, and by offering a similar shopping experience in store and online, we’re providing a level of service increasingly relevant to today’s shoppers. One example of continuing to improve the experience across channels is the upcoming expansion of our Fulfillment and Contact Center in Cedar Rapids, Iowa. This facility will give our team more capability to serve customers who want to purchase items over the phone, online, or in any of our stores. Another investment that will help us serve our customer better is technology that will enable our salespeople to have a single view of total company inventory. This system enhancement, scheduled for completion in early 2008, will further expedite the search and fulfillment process for customer requests. Finally, given the industry consolidation impacting many of our competitors, we see tremendous potential to gain market share and grow our business. Fortunately, we are in an advantageous position to reach new customers through building stores and enhancing our current ones. We’ve recently launched a $2.8 billion capital plan, with 80% of the dollars allocated to ”customer-facing“ issues like new stores, remodels and relocations. The good news is that we have the resources to fund this plan, and it’s the highest value use of our capital.
  • 14. We will continue with a disciplined approach to real estate acquisitions, adding new stores when and where they pass our criteria. Our current strategy calls for a 4–5% increase in square footage growth, with 26 new and relocated stores announced through 2011. We particularly want to take this opportunity to share with you how excited we are about the opening of our first store in the Boston area this fall at Natick Collection. We have wanted to open a store in Boston for many years. Outside of Manhattan, it is the last major market in the U.S. where we have not had a presence; now we’ll have four stores there in the next four years. Also opening this fall will be new stores at Twelve Oaks Mall in Novi, Michigan; Cherry Creek Shopping Center in Denver, Colorado; and a new Nordstrom Rack at Southcenter Square in Tukwila, Washington. Growth opportunities are a direct outcome of a strong performing store base — therefore, our number-one priority is to make Nordstrom the best it can be, both in terms of overall shopping experience and achieving sales potential. We believe the significant progress we’ve made is just the beginning of a tremendous opportunity to build even more relationships with our customers. By focusing on the initiatives we’ve laid out, we know there is more market share to be gained. Our company is unique in many ways. We are especially fortunate to have the diversity of talented individuals who bring their energy and ideas every day. There’s Eulia Saurwein at our Southcenter store in Tukwila, Washington, who’s been a top-selling ”Pacesetter“ a remarkable 31 years in a row. There’s Kimberly Lucas, a 2006 graduate of our Future Nordstrom Leaders program, now the “via C” manager at our Houston, Texas store. And there’s Kristie Brousseau who, at 100 years of age, continues to bring smiles to the customers at our Nordstrom Cafe in downtown Seattle. We’d also like to thank Ray Ahana of Hawaii, our longest tenured manager, and Hazel Martin, a shoe salesperson from Oregon, who both retired this past year after successful careers of 39 and 51 years respectively. Our summer internship program continues to grow, with about 400 energetic and diverse college students joining us this past year. Ana Jimenez, a former intern and University of Washington graduate, was recently promoted to be our Northwest Diversity Affairs Assistant. Kimiko Saito, another intern and U.C. San Diego graduate, is now our Women’s Active Manager at University Towne Center in San Diego. As our company grows, we continue to take pride in the many people excited to build on the traditions of service and product that define Nordstrom. As you can see, there is a great deal of optimism on our end for the future of our company. If we focus on being the best Nordstrom we can be — as we continue to evolve — there’s tremendous upside ahead. On behalf of our executive team, we’d like to thank you for your continued support. Sincerely, Blake W. Nordstrom President, Nordstrom, Inc.
  • 15. A NOTE from our Chairman Ten years ago I joined the Nordstrom Board. Since that time, I have come to develop an ever greater appreciation of the special qualities and characteristics that set Nordstrom apart from many other businesses — its honesty, competitive spirit, high ethical standards and unyielding commitment to the customer. Last year, I had the honor of succeeding Bruce Nordstrom as Chairman of the Board. Bruce retired after 40 years of outstanding service to the board and even more years serving as a company leader alongside his cousins from the Nordstrom family’s third generation. In 2000, the board created the lead independent director position, a move somewhat uncommon in American business. After serving as lead director for six years, I succeeded Bruce as non-executive chairman. This arrangement reflects the ongoing effort by Nordstrom to utilize sound and transparent governance practices appropriate for this unique company. Many of these practices, including the longstanding Nordstrom tradition that each director stand for election each year, are now viewed as best practices in the current, post Sarbanes-Oxley era. Our board is composed of nine directors, six of whom are independent and three of whom are members of the Nordstrom family. Our goal is to provide a balance of experience, talents and perspectives that complements the expertise of our leadership team. I could not be more proud to serve with the individuals on this board, or be more grateful for their wisdom and leadership, as we address the many business opportunities that lie ahead for Nordstrom. The past year demonstrates the power of literally tens of thousands of individuals working together to move our organization forward. The pieces that are in place fill me with gratitude for where we are as a company, as well as great enthusiasm for the bright promise of Nordstrom’s future. The women and men of this company have driven superior results by executing a highly focused and narrow set of initiatives, always through the lens of serving the customer while remaining true to the company’s values. There is no doubt that this customer focus will remain the foundation for Nordstrom in the years ahead, and that every effort will be made to ensure that the company’s distinctive character shines through at each and every Nordstrom location. The hard work and drive of the Nordstrom team has not gone unnoticed. In 2007, Nordstrom was named for the tenth time by Fortune magazine as one of the “100 Best Places to Work” and for the second year in a row as the number-one “Most Admired Company” in its industry category. Last year, Nordstrom also was named one of the “100 Best Corporate Citizens” by Business Ethics; named one of the “Top Employers for Minorities” by Fortune magazine; and honored as “Retailer of the Year” by the American Apparel and Footwear Association. In conclusion, I thank you for your interest in this great company. While the people of Nordstrom have accomplished many wonderful things over the last 106 years, I firmly believe that with its amazing team of people and strong leadership, the best years for Nordstrom are yet to come. Enrique Hernandez, Jr. Non-Executive Chairman
  • 16.
  • 17. FINANCIALS 2006
  • 18. [This page intentionally left blank.] 2
  • 19. UNITED STATES SECURITIES AND EXCHANGE COMMISSION Washington, D.C. 20549 FORM 10-K (Mark One)  ANNUAL REPORT PURSUANT TO SECTION 13 OR 15(d) OF THE SECURITIES EXCHANGE ACT OF 1934 For the fiscal year ended February 3, 2007 OR  TRANSITION REPORT PURSUANT TO SECTION 13 OR 15(d) OF THE SECURITIES EXCHANGE ACT OF 1934 For the transition period from______________ to ______________ Commission file number 001-15059 NORDSTROM, INC. (Exact name of Registrant as specified in its charter) Washington 91-0515058 (State or other jurisdiction of (IRS employer incorporation or organization) Identification No.) 1617 Sixth Avenue, Seattle, Washington 98101 (Address of principal executive offices) (Zip code) Registrant’s telephone number, including area code: 206-628-2111 Securities registered pursuant to Section 12(b) of the Act: Title of each class Name of each exchange on which registered Common stock, without par value New York Stock Exchange Securities registered pursuant to Section 12(g) of the Act: None Indicate by check mark if the registrant is a well-known seasoned issuer, as defined in Rule 405 of the Securities Act. YES  NO  Indicate by check mark if the registrant is not required to file reports pursuant to Section 13 or Section 15(d) of the Act. YES  NO  Indicate by check mark whether the registrant (1) has filed all reports required to be filed by Section 13 or 15(d) of the Securities Exchange Act of 1934 during the preceding 12 months (or for such shorter period that the Registrant was required to file such reports), and (2) has been subject to such filing requirements for the past 90 days. YES  NO  Indicate by check mark if disclosure of delinquent filers pursuant to Item 405 of Regulation S-K is not contained herein, and will not be contained, to the best of registrant’s knowledge, in definitive proxy or information statements incorporated by reference in Part III of this Form 10-K or any amendment to this Form 10-K.  Indicate by check mark whether the registrant is a large accelerated filer, an accelerated filer, or a non-accelerated filer. See definition of “accelerated filer and large accelerated filer” in Rule 12b-2 of the Exchange Act (Check one): Large accelerated filer  Accelerated filer  Non-accelerated filer  Indicate by check mark whether the registrant is a shell company (as defined in Rule 12b-2 of the Act). YES  NO  As of July 28, 2006 the aggregate market value of the Registrant’s voting and non-voting stock held by non-affiliates of the Registrant was approximately $6.8 billion using the closing sales price on that day of $33.84. On March 2, 2007, 257,535 shares of common stock were outstanding (in thousands). DOCUMENTS INCORPORATED BY REFERENCE Portions of the Proxy Statement for the 2007 Annual Meeting of Shareholders scheduled to be held on May 22, 2007 are incorporated into Part III 1 Nordstrom, Inc. and subsidiaries
  • 20. [This page intentionally left blank.] 2
  • 21. TABLE OF CONTENTS Page PART I Item 1. Business. 4 Item 1A. Risk Factors. 5 Item 1B. Unresolved Staff Comments. 7 Item 2. Properties. 7 Item 3. Legal Proceedings. 10 Item 4. Submission of Matters to a Vote of Security Holders. 10 PART II Item 5. Market for Registrant’s Common Equity, Related Shareholder Matters and Issuer Purchases of Equity Securities. 10 Item 6. Selected Financial Data. 12 Item 7. Management’s Discussion and Analysis of Financial Condition and Results of Operations. 14 Item 7A. Quantitative and Qualitative Disclosures About Market Risk. 25 Item 8. Financial Statements and Supplementary Data. 26 Item 9. Changes in and Disagreements With Accountants on Accounting and Financial Disclosure. 52 Item 9A. Controls and Procedures. 52 Item 9B. Other Information. 52 PART III Item 10. Directors, Executive Officers and Corporate Governance of the Registrant. 52 Item 11. Executive Compensation. 52 Item 12. Security Ownership of Certain Beneficial Owners and Management and Related Shareholder Matters. 53 Item 13. Certain Relationships and Related Transactions. 53 Item 14. Principal Accountant Fees and Services. 53 PART IV Item 15. Exhibits, Financial Statement Schedules. 53 Signatures 54 Consent of Independent Registered Public Accounting Firm 55 Schedule II – Valuation and Qualifying Accounts 56 Exhibit Index 58 3 Nordstrom, Inc. and subsidiaries
  • 22. PART I Item 1. Business. DESCRIPTION OF BUSINESS Nordstrom incorporated in the state of Washington in 1946 as the successor to a retail shoe business that started in 1901. We are one of the nation’s leading fashion specialty retailers, with 155 U.S. stores located in 27 states. The west coast and east coast are the areas in which we have the largest presence. Nordstrom is comprised of four segments: Retail Stores, Credit, Direct, and Other. Retail Stores derives its revenues from sales of high-quality apparel, shoes, cosmetics and accessories. It includes our 98 Full-Line ‘Nordstrom’ stores, 50 discount ‘Nordstrom Rack’ stores, two clearance stores that operate under the name ‘Last Chance,’ and one free-standing shoe store. The Nordstrom Rack stores serve as outlets for clearance merchandise from our Full-Line stores and purchase merchandise directly from manufacturers. In 2006, we opened one Full-Line store (Palm Beach Gardens, Florida), relocated one Full-Line Store (Canoga Park, California) and opened one Rack store (San Marcos, California). In 2007, we are scheduled to open three Full-Line stores (Natick, Massachusetts; Novi, Michigan; Denver, Colorado) and one Rack store (Tukwila, Washington). In 2008, we are scheduled to open eight Full-Line stores and relocate one Full-Line store. Through our wholly owned federal savings bank, Nordstrom fsb, we offer a private label card, two co-branded Nordstrom VISA credit cards and a debit card for Nordstrom purchases. The credit and debit cards feature a shopping-based loyalty program designed to increase customer visits and spending in our Retail Stores and Direct segments. Our Credit segment generates earnings through finance charges and securitization-related gains on these cards. Direct generates revenues from sales of high-quality apparel, shoes, cosmetics and accessories by serving our customers on the Web at www.nordstrom.com and through our catalogs. Most of the Direct segment’s sales are shipped via third-party carriers from our fulfillment center in Cedar Rapids, Iowa. Our Other segment includes our four U.S. based ‘Façonnable’ boutiques and the 36 Façonnable boutiques located in France, Portugal and Belgium. Façonnable is a wholesaler and retailer of high quality men’s, women’s and boys’ apparel and accessories with distribution to over 45 countries. Façonnable has licensee and franchisee agreements with others who operate wholesale distribution and/or boutique locations in Spain, Turkey, Greece, the Middle East, Taiwan, Canada and Latin America. The Other segment also includes our product development team, called Nordstrom Product Group, which designs and coordinates the production of private label merchandise sold in our retail stores. In addition, this segment includes our corporate center operations. For more information about our business and our reportable segments, see Item 7, “Management’s Discussion and Analysis of Financial Condition and Results of Operation” on page 14 and Note 15 of the Notes to Consolidated Financial Statements in Item 8 on page 48. FISCAL YEAR END Our fiscal year ends on the Saturday closest to January 31st. References to 2006 relate to the 53-week fiscal year ended February 3, 2007. References to 2005 and 2004 relate to the 52-week fiscal years ended January 28, 2006 and January 29, 2005. References to 2007 relate to the 52 weeks ending February 2, 2008. TRADEMARKS We have approximately 169 registered trademarks or trademark applications. Our most notable trademarks include Nordstrom, Nordstrom Rack, Façonnable, Caslon, John W. Nordstrom, and Classiques Entier. Each of our trademarks is renewable indefinitely provided that it is still used in commerce at the time of the renewal. RETURN POLICY We offer our customers a fair and liberal return policy at our Full-Line stores and Nordstrom Direct (online and catalog). Our Nordstrom Rack stores accept returns up to 30 days from the date of purchase. In general, our return policy is somewhat more generous than industry standards. We utilize historical return patterns to estimate our expected returns. SEASONALITY Due to our anniversary sale in July and the holidays in December, sales are higher for our Retail Stores in the second and fourth quarters of the fiscal year than in the first and third quarters. INVENTORY We plan our merchandise purchases and receipts to coincide with the selling patterns that we expect. For instance, we purchase and receive a larger amount of merchandise in the fall as we prepare for the holiday shopping season (from late November through early January). Also, our merchandise purchases and receipts increase prior to our Anniversary Sale, which extends over the last two weeks of July. We pay for our merchandise purchases under the terms established with our vendors, which is usually within 30 days of the date that the merchandise was shipped to us. In order to offer merchandise that our customers want, we purchase merchandise from a wide variety of high-quality suppliers. In 2006, our ten largest suppliers accounted for approximately 21% of our merchandise purchases. We also have arrangements with agents and contract manufacturers to produce our private label merchandise. We do not have long-term purchase commitments or arrangements with any of our 4
  • 23. merchandise suppliers. Our suppliers include domestic and foreign businesses. We expect our suppliers to meet our “Nordstrom Partnership: Standards and Business Practice Guidelines,” which address our standards for matters such as law, labor, health and safety, and environment. COMPETITIVE CONDITIONS All segments of our business are highly competitive. Each of our stores competes with other national, regional and local retail establishments that may carry similar lines of merchandise, including department stores, specialty stores, boutiques, mail order and Internet businesses. Our specific competitors vary from market to market. We believe the principal methods of competing in our industry include customer service, fashion, quality of product, depth of selection, store environment and location. EMPLOYEES During 2006, we regularly employed on a full or part-time basis an average of 52,900 employees. Due to the seasonal nature of our business, employment increased to approximately 56,500 employees in July 2006 and 57,400 in December 2006. CAUTIONARY STATEMENT Certain statements in this Annual Report on Form 10-K contain “forward-looking” statements (as defined in the Private Securities Litigation Reform Act of 1995) that involve risks and uncertainties, including anticipated results, store openings and trends in our operations. Actual future results and trends may differ materially from historical results or current expectations depending upon various factors including those discussed below and elsewhere in this Annual Report on Form 10-K, particularly in Item 1A under the heading “Risk Factors”, the impact of economic and competitive market forces, terrorist activity or war may impact our customers and the retail industry, our ability to predict fashion trends, consumer apparel buying patterns, trends in personal bankruptcies and bad debt write-offs, changes in interest rates, employee relations, our ability to continue and control our expansion, remodel and investment plans, changes in government or regulatory requirements, our ability to control costs, weather conditions and hazards of nature. These and other factors could affect our financial results and cause actual results to differ materially from those contained in any forward-looking statements we may make. As a result, while we believe there is a reasonable basis for the forward-looking statements, you should not place undue reliance on those statements. We undertake no obligation to update or revise any forward-looking statements to reflect subsequent events, new information or future circumstances. SEC FILINGS We file annual, quarterly and current reports, proxy statements and other documents with the Securities and Exchange Commission (“SEC”). All material we file with the SEC is publicly available at the SEC’s Public Reference Room at 450 Fifth Street, NW, Washington, DC 20549. You may obtain information on the operation of the Public Reference Room by calling the SEC at 1-800-SEC-0330. In addition, the SEC maintains an Internet Web site at www.sec.gov that contains reports, proxy and information statements, and other information regarding issuers that file electronically with the SEC. WEB SITE ACCESS Our Internet Web site address is www.nordstrom.com. We make available free of charge on or through our Internet Web site our annual reports on Form 10-K, quarterly reports on Form 10-Q, current reports on Form 8-K, statements of changes in beneficial ownership of securities on Form 4 and amendments to those reports filed or furnished pursuant to Section 13(a) or 15(d) of the Exchange Act as soon as reasonably practicable after we electronically file the report with or furnish it to the SEC. Interested parties may also access a Webcast of quarterly earnings conference calls and other financial events over our Internet Web site. CORPORATE GOVERNANCE We have a long-standing commitment to upholding a high level of ethical standards. In addition, as required by the listing standards of the New York Stock Exchange (“NYSE”) and the rules of the SEC, we have adopted Codes of Business Conduct and Ethics for our employees, officers and directors (“Codes of Ethics”) and Corporate Governance Guidelines. We have posted on our Web site our Codes of Ethics, our Corporate Governance Guidelines, and our Committee Charters for the Audit, Compensation, Corporate Governance and Nominating, Executive, and Finance committees. These items are also available in print to any person without charge upon request to: Nordstrom, Inc. Investor Relations P.O. Box 2737 Seattle, Washington 98111 (206) 303-3200 invrelations@nordstrom.com Item 1A. Risk Factors. Our business faces many risks. We believe the risks described below outline the items of most concern to us. However, these risks may not be the only ones we face. Additional risks and uncertainties, not presently known to us or that we currently deem immaterial, may also impair our business operations. 5 Nordstrom, Inc. and subsidiaries
  • 24. ABILITY TO RESPOND TO THE BUSINESS ENVIRONMENT AND FASHION TRENDS Our sales and operating results depend in part on our ability to predict or respond to changes in fashion trends and consumer preferences in a timely manner. Any sustained failure to identify and respond to emerging trends in lifestyle and consumer preferences could have a material adverse affect on our business. Consumer spending at our stores may be affected by many factors outside of our control, including consumer confidence, weather and other hazards of nature that affect consumer traffic, and general economic conditions. INVENTORY MANAGEMENT We strive to ensure the merchandise we offer remains fresh and compelling to our customers. If we are not successful at predicting our sales trends and adjusting our purchases, we may have excess inventory, which would result in additional markdowns and reduce our operating performance. IMPACT OF COMPETITIVE MARKET FORCES The retail industry environment continues to change for many of our vendors and customers. In the future, our competition may partner more effectively with vendors to serve the market’s needs. If we do not effectively respond to changes in our environment, we may see a loss of market share to competitors, declining same-store sales, and declining profitability due to higher markdowns. STORE GROWTH STRATEGY As of February 2007, our plans for the next five years include opening 26 new or relocated stores and remodeling 69 existing stores. Our future net sales at new, relocated or remodeled stores may not meet our projections, which could reduce our operating performance. Performance in our new stores could also be impacted based on our ability to hire employees who are able to deliver the level of service customers have come to expect when shopping at our stores. In the past, our expected opening dates have sometimes been delayed because of developer plan delays. Our future growth could be negatively impacted by delays to our store opening, relocating or remodeling plans. INFORMATION SECURITY AND PRIVACY The protection of our customer, employee, and company data is critical to us. The regulatory environment surrounding information security and privacy is increasingly demanding, with the frequent imposition of new and constantly changing requirements across our business units. In addition, our customers have a high expectation that we will adequately protect their personal information. A significant breach of customer, employee, or company data could damage our reputation and result in lost sales, fines, and lawsuits. LEADERSHIP DEVELOPMENT AND SUCCESSION PLANNING The training and development of our future leaders is critical to our long-term growth. If we do not effectively implement our strategic and business planning processes to train and develop future leaders, our long-term growth may suffer. In addition, if unexpected leadership turnover occurs without established succession plans, our business may suffer. MULTI-CHANNEL STRATEGY EXECUTION In 2005, we started to make changes in our Direct business that better align our online shopping environment and catalog with the customer experience in our Full-Line stores. These changes include: aligning our Direct merchandise offering with our Full-Line stores to create a seamless experience for our customers between our stores, catalogs and Web site, linking the Full-Line stores and Direct merchandise organization; reducing the number and frequency of our Direct catalog mailings; and transitioning our Direct inventory system onto our Full-Line store platform, all while dealing with changes in the Internet market in general. Based on our online sales trends and customer feedback in 2006, we believe that our strategy shift will improve our future operating performance. We also found that the technology changes will be more challenging than we initially anticipated. Executing this strategy may cost more and take longer than expected, which could impact our future operating performance. BRAND AND REPUTATION We have a well-recognized brand that is synonymous with the highest level of customer service and quality merchandise. Any significant damage to our brand or reputation may negatively impact same-store sales, lower employee morale and productivity, and diminish customer trust, resulting in a reduction in shareholder value. CAPITAL EFFICIENCY AND PROPER ALLOCATION Our goal is to invest capital to maximize our overall long-term returns. This includes spending on inventory, capital projects and expenses, managing debt levels, managing accounts receivable through our credit business, and returning value to our shareholders through dividends and share repurchases. To a large degree, capital efficiency reflects how well we manage the other key risks to our Company. The actions taken to address other specific risks may affect how well we manage the more general risk of capital efficiency. Our recent operating results have raised expectations about our performance. If we do not properly allocate our capital to maximize returns, we may fail to continue to produce similar financial results and we may experience a reduction in shareholder value. HUMAN RESOURCE REGULATIONS Our policies and procedures are designed to comply with human resource laws such as wage and hour, meal and rest period, and commissions. Federal and state wage and hour laws are complex, and the related enforcement is increasingly aggressive, particularly in the state of California. Failure to comply with these laws could result in damage to our reputation, class action lawsuits, and dissatisfied employees. 6
  • 25. EMPLOYMENT AND DISCRIMINATION LAWS State and federal employment and discrimination laws and the related case law continue to evolve, making ongoing compliance in this area a challenge. Failure to comply with these laws may result in damage to our reputation, legal and settlement costs, disruption of our business, and loss of customers and employees, which would result in a loss of net sales and increased employment costs, low employee morale and attendant harm to our business and results of operations. TECHNOLOGY STRATEGY We make investments in information technology to sustain our competitive position. We expect to spend approximately $170 million each year on information technology operations and system development, which is key to our growth strategy. We must monitor and choose the right investments and implement them at the right pace. Targeting the wrong opportunities, failing to make the best investment, or making an investment commitment significantly above or below the requirements of the business opportunity may result in the loss of our competitive position. In addition, an inadequate investment in maintaining our current systems may result in a loss of system functionality and increased future costs to bring our systems up to date. We may implement too much technology, or change too fast, which could result in failure to adopt the new technology if the business is not ready or capable of accepting it. Excessive technological change affects the effectiveness of adoption, and could adversely affect the realization of benefits from the technology. However, not implementing enough technology could compromise our competitive position. REGULATORY COMPLIANCE Our policies and procedures are designed to comply with all applicable laws and regulations, including those imposed by the SEC, NYSE, the banking industry, and foreign countries. Additional legal and regulatory requirements such as the Sarbanes-Oxley Act have increased the complexity of the regulatory environment. In addition, foreign laws may conflict with domestic laws. Failure to comply with the various regulations may result in damage to our reputation, civil and criminal liability, fines and penalties, increased cost of regulatory compliance, and restatements of financial statements. ANTI-TAKEOVER PROVISIONS We are incorporated in the state of Washington and subject to Washington state law. Some provisions of Washington state law could interfere with or restrict takeover bids or other change in control events affecting us. For example, one statutory provision prohibits us, except under specified circumstances, from engaging in any significant business transaction with any shareholder who owns 10% or more of our common stock (which shareholder, under the statute, would be considered an “acquiring person”) for a period of five years following the time that such shareholder became an acquiring person. Item 1B. Unresolved Staff Comments. None. Item 2. Properties. The following table summarizes the number of retail stores owned or leased by us, and the percentage of total store square footage represented by each listed category at February 3, 2007: % of total store Number of Stores square footage Owned stores 32 25.3% Owned on leased land 45 43.1% Leased stores 111 30.1% Partly owned and partly leased 3 1.5% Total 191 100.0% We also own six merchandise distribution centers located in Portland, Oregon; Dubuque, Iowa; Ontario, California; Newark, California; Upper Marlboro, Maryland; and Gainesville, Florida, which are utilized by the Retail Stores segment. The Direct segment utilizes one fulfillment center in Cedar Rapids, Iowa, which is owned on leased land. Our administrative offices in Seattle, Washington are a combination of leased and owned space. For one of our corporate office buildings in Seattle, we own a 49% interest in a limited partnership which constructed the office building in which we are the primary tenant. During 2002, the limited partnership refinanced its construction loan obligation with a mortgage secured by the property. This mortgage is included in our long-term debt and is amortized as we make rental payments to the limited partnership over the life of the mortgage. We also lease an office building in the Denver, Colorado metropolitan area that serves as an office of Nordstrom fsb and Nordstrom Credit, Inc. 7 Nordstrom, Inc. and subsidiaries
  • 26. The following table lists our retail store facilities as of February 3, 2007: Year Year Square Store Square Store Location Store Name Footage Opened Location Store Name Footage Opened Full-Line Stores ALASKA ILLINOIS Anchorage Anchorage 97,000 1975 Chicago Michigan Avenue 274,000 2000 Oak Brook Oakbrook Center 249,000 1991 ARIZONA Schaumburg Woodfield Shopping Center 215,000 1995 Chandler Chandler Fashion Center 149,000 2001 Skokie Old Orchard Center 209,000 1994 Scottsdale Scottsdale Fashion Square 235,000 1998 INDIANA CALIFORNIA Indianapolis Circle Centre 216,000 1995 Arcadia Santa Anita 151,000 1994 Brea Brea Mall 195,000 1979 KANSAS Canoga Park Topanga 213,000 1984 Overland Park Oak Park Mall 219,000 1998 Cerritos Los Cerritos Center 122,000 1981 Corte Madera The Village at Corte Madera 116,000 1985 MARYLAND Costa Mesa South Coast Plaza 235,000 1978 Annapolis Annapolis Mall 162,000 1994 Escondido North County 156,000 1986 Bethesda Montgomery Mall 225,000 1991 Glendale Glendale Galleria 147,000 1983 Columbia The Mall in Columbia 173,000 1999 Irvine Irvine Spectrum Center 130,000 2005 Towson Towson Town Center 205,000 1992 Los Angeles The Grove 120,000 2002 Los Angeles Westside Pavilion 150,000 1985 MICHIGAN Mission Viejo The Shops at Mission Viejo 172,000 1999 Troy Somerset Collection 258,000 1996 Montclair Montclair Plaza 134,000 1986 Palo Alto Stanford Shopping Center 187,000 1984 MINNESOTA Pleasanton Stoneridge Mall 173,000 1990 Bloomington Mall of America 240,000 1992 Redondo Beach South Bay Galleria 161,000 1985 Riverside The Galleria at Tyler in Riverside 164,000 1991 MISSOURI Roseville Galleria at Roseville 149,000 2000 Des Peres West County 193,000 2002 Sacramento Arden Fair 190,000 1989 San Diego Fashion Valley 220,000 1981 NEVADA San Diego Horton Plaza 151,000 1985 Las Vegas Fashion Show 207,000 2002 San Diego University Towne Center 130,000 1984 San Francisco San Francisco Centre 350,000 1988 NEW JERSEY San Francisco Stonestown Galleria 174,000 1988 Edison Menlo Park 204,000 1991 San Jose Valley Fair 232,000 1987 Freehold Freehold Raceway Mall 174,000 1992 San Mateo Hillsdale Shopping Center 149,000 1982 Paramus Garden State Plaza 282,000 1990 Santa Ana MainPlace/Santa Ana 169,000 1987 Short Hills The Mall at Short Hills 188,000 1995 Santa Barbara Paseo Nuevo in Santa Barbara 186,000 1990 Walnut Creek Broadway Plaza 193,000 1984 NEW YORK Garden City Roosevelt Field 241,000 1997 COLORADO White Plains The Westchester 219,000 1995 Broomfield FlatIron Crossing 172,000 2000 Littleton Park Meadows 245,000 1996 NORTH CAROLINA Charlotte SouthPark 151,000 2004 CONNECTICUT Durham The Streets at Southpoint 149,000 2002 Farmington Westfarms 189,000 1997 OHIO FLORIDA Beachwood Beachwood Place 231,000 1997 Boca Raton Town Center at Boca Raton 193,000 2000 Columbus Easton Town Center 174,000 2001 Coral Gables Village of Merrick Park 212,000 2002 Miami Dadeland Mall 150,000 2004 OREGON Orlando The Florida Mall 174,000 2002 Portland Clackamas Town Center 121,000 1981 Palm Beach Gardens The Gardens 150,000 2006 Portland Downtown Portland 174,000 1966 Tampa International Plaza 172,000 2001 Portland Lloyd Center 150,000 1963 Wellington The Mall at Wellington Green 127,000 2003 Salem Salem Center 71,000 1980 Tigard Washington Square 189,000 1974 GEORGIA Atlanta Perimeter Mall 243,000 1998 PENNSYLVANIA Atlanta Phipps Plaza 140,000 2005 King of Prussia The Plaza at King of Prussia 238,000 1996 Buford Mall of Georgia 172,000 2000 8
  • 27. Year Year Square Store Square Store Location Store Name Footage Opened Location Store Name Footage Opened Full-Line Stores (Cont.) Nordstrom Rack Group RHODE ISLAND Chandler, AZ Chandler Festival Rack 37,000 2000 Providence Providence Place 206,000 1999 Phoenix, AZ Last Chance 48,000 1992 Scottsdale, AZ Scottsdale Promenade Rack 38,000 2000 TEXAS Brea, CA Brea Union Plaza Rack 45,000 1999 Austin Barton Creek Square 150,000 2003 Chino, CA Chino Spectrum Towne Center Rack 38,000 1987 Dallas Galleria Dallas 249,000 1996 Colma, CA Colma Rack 31,000 1987 Dallas NorthPark Center 212,000 2005 Costa Mesa, CA Metro Pointe at South Coast Rack 50,000 1983 Frisco Stonebriar Centre 149,000 2000 Fresno, CA Villaggio Retail Center Rack 32,000 2002 Houston Houston Galleria 226,000 2003 Glendale, CA Glendale Fashion Center Rack 36,000 2000 Hurst NorthEast Mall 149,000 2001 Long Beach, CA Long Beach CityPlace Rack 33,000 2002 San Antonio The Shops at La Cantera 149,000 2005 Los Angeles, CA The Promenade at Howard Hughes 41,000 2001 Center Rack UTAH Ontario, CA Ontario Mills Mall Rack 40,000 2002 Murray Fashion Place 110,000 1981 Oxnard, CA Esplanade Shopping Center Rack 38,000 2001 Orem University Mall 122,000 2002 Roseville, CA Creekside Town Center Rack 36,000 2001 Sacramento, CA Howe `Bout Arden Center Rack 54,000 1999 VIRGINIA San Diego, CA Mission Valley Rack 57,000 1985 Arlington The Fashion Centre at 241,000 1989 San Francisco, CA 555 Ninth Street Retail Center 43,000 2001 Pentagon City Rack Dulles Dulles Town Center 148,000 2002 San Jose, CA Westgate Mall Rack 48,000 1998 McLean Tysons Corner Center 211,000 1988 San Leandro, CA San Leandro Rack 44,000 1990 Norfolk MacArthur Center 166,000 1999 San Marcos, CA Grand Plaza Rack 35,000 2006 Richmond Short Pump Town Center 128,000 2003 Woodland Hills, CA Topanga Rack 64,000 1984 Broomfield, CO Flatiron Marketplace Rack 36,000 2001 WASHINGTON Littleton, CO Meadows Marketplace Rack 34,000 1998 Bellevue Bellevue Square 285,000 1967 Miami, FL Last Chance 26,000 2005 Lynnwood Alderwood 151,000 1979 Sunrise, FL The Oasis at Sawgrass Mills Rack 27,000 2003 Seattle Downtown Seattle 383,000 1963 Buford, GA Mall of Georgia Crossing Rack 44,000 2000 Seattle Northgate 122,000 1965 Honolulu, HI Ward Centers Rack 34,000 2000 Spokane Spokane 137,000 1974 Chicago, IL The Shops at State and 41,000 2003 Tacoma Tacoma Mall 134,000 1966 Washington Rack Tukwila Southcenter 170,000 1968 Northbrook, IL Northbrook Rack 40,000 1996 Vancouver Vancouver 71,000 1977 Oak Brook, IL The Shops at Oak Brook Place Rack 42,000 2000 Schaumburg, IL Woodfield Rack 45,000 1994 Other Gaithersburg, MD Gaithersburg Rack 49,000 1999 Towson, MD Towson Rack 31,000 1992 Honolulu, HI Ward Centers Shoes 16,000 1997 Grand Rapids, MI Centerpointe Mall Rack 40,000 2001 Façonnable U.S. (4 boutiques) 53,000 Troy, MI Troy Marketplace Rack 40,000 2000 Façonnable International (36 boutiques) 96,000 Bloomington, MN Mall of America Rack 41,000 1998 Las Vegas, NV Silverado Ranch Plaza Rack 33,000 2001 Westbury, NY The Mall at the Source Rack 48,000 1997 Beaverton, OR Tanasbourne Town Center Rack 53,000 1998 Clackamas, OR Clackamas Promenade Rack 28,000 1983 Portland, OR Downtown Portland Rack 32,000 1986 King of Prussia, PA The Overlook at King of 45,000 2002 Prussia Rack Hurst, TX The Shops at North East Mall Rack 40,000 2000 Plano, TX Preston Shepard Place Rack 39,000 2000 Salt Lake City, UT Sugarhouse Rack 31,000 1991 Sterling, VA Dulles Town Crossing Rack 41,000 2001 Woodbridge, VA Potomac Mills Rack 46,000 1990 Auburn, WA SuperMall of the Great 48,000 1995 Northwest Rack Bellevue, WA Factoria Mall Rack 46,000 1997 Lynnwood, WA Golde Creek Plaza Rack 38,000 1985 Seattle, WA Downtown Seattle Rack 42,000 1987 Spokane, WA NorthTown Mall Rack 28,000 2000 We plan to open three Full-Line stores and one Rack store in 2007 and eight Full-Line stores in 2008. 9 Nordstrom, Inc. and subsidiaries
  • 28. Item 3. Legal Proceedings. COSMETICS We were originally named as a defendant along with other department store and specialty retailers in nine separate but virtually identical class action lawsuits filed in various Superior Courts of the State of California in May, June and July 1998 that were consolidated in Marin County Superior Court. In May 2000, plaintiffs filed an amended complaint naming a number of manufacturers of cosmetics and fragrances and two other retailers as additional defendants. Plaintiffs’ amended complaint alleged that the retail price of the “prestige” or “Department Store” cosmetics and fragrances sold in department and specialty stores was collusively controlled by the retailer and manufacturer defendants in violation of the Cartwright Act and the California Unfair Competition Act. Plaintiffs sought treble damages and restitution in an unspecified amount, attorneys’ fees and prejudgment interest, on behalf of a class of all California residents who purchased cosmetics and fragrances for personal use from any of the defendants during the four years prior to the filing of the original complaints. While we believe that the plaintiffs’ claims are without merit, we entered into a settlement agreement with the plaintiffs and the other defendants on July 13, 2003 in order to avoid the cost and distraction of protracted litigation. In furtherance of the settlement agreement, the case was re-filed in the United States District Court for the Northern District of California on behalf of a class of all persons who currently reside in the United States and who purchased “Department Store” cosmetics and fragrances from the defendants during the period May 29, 1994 through July 16, 2003. The Court gave preliminary approval to the settlement, and a summary notice of class certification and the terms of the settlement was disseminated to class members. On March 30, 2005, the Court entered a final judgment approving the settlement and dismissing the plaintiffs’ claims and the claims of all class members with prejudice, in their entirety. On April 29, 2005, two class members who had objected to the settlement filed notices of appeal from the Court’s final judgment to the United States Court of Appeals for the Ninth Circuit. One of the objectors has since dropped her appeal, but the other filed her appeal brief on March 20, 2006. Plaintiffs’ and defendants’ briefs were filed on May 25, 2006. The remaining objector filed her reply brief on June 14, 2006. The Ninth Circuit heard oral arguments on the appeal on March 14, 2007. It is uncertain how long the Ninth Circuit will take to issue its decision or when the appeal will be resolved. If the District Court’s final judgment approving the settlement is affirmed on appeal, or the appeal is dismissed, the defendants will provide class members with certain free products with an estimated retail value of $175 million and pay the plaintiffs’ attorneys’ fees, awarded by the Court, of $24 million. We do not believe the outcome of this matter will have a material adverse effect on our financial condition, results of operations or cash flows. OTHER We are involved in routine claims, proceedings, and litigation arising from the normal course of our business. We do not believe any such claim, proceeding or litigation, either alone or in aggregate, will have a material impact on our financial condition, results of operations, or cash flows. Item 4. Submission of Matters to a Vote of Security Holders. None. PART II Item 5. Market for Registrant’s Common Equity, Related Shareholder Matters and Issuer Purchases of Equity Securities. MARKET, SHAREHOLDER, AND DIVIDEND INFORMATION Our common stock, without par value, is traded on the New York Stock Exchange under the symbol “JWN.” The approximate number of holders of common stock as of March 14, 2007 was 151,926, based upon the number of registered and beneficial shareholders, as well as the number of employee shareholders in the Nordstrom 401(k) Plan and Profit Sharing. The high and low sales prices of our common stock and dividends declared for each quarter of 2006 and 2005 are presented in the table below: Common Stock Price 2006 2005 Dividends per Share High Low High Low 2006 2005 1st Quarter $42.90 $37.51 $28.14 $23.91 $0.105 $0.065 2nd Quarter $39.50 $31.77 $37.46 $25.22 $0.105 $0.085 3rd Quarter $49.52 $32.97 $37.96 $30.41 $0.105 $0.085 4th Quarter $57.10 $45.37 $42.74 $33.58 $0.105 $0.085 Full Year $57.10 $31.77 $42.74 $23.91 $0.42 $0.32 10
  • 29. REPURCHASES (Dollars in millions except per share amounts) A summary of our fourth quarter share repurchases are as follows: Average Total Number of Shares Total Number of Price Paid (or Units) Purchased as Maximum Number (or Approximate Dollar Shares (or Units) Per Share Part of Publicly Announced Value) of Shares (or Units) that May Yet Be Purchased Under the Plans or Programs2 Period Purchased (or Unit) Plans or Programs Nov. 2006 (10/29/06 to 11/25/06) — — — $617.4 530,4001 Dec. 2006 (11/26/06 to 12/30/06) $49.09 529,800 $591.4 Jan. 2007 (12/31/06 to 2/3/07) — — — $591.4 Total 530,400 $49.09 529,800 1 Included in this balance are 600 shares that were not redeemed as part of a publicly announced repurchase plan or program. These shares were tendered by an employee to Nordstrom for tax withholding purposes. 2 In May 2006, our Board of Directors authorized a $1,000.0 share repurchase program. The prior $500.0 repurchase program, which was started in February 2005, was completed during the first quarter of 2006. During 2006, we purchased 5,422,362 shares of our common stock for an aggregate purchase price of $212.9 (an average price per share of $39.27) under the prior repurchase program. We purchased 11,122,977 shares of our common stock for an aggregate purchase price of $408.6 (an average price per share of $36.74) under the current repurchase program. As of February 3, 2007 the unused authorization was $591.4. The actual amount and timing of future share repurchases will be subject to market conditions and applicable SEC rules. STOCK PRICE PERFORMANCE The following graph compares, for each of the last five fiscal years, ending February 3, 2007, the cumulative total return of Nordstrom, Inc. common stock, Standard & Poor’s 500 Index and Standard & Poor’s Retail Index. The Retail Index is comprised of 38 retail companies, including the Company, representing a sector of the Standard & Poor’s 500 Index. The cumulative total return of Nordstrom, Inc. common stock assumes $100 invested on January 31, 2002 in Nordstrom, Inc. common stock and assumes reinvestment of dividends. End of fiscal year: 2001 2002 2003 2004 2005 2006 Standard & Poor’s 500 Index 100 76 100 104 114 128 Standard & Poor’s Retail Index 100 71 105 119 129 147 Nordstrom, Inc. common stock 100 73 161 197 354 479 11 Nordstrom, Inc. and subsidiaries
  • 30. Item 6. Selected Financial Data. (Dollars in thousands except sales per square foot and per share amounts) The following selected financial data are derived from the audited Consolidated Financial Statements and should be read in conjunction with Item 1A “Risk Factors,” Item 7 “Management’s Discussion and Analysis of Financial Condition and Results of Operation,” and the Consolidated Financial Statements and the related notes included in Item 8 of this Annual Report on Form 10-K. 20024 Fiscal year 2006 2005 2004 2003 2001 Operations Net sales $8,560,698 $7,722,860 $7,131,388 $6,448,678 $5,944,656 $5,607,687 Same-store sales percentage increase (decrease)1 7.5% 6.0% 8.5% 4.1% 1.4% (2.9%) Gross profit 3,206,749 2,834,837 2,572,000 2,233,132 1,974,634 1,844,133 Gross profit rate2 37.5% 36.7% 36.1% 34.6% 33.2% 32.9% Selling, general, and administrative expenses (2,296,863) (2,100,666) (2,020,233) (1,899,129) (1,783,210) (1,698,497) Selling, general, and administrative rate3 26.8% 27.2% 28.3% 29.4% 30.0% 30.3% Operating income 909,886 734,171 551,767 334,003 191,424 145,636 Interest expense, net (42,758) (45,300) (77,428) (90,952) (81,921) (75,038) Other income including finance charges, net 238,525 196,354 172,942 155,090 139,289 133,890 195,6245 Earnings before income tax expense 1,105,653 885,225 647,281 398,141 204,488 Earnings before income tax expense as a percentage 3.3%5 of net sales 12.9% 11.5% 9.1% 6.2% 3.6% Net earnings 677,999 551,339 393,450 242,841 90,224 124,688 Net earnings as a percentage of net sales 7.9% 7.1% 5.5% 3.8% 1.5% 2.2% Earnings per diluted share $2.55 $1.98 $1.38 $0.88 $0.33 $0.46 Dividends per share $0.42 $0.32 $0.24 $0.205 $0.19 $0.18 Return on average shareholders’ equity 31.8% 28.4% 23.0% 16.2% 6.7% 9.8% Sales per square foot $393 $369 $347 $325 $317 $319 Financial Position (at year end) Customer accounts receivable, net $608,599 $566,815 $580,397 $594,900 $606,861 $621,491 Investment in asset backed securities 428,175 561,136 422,416 272,294 124,543 58,539 Merchandise inventories 997,289 955,978 917,182 901,623 953,112 888,172 Current assets 2,742,193 2,874,157 2,572,444 2,524,843 2,125,356 2,095,317 Current liabilities 1,433,143 1,623,312 1,341,152 1,122,559 925,978 986,587 Land, buildings and equipment, net 1,757,215 1,773,871 1,780,366 1,807,778 1,849,961 1,761,082 Long-term debt, including current portion 630,452 934,394 1,030,107 1,234,243 1,350,595 1,424,242 Shareholders’ equity 2,168,521 2,092,681 1,788,994 1,634,009 1,372,864 1,316,245 Debt-to-capital ratio 22.5% 30.9% 36.5% 43.0% 49.6% 52.0% Book value per share 8.43 7.76 6.59 5.90 5.07 4.89 Total assets 4,821,578 4,921,349 4,605,390 4,569,233 4,185,269 4,084,356 Store Information (at year end) Full-Line stores 98 98 94 92 88 80 Rack and other stores 57 57 56 56 55 52 International Façonnable boutiques 36 32 31 31 23 24 Total square footage 20,170,000 20,070,000 19,397,000 19,138,000 18,428,000 17,048,000 1 Same-stores include stores that have been open at least one full year at the beginning of the year. Fiscal year 2006 includes an extra week (the 53 rd week) as a result of our 4-5-4 retail reporting calendar. The 53 rd week is not included in same-store sales calculations. 2 Gross profit rate is calculated as the gross profit as a percentage of net sales. 3 Selling, general, and administrative rate is calculated as the selling, general, and administrative expenses as a percentage of net sales. 4 2002 - The items below amounted to a net $90,638 charge ($71,041, net of tax, or $0.26 per diluted share): • Selling, general and administrative expenses included an impairment charge of $15,570 related to the write-down of an information technology investment in a supply chain software application in our private label business. • We purchased the outstanding shares of Nordstrom.com, Inc. series C preferred stock for $70,000. The minority interest purchase and reintegration costs resulted in a one- time charge of $53,168. No tax benefit was recognized as there was no possibility of a future tax benefit. • When we adopted SFAS No. 142, Goodwill and Other Intangible Assets, our initial impairment test of the Façonnable Business Unit resulted in an impairment charge to acquired tradename of $16,133 and to goodwill of $5,767. The impairment charge is reflected as a cumulative effect of accounting change ($13,359, net of tax). 5 In 2002, earnings before income tax expense and earnings before income tax expense as a percentage of net sales do not include the cumulative effect of an accounting change of $13,359, net of tax of $8,541. 12
  • 31. (Dollars in thousands except sales per square foot and per share amounts) 20004 19995 Fiscal year 1998 1997 1996 Operations Net sales $5,511,908 $5,144,754 $5,049,182 $4,864,604 $4,457,931 Same-store sales percentage increase (decrease)1 0.3% (1.1%) (2.7%) 4.0% 0.6% Gross profit 1,854,220 1,781,929 1,704,237 1,568,791 1,378,472 Gross profit rate2 33.6% 34.6% 33.8% 32.2% 30.9% Selling, general, and administrative expenses (1,722,247) (1,516,259) (1,429,837) (1,338,235) (1,232,860) Selling, general, and administrative rate3 31.2% 29.5% 28.3% 27.5% 27.7% Operating income 131,973 265,670 274,400 230,556 145,612 Interest expense, net (62,698) (50,396) (47,091) (34,250) (39,400) Other income including finance charges, net 130,600 116,783 110,414 110,907 135,331 Earnings before income tax expense 167,018 332,057 337,723 307,213 241,543 Earnings before income tax expense as a percentage of net sales 3.0% 6.5% 6.7% 6.3% 5.4% Net earnings 101,918 202,557 206,723 186,213 146,316 Net earnings as a percentage of net sales 1.8% 3.9% 4.1% 3.8% 3.3% Earnings per diluted share $0.39 $0.73 $0.70 $0.60 $0.45 Dividends per share $0.175 $0.16 $0.15 $0.1325 $0.125 Return on average shareholders’ equity 8.4% 16.3% 15.0% 12.8% 10.2% Sales per square foot $341 $349 $362 $384 $377 Financial Position (at year end) Customer accounts receivable, net $649,504 $557,190 $560,564 $621,704 $661,332 Investment in asset backed securities 50,183 38,830 7,097 20,158 31,791 Merchandise inventories 945,687 797,845 750,269 826,045 719,919 Current assets 1,812,982 1,564,648 1,668,689 1,613,492 1,549,819 Current liabilities 950,568 866,509 794,490 979,031 795,321 Land, buildings and equipment, net 1,599,938 1,429,492 1,378,006 1,252,513 1,152,454 Long-term debt, including current portion 1,112,296 804,982 868,234 420,865 380,632 Shareholders’ equity 1,233,445 1,185,614 1,300,545 1,458,950 1,457,084 Debt-to-capital ratio 49.2% 42.5% 42.1% 31.9% 27.2% Book value per share 4.61 4.48 4.58 4.78 4.57 Total assets 3,608,503 3,062,081 3,103,689 2,890,664 2,726,495 Store Information (at year end) Full-Line stores 77 71 67 65 62 Rack and other stores 43 33 30 27 21 International Façonnable boutiques 20 0 0 0 0 Total square footage 16,056,000 14,487,000 13,593,000 12,614,000 11,754,000 1 Same-stores include stores that have been open at least one full year at the beginning of the year. 2 Gross profit rate is calculated as the gross profit as a percentage of net sales. 3 Selling, general, and administrative rate is calculated as the selling, general, and administrative expenses as a percentage of net sales. 4 2000 - The items below amounted to a net $56,084 charge ($34,211, net of tax, or $0.13 per diluted share): • Selling, general and administrative expenses included a charge of $13,000 for certain severance and other costs related to a change in management. • We recorded an impairment charge of $10,227, consisting of $9,627 recorded in selling, general and administrative expenses and $600 in interest expense, related to several software projects under development that were either impaired or obsolete. • We held common shares in Streamline, Inc., an Internet grocery and consumer goods delivery company. Streamline ceased its operations effective November 2000, and we wrote off our entire investment of $32,857 in Streamline. 5 1999 - The item below amounted to a net $10,000 charge ($6,111, net of tax, or $0.02 per diluted share): • Selling, general and administrative expenses included a charge of $10,000 primarily associated with the restructuring of our information technology services area. The charge consisted of $4,053 in the disposition of several software projects under development, $2,685 in employee severance and $1,206 in other miscellaneous costs. Additionally, we recorded $2,056 related to settlement costs for two lawsuits. 13 Nordstrom, Inc. and subsidiaries
  • 32. Item 7. Management’s Discussion and Analysis of Financial Condition and Results of Operations. Nordstrom is a fashion specialty retailer offering high-quality apparel, shoes, cosmetics and accessories for women, men and children. We offer a wide selection of brand name and private label merchandise. We offer our products through multiple retail channels including our Full-Line ‘Nordstrom’ stores, our discount ‘Nordstrom Rack’ stores, our ‘Façonnable’ boutiques, our catalogs and on the Internet at www.nordstrom.com. Our stores are located throughout the United States and we have 36 Façonnable boutiques located in France, Portugal, and Belgium. In addition, we offer our customers a variety of payment products and services including our loyalty program. STRATEGIC INITIATIVES We believe we are well positioned to grow the value of our business by executing our strategy through the following key initiatives: enhancing our merchandise offering within our existing product categories, improving the shopping experience for our customers across all channels, and continuing to increase our presence where our customers shop. Merchandise Strategies We’ve found that there’s a great deal of opportunity to grow our sales in existing stores simply by earning a greater share of our customers’ business across multiple product categories. Our new systems and merchandising disciplines have helped us begin to take advantage of opportunities for increased sales by enhancing our ability to keep inventories fresh and turn them more rapidly. Customers are responding favorably to “newness” across all merchandise categories, leading to meaningful gains in areas such as men’s apparel, accessories, women’s and kids’ shoes and cosmetics throughout 2006. A consistently strong performer in 2006 was our designer category, including apparel, shoes and accessories merchandise. We are continuing to expand our offering of designer merchandise. Multi-Channel Shopping Experience Our future success continues to depend upon our ability to provide our customers with a superior and fully integrated shopping experience. As a multi- channel retailer, we are uniquely positioned to respond to evolving customer needs and expectations. The necessary resources have been committed and critical projects are underway in this effort. We are installing a new inventory system, and we are expanding both our fulfillment and call centers in Cedar Rapids, Iowa. Our online store is essential to creating relationships with many of our most active and loyal customers. Many customers who start shopping with us online migrate to our stores. By giving customers a more similar shopping experience in-store and online, we’re making progress to become more relevant to today’s shoppers. Increase Our Presence Given the industry consolidation impacting many of our competitors, we see potential to gain market share and grow our business by increasing our presence where our customers live. Fortunately, we are in an advantageous position to reach new customers through building stores and enhancing our current ones. We’ve recently launched a $2.8 billion capital plan, with 80% of the dollars allocated to customer-facing investments, primarily new stores, remodels and relocations. We will continue with a disciplined approach to real estate acquisitions, adding new stores when and where they pass our criteria. Our current strategy calls for a 4% to 5% increase in square footage growth through 2011 with 26 new or relocated stores announced through 2011. OVERVIEW For the first time in our history, our earnings before income tax expense exceeded $1 billion in 2006. This result was driven primarily by the combination of continued sales growth, gross profit rate expansion and leverage of selling, general and administrative expenses. Key highlights include: We achieved positive same-store sales growth for the fifth year in a row. Same-store sales increased 7.5% on top of our 6.0% increase in • 2005 and our 8.5% increase in 2004. Our gross profit rate increased 75 basis points primarily due to merchandise margin expansion. • With the sales growth mentioned above, we leveraged our overhead costs, resulting in a 37 basis point improvement in our selling, general • and administrative expense rate. Full year earnings per diluted share increased 28.8% over last year to $2.55. • Like many other retailers, Nordstrom follows the retail 4-5-4 reporting calendar, which included an extra week in fiscal 2006 (the 53rd week). The 53rd week is not included in same-store sales calculations. 14