Download as PDF, PPTX


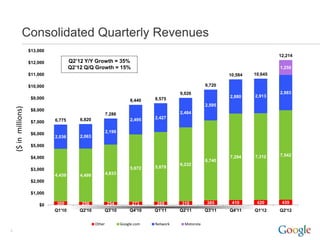
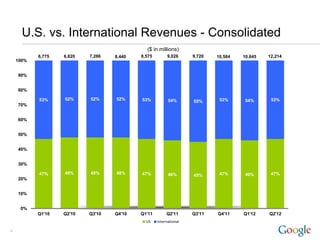
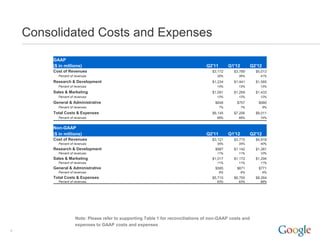
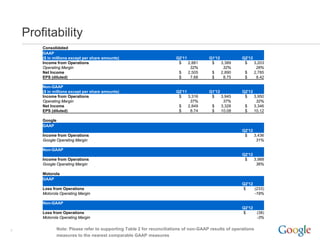
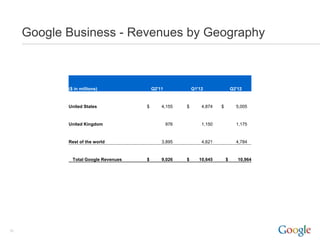


- Google reported strong revenue growth of 35% year-over-year and 15% quarter-over-quarter for Q2 2012, with consolidated revenues of $12.2 billion. - Google business revenues grew 21% year-over-year and 3% quarter-over-quarter to $11 billion, while Motorola revenues were $1.3 billion following its acquisition in May 2012. - International revenues grew and accounted for 47% of total revenues at $6.5 billion.


![Getting Started with Apache Spark: Big Data Made Simple [Free Meetup]](https://cdn.slidesharecdn.com/ss_thumbnails/apachesparkgettingstarted-260203175547-8361bcc3-thumbnail.jpg?width=640&height=640&fit=bounds)


