Download as PDF, PPTX
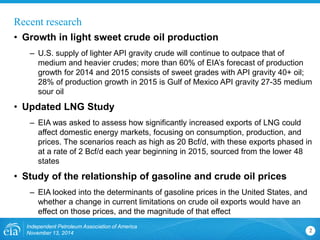
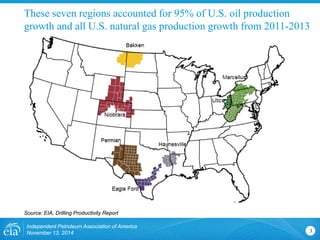
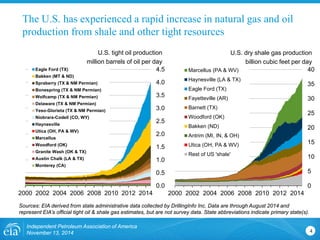
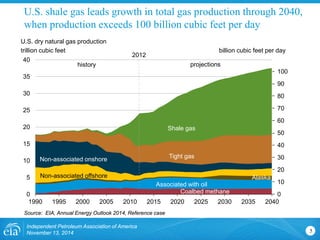
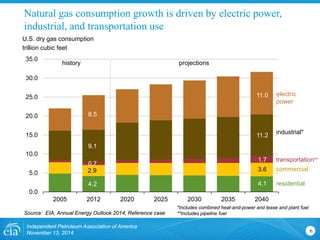
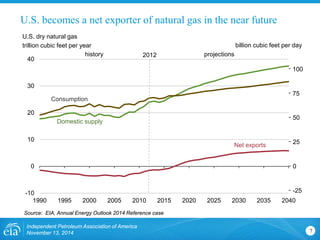
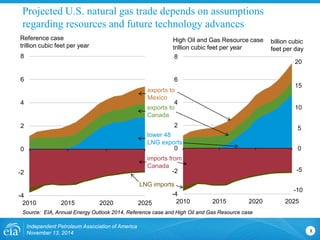
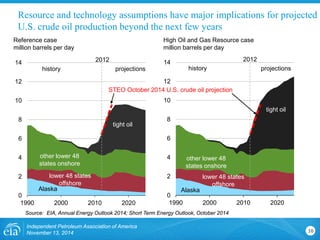
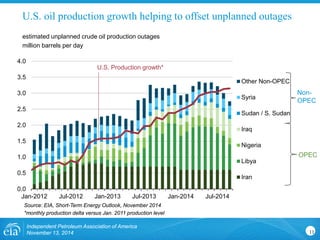

The document summarizes recent research by the U.S. Energy Information Administration (EIA) including: growth in light sweet crude oil production in the U.S.; an updated study on increased liquefied natural gas exports and their effects on domestic energy markets; and a study on the relationship between gasoline and crude oil prices. It then provides details on U.S. tight oil and shale gas production trends, projections for U.S. natural gas production and consumption, the potential for the U.S. to become a net exporter of natural gas, and considerations around crude oil production projections beyond the next few years given different resource and technology assumptions.


![Energy renaissance-outlook-2013[1]](https://cdn.slidesharecdn.com/ss_thumbnails/energy-renaissance-outlook-20131-130409141220-phpapp01-thumbnail.jpg?width=640&height=640&fit=bounds)


